Back to Journals » Clinical Interventions in Aging » Volume 12
Application of Haralick texture features in brain [18F]-florbetapir positron emission tomography without reference region normalization
Authors Campbell DL ![]() , Kang H
, Kang H ![]() , Shokouhi S
, Shokouhi S ![]()
Received 6 June 2017
Accepted for publication 3 October 2017
Published 7 December 2017 Volume 2017:12 Pages 2077—2086
DOI https://doi.org/10.2147/CIA.S143307
Checked for plagiarism Yes
Review by Single anonymous peer review
Peer reviewer comments 2
Editor who approved publication: Dr Richard Walker
Desmond L Campbell,1 Hakmook Kang,2 Sepideh Shokouhi1
On behalf of The Alzheimer’s Disease Neuroimaging Initiative
1Department of Radiology and Radiological Sciences, 2Department of Biostatistics, Vanderbilt University Medical Center, Vanderbilt University Institute of Imaging Science, Nashville, TN, USA
Objectives: Semi-quantitative image analysis methods in Alzheimer’s Disease (AD) require normalization of positron emission tomography (PET) images. However, recent studies have found variabilities associated with reference region selection of amyloid PET images. Haralick features (HFs) generated from the Gray Level Co-occurrence Matrix (GLCM) quantify spatial characteristics of amyloid PET radiotracer uptake without the need for intensity normalization. The objective of this study is to calculate several HFs in different diagnostic groups and determine the group differences.
Methods: All image and metadata were acquired through the Alzheimer’s Disease Neuroimaging Initiative database. Subjects were grouped in three ways: by clinical diagnosis, by APOE e4 allele, and by Alzheimer’s Disease Assessment Scale-cognitive subscale (ADAS-Cog) score. Several GLCM matrices were calculated for different direction and distances (1–4 mm) from multiple regions on PET images. The HFs, contrast, correlation, dissimilarity, energy, entropy, and homogeneity, were calculated from these GLCMs. Wilcoxon tests and Student t-tests were performed on Haralick features and standardized uptake value ratio (SUVR) values, respectively, to determine group differences. In addition to statistical testing, receiver operating characteristic (ROC) curves were generated to determine the discrimination performance of the selected regional HFs and the SUVR values.
Results: Preliminary results from statistical testing indicate that HFs were capable of distinguishing groups at baseline and follow-up (false discovery rate corrected p<0.05) in particular regions at much higher occurrences than SUVR (81 of 252). Conversely, we observed nearly no significant differences between all groups within ROIs at baseline or follow-up utilizing SUVR. From the ROC analysis, we found that the Energy and Entropy offered the best performance to distinguish Normal versus mild cognitive impairment and ADAS-Cog negative versus ADAS-Cog positive groups.
Conclusion: These results suggest that this technique could improve subject stratification in AD drug trials and help to evaluate the disease progression and treatment effects longitudinally without the disadvantages associated with intensity normalization.
Keywords: Haralick features, florbetapir, gray level co-occurrence matrix, energy, entropy
Introduction
Regional and voxel-based semi-quantitative image analysis methods in Alzheimer’s Disease (AD) research require normalization of positron emission tomography (PET) images before data analysis. Most amyloid-PET (Aβ-PET) studies in AD use cerebellum as the reference region,1–4 however, recent research has found variabilities associated with the cerebellar normalization of amyloid PET images.5–8 White matter (WM) can be used for Aβ-PET normalization to reduce longitudinal variability,5 increase association to clinical decline7 and cerebrospinal fluid levels of Aβ1–428 as well enhance discrimination power between subject groups.6 However, other recent studies have found impaired amyloid PET radiotracer uptake in damaged areas of WM.9 WM injury is common in aging and dementia.10–13 Therefore, the utility of WM as a reference region may depend on its structural and functional integrity, which can vary among individual subjects.
Based on these findings, we have identified that the amyloid PET normalization process poses a critical challenge for semi-quantitative PET studies in AD. In this work, we evaluate a different semi-quantitative PET approach that does not require the intensity normalization of Aβ-PET activity to a reference region activity. This method is based on Haralick features (HFs) that can be calculated from the Gray Level Co-occurrence Matrices (GLCMs) of Aβ-PET images to provide a statistical description of the spatial characteristics of amyloid PET.14 The objective of this study is to determine whether higher-order texture-based features derived from the GLCMs of [18F]-Florbetapir-PET images can identify statistically and clinically significant differences between subject groups without using a reference region for PET intensity normalization.
Methods
Alzheimer’s disease neuroimaging initiative
The data presented in this study were acquired from the Alzheimer’s Disease Neuroimaging Initiative (ADNI) database (adni.loni.usc.edu). The ADNI was launched in 2003 as a public-private partnership, led by Principal Investigator Michael W Weiner, MD. The primary goal of ADNI has been to test whether serial magnetic resonance imaging (MRI), PET, other biological markers, and clinical and neuropsychological assessment can be combined to measure the progression of mild cognitive impairment (MCI) and early AD.
Subjects
The key eligibility criteria of ADNI subject recruitment are available on the ADNI website (http://www.adni-info.org). Briefly, enrolled ADNI subjects were between the ages of 55 and 90, had a study partner able to provide an independent evaluation of functioning, and spoke either English or Spanish. All subjects gave written, informed consent before participation through their local Institutional Review Board. All images and metadata for 30 subjects (17 male, 13 female) were acquired from the ADNI database. Selected subjects for this study had undergone longitudinal [18F]-florbetapir PET scans with concurrent T1-weighted MRIs at baseline and 24-month follow-up. In addition, scores from the neuropsychological assessment Alzheimer’s Disease Assessment Scale-cognitive subscale (ADAS-Cog)15 were collected and time-matched to the nearest Aβ-PET acquisition. Table 1 illustrates the demographic and clinical data for selected subjects. The 30 subjects were stratified three ways: by clinical diagnosis (15 normal versus 15 MCI), by APOE e4 allele carrier status (14 non-carriers versus 16 carriers), and by ADAS-Cog score defined as positive by a threshold ≥9 at baseline or follow-up (16 negative versus 14 positive).
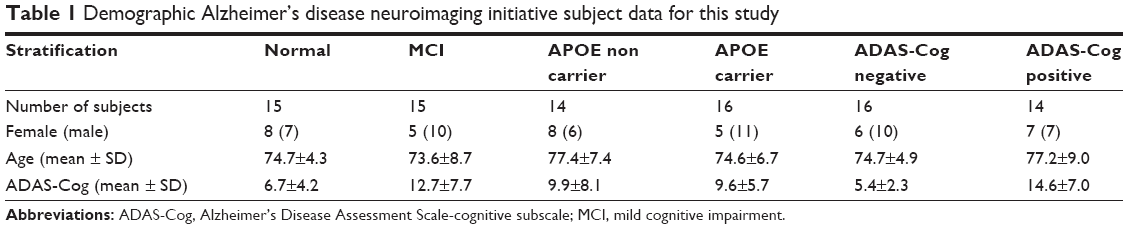 | Table 1 Demographic Alzheimer’s disease neuroimaging initiative subject data for this study |
[18F]-florbetapir PET data acquisition
All participating sites acquired the [18F]-florbetapir16 PET imaging according to standardized ADNI protocols (http://adni.loni.usc.edu/methods/pet-analysis/pre-processing/). Serial PET images for our study were acquired at 13 different centers, and the data were obtained following the dynamic protocol of and preprocessed by ADNI. Dynamic scans were 30-min 6-frame scans acquired 30–60 min after injection. All frames were coregistered to the first frame, summed, and averaged to create a single image volume.
[18F]-florbetapir PET pre-processing
We employed SPM12 (Wellcome Department of Cognitive Neurology) for image pre-processing. The gray matter fractions of 7 anatomic regions were extracted and utilized for ROI analysis: Combined precuneus/posterior cingulate cortex (PCC), left & right frontal lobes (LFL & RFL), left & right parietal lobes (LPL & RPL), left & right temporal lobes (LTL & RTL), and cerebellum for reference region normalization. For each subject, baseline T1-weighted MR image volumes defined the anatomical ROIs in native space using a maximum probability tissue labels derived from the Medical Image Computing and Computer Assisted Interventions Conference 2012 Grand Challenge and Workshop on Multi-Atlas Labeling and provided by Neuromorphometrics, Inc.17–19
Gray level co-occurrence matrix
The GLCM texture analysis is a method for evaluating higher-order statistical methods in two-dimensional (2D) images. First-order statistics metrics from histograms evaluate only pixel intensities, while GLCM assesses their spatial associations. To generate the GLCM, pixel intensities within 2D images were first discretized. The GLCM was then calculated by tabulating the occurrences of a combination of pixel values between a reference and neighboring pixels for a particular distance and direction.
We used the graycomatrix() function in MATLAB (The MathWorks, Inc., Natick, Massachusetts, USA) to generate all GLCMs. The GLCM was calculated by specifying an offset or displacement vector and counting all pairs of voxels separated by this offset having intensity levels i and j. By default, the graycomatrix function in MATLAB calculates the GLCM based on the horizontal proximity of the pixels: (0 1). That is the pixel next to the pixel of interest on the same row. However, other voxel spatial relationships can be specified by using the “Offsets” parameter as input. This approach allows for multiple GLCMs with different directions and distances to be generated from a single image. Figure 1 highlights this process for creating representative GLCMs from a sample image. For each axial slice, 34 GLCMs were calculated for different offsets (Figure 1A). Then, an average GLCM (GLCM_avg) was calculated from these individual GLCMs. The HFs were calculated from each GLCM_avg, and then the features were averaged over multiple axial slices. The calculation of the GLCM was performed in 2D mode because the graycomatrix() function requires 2D images.
 | Figure 1 (A) The coordinates of 34 offsets with respect to (0, 0). These 34 different offsets were used to calculate 33 gray level co-occurrence matrices (GLCMs) for each axial slice of a regional positron emission tomography image. (B) A representative image where two sample voxel pairs for two different offsets, (0°, distance =1) and (135°, distance =1) are highlighted. The discrete image voxel values are 1, 2, 3, and 4. (C) GLCM of image (B) for (0°, distance =1). The x and y axis represent the ordered (from low to high) voxel values of image (B). The z values represent the number of occurrences of a specific pair of voxel values (eg, 3 and 2) for a given offset (0°, distance =1). (D) GLCM of image (B) for (135°, distance =1). The x and y axis represent the ordered (from low to high) voxel values of image (B). The z values represent the number of occurrences of a specific pair of voxel values (eg, 3 and 2) for a given offset (135°, distance =1). |
Haralick features (HFs)
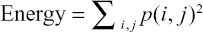
Following six HFs20,21 were calculated from the GLCM_avg matrices:
|
|
|
|

|
|

|

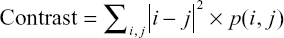
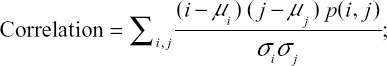
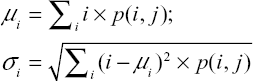
where i and j are the pixel indices and p(i, j) represents the GLCM pixel intensities. Briefly describing the HFs, Contrast measures the local variations in the GLCM. Correlation measures the linear dependence of the pixel intensity related to its position in the image. Dissimilarity is akin to Contrast with measuring local variations, however, it has a linear dependent off-diagonal of the GLCM. Energy is associated with local homogeneity in the image. Entropy, similar to how it is defined in physics, measures the spatial disorder in the GLCM. Finally, Homogeneity measures how similar the pixel intensities of the GLCM are, and thus, is akin to a measure of uniformity. It is our hypothesis that HFs may be sensitive to changes in spatial distribution and amyloid activity among different subject groups.
For this study, GLCMs were generated from the largest five axial slices through the PCC, LFL, RFL, LPL, RPL, LTL, and RTL. Before generating the GLCM, each axial slice was discretized into 128 intensity bins. For each slice, GLCMs were generated for each distance between 1 and 4 pixels at angles between 0 and 165 degrees. The average of these GLCMs was used to calculate HFs. As a standard method for comparison, the semi-quantitative regional SUVR values were calculated by normalizing the images to the cerebellar activity.
Statistical analysis
Statistical testing was performed to determine if the SUVR measurements and the selected HFs provide significant differences between stratified groups (normal versus MCI; APOE-ε4 non-carriers versus carriers; ADAS-Cog negative versus positive) at baseline and 24-month follow-up for each ROI structure. Unpaired, nonparametric Wilcoxon statistical tests were employed to compare HFs, while unpaired, Student’s t-tests were utilized for comparing SUVR measurements. A 95% CI was set, correlating to p-values <0.05 required for significant differences between stratified groups. Between 3 stratifications of groups, 7 ROIs, and two time points, 42 Student’s t-tests for SUVR were conducted, and using six different HFs, 252 total Wilcoxon tests were performed. For a group of ROIs and HFs, we controlled False Discovery Rate (FDR) at 0.05 level to deal with multiple comparisons.
In addition to statistical testing, receiver operating characteristic (ROC) curves were generated to determine the discrimination performance of the selected regional HFs and the SUVR values. Groups were stratified as described previously except that data from HFs and SUVR from baseline and 24-month follow-up were combined. The Area under the Curve (AUC) was used to quantitatively characterize each generated ROC curve.
Results
Gray Level Co-occurrence matrices were generated for slices through predefined brain structures. Shown in Figure 2 are a representative slice of the discretized PCC from a normal and MCI subject used in the GLCM creation. Qualitatively, the PCC of the normal subject has a lower intensity than the PCC of the MCI. Accompanying each PCC slice are their GLCMs, averaged over our distance and direction range. In the representative case shown, we observe a greater degree of clustering in the normal GLCM versus the MCI GLCM, which exhibits a larger spread along its diagonal. Comparing the GLCM of normal and MCI subjects, we observed GLCMs with more occurrences at greater discretized intensities for MCI subjects.
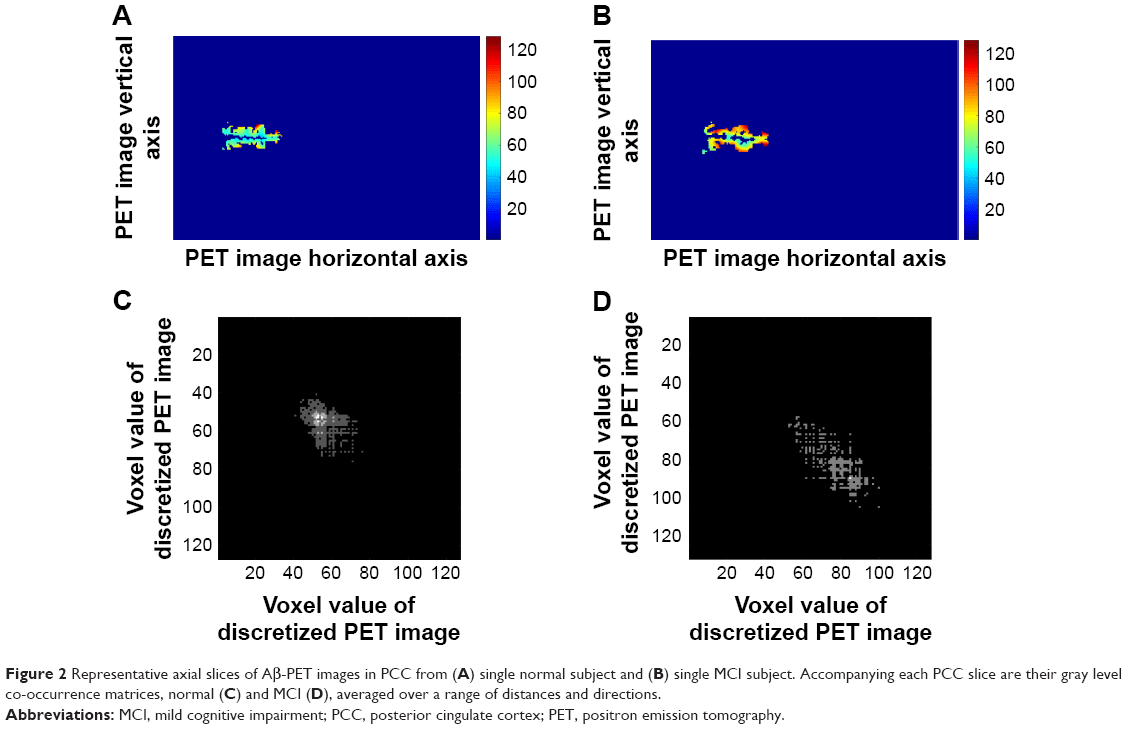 | Figure 2 Representative axial slices of Aβ-PET images in PCC from (A) single normal subject and (B) single MCI subject. Accompanying each PCC slice are their gray level co-occurrence matrices, normal (C) and MCI (D), averaged over a range of distances and directions. |
Results from the Student’s t- and Wilcoxon tests are displayed in Tables 2–4 with boxplots comparing the HFs and SUVRs for the precuneus and PCC shown in Figure 3. Overall, the HFs were capable of distinguishing groups at baseline and follow-up (at FDR =0.05 level) in particular regions. In total, 124 out of 252 Wilcoxon tests showed significant differences between stratified groups. The majority of these differences were exhibited in the subjects grouped by diagnosis at both baseline and 24-month follow-up. Specifically, Energy and Entropy were capable of distinguishing normal and MCI subjects in all brain regions at baseline and nearly all structures at follow-up (except for Energy in the LFL). For the APOE and ADAS-Cog stratified groups, fewer HFs were capable of distinguishing groups in specific brain regions. However, we found significant differences in these groups using Energy and Entropy in the PCC at baseline for ADAS-Cog in Table 4 and follow-up for APOE in Table 3. Conversely, we observed no significant differences between all groups and ROIs at baseline or follow-up utilizing SUVR (0 of 42 performed tests).
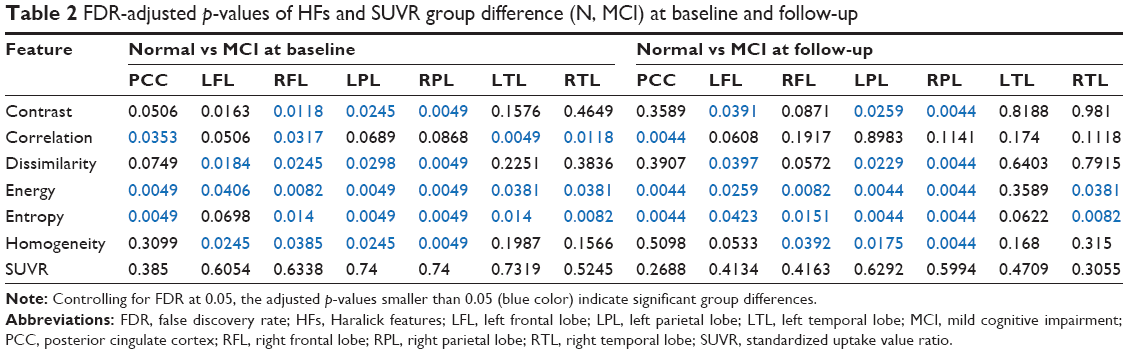 | Table 2 FDR-adjusted p-values of HFs and SUVR group difference (N, MCI) at baseline and follow-up |
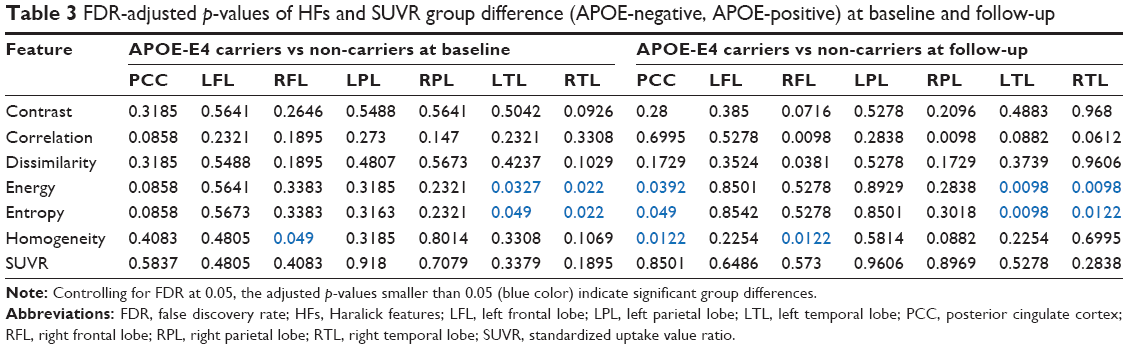 | Table 3 FDR-adjusted p-values of HFs and SUVR group difference (APOE-negative, APOE-positive) at baseline and follow-up |
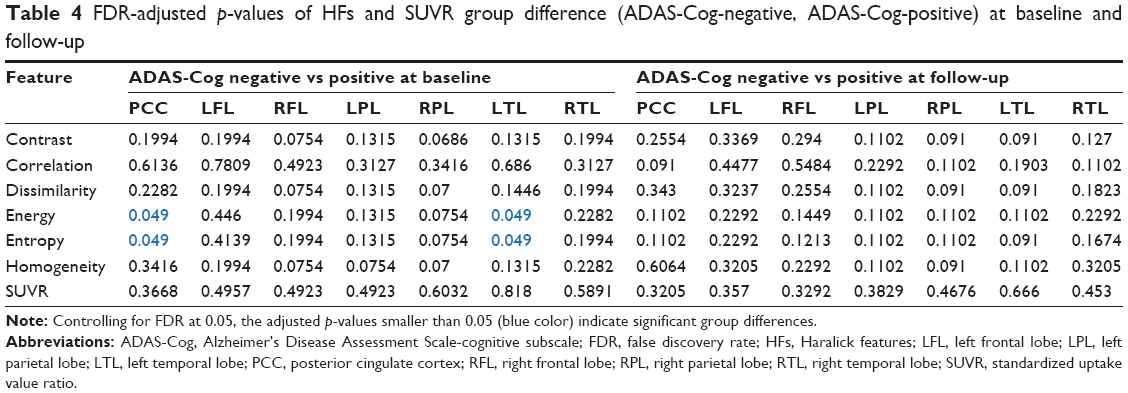 | Table 4 FDR-adjusted p-values of HFs and SUVR group difference (ADAS-Cog-negative, ADAS-Cog-positive) at baseline and follow-up |
 | Figure 3 Boxplots of measured metrics for the combined precuneus and posterior cingulate cortex. |
ROC curves for the PCC and all AUC values are displayed in Figure 4. The ROC AUCs are presented in Table 5, respectively. From Figure 4A and C, we observed that the Energy and Entropy offered the best performance to distinguish Normal versus MCI and ADAS-Cog negative versus ADAS-Cog positive groups. Conversely, SUVR and Entropy provided the best methods APOE-ε4 carriers versus non-carriers, as viewed in Figure 4B, while Energy exhibited lower performance. From Table 5, we observed that several metrics were best for differentiating stratified groups. For the classifications based on clinical diagnosis and ADAS-Cog, Energy gave the best performance across all ROIs. For the APOE-ε4 classification, Entropy performed the best, followed by SUVR and Dissimilarity as secondary metrics. Homogeneity ranked as the second best metric for the ADAS-Cog classification. Several other HFs exhibited AUC values close to 0.5, considerably not better than random guessing.
 | Figure 4 Representative ROC curves characterizing the diagnostic capability of HFs and SUVR measurements within the combined precuneus and posterior cingulate cortex. |
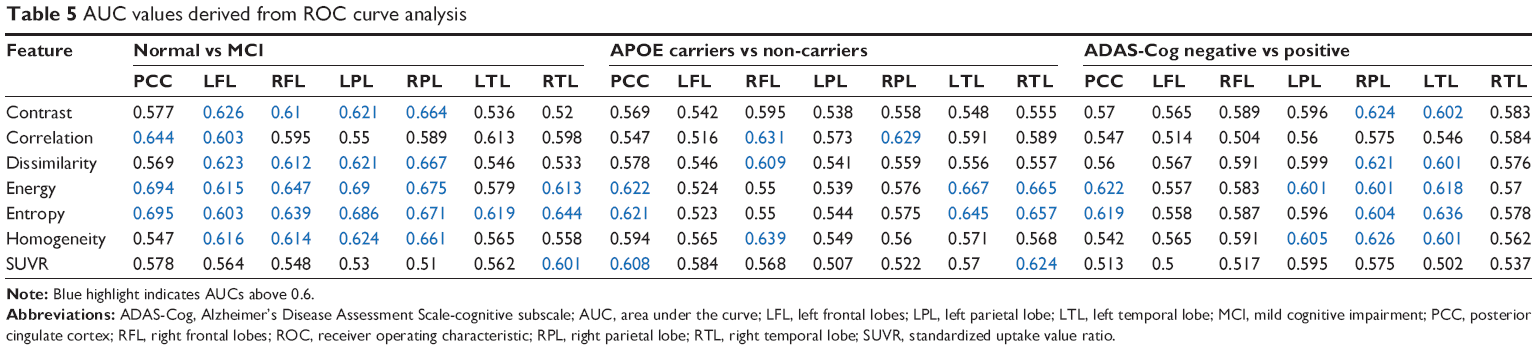 | Table 5 AUC values derived from ROC curve analysis |
Discussion
The objective of this study was to determine whether higher-order texture-based features derived from the GLCMs of [18F]-Florbetapir-PET images can identify statistically significant differences between subject groups without using a reference region for PET intensity normalization. Subjects were classified with respect to their clinical diagnosis, APOE-ε4 status, and ADAS-Cog score to make a comparison between Haralick texture features and the conventional SUVR approach.
The results of the statistical and diagnostic testing revealed that the HFs Energy and Entropy provide the best descriptor for distinguishing normal and MCI subjects across all brain structures of interest. There was statistically significant separation in Energy and Entropy between the normal and MCI subject populations in the majority of ROIs at baseline and 24-month follow-up. Energy and Entropy also offered the largest AUC values for accurately classifying subjects with respect to their clinical diagnosis (Normal versus MCI) or ADAS-Cog status (negative versus positive).
An interesting consequence observed from the results is the apparent disconnect between the statistical testing and ROC diagnostic performance. Results from the Student’s t-tests determined that no significant differences were exhibited in SUVR for each stratified group in all ROIs. However, ROC curve analysis verified SUVR’s capability to distinguish populations, specifically in the RTL. This diagnostic capability also extended to all brain regions for the APOE stratified group, with AUC values >0.5, including the PCC, as seen in Figure 4B. Recall that AUC can be interpreted as diagnosis accuracy as a percentage, where 0.5 represents 50% accuracy. Even though SUVR appears to be a sensitive metric for differentiating APOE populations, other texture features perform better with respect to the two other classification schemes.
HFs are abstract mathematical models that are used in many different applications. The innovative aspect of this study was to utilize these features for characterizing abnormal Aβ pathology from non-normalized florbetapir-PET images. From early post-mortem studies,22 we know that over time the progressive Aβ accumulation encompasses a greater extent of cerebral cortical laminae. The same pattern of spatial spread is observed in Aβ-PET images.23 These spatial changes can affect the local disorder, homogeneity, variation, and similarity of pixel intensities, which can be captured by HFs.
One of the limitations of this study is the small sample size, which limits the interpretation regarding diagnostic capabilities. However, the overall objective was to compare a new image analysis method with a standard technique. The outcomes of our study indicate that, for the same sample size, our new method shows more significant group differences than the SUVR values.
Conclusion
In this pilot study, a novel texture-based approach to assessing diagnostic statuses of amyloid burden was evaluated. We demonstrated that HFs, specifically Energy, could be used to effectively classify patients with respect to their clinical diagnosis, APOE-ε4 status, and ADAS-Cog score, compared to SUVR. These results suggest that this technique has potentials to improve subject stratification in AD drug trials and help evaluate the disease progression and treatment effects longitudinally without the potential biases associated with the reference region normalization.
Acknowledgments
This study was supported by NIH grants R00 EB 009106, to SS. The authors would like to thank Todd Peterson and Noor Tantawy at Vanderbilt University Institute of Imaging Science for supportive discussions. Data collection and sharing for this project was funded by the Alzheimer’s Disease Neuroimaging Initiative (ADNI) (National Institutes of Health Grant U01 AG024904) and DOD ADNI (Department of Defense award number W81XWH-12-2-0012). ADNI is funded by the National Institute on Aging, the National Institute of Biomedical Imaging and Bioengineering, and through generous contributions from the following: AbbVie, Alzheimer’s Association; Alzheimer’s Drug Discovery Foundation; Araclon Biotech; BioClinica, Inc.; Biogen; Bristol-Myers Squibb Company; CereSpir, Inc.; Cogstate; Eisai Inc.; Elan Pharmaceuticals, Inc.; Eli Lilly and Company; EuroImmun; F Hoffmann-La Roche Ltd and its affiliated company Genentech, Inc.; Fujirebio; GE Healthcare; IXICO Ltd.; Janssen Alzheimer Immunotherapy Research & Development, LLC.; Johnson & Johnson Pharmaceutical Research & Development LLC.; Lumosity; Lundbeck; Merck & Co., Inc.; Meso Scale Diagnostics, LLC.; NeuroRx Research; Neurotrack Technologies; Novartis Pharmaceuticals Corporation; Pfizer Inc.; Piramal Imaging; Servier; Takeda Pharmaceutical Company; and Transition Therapeutics. The Canadian Institutes of Health Research is providing funds to support ADNI clinical sites in Canada. Private sector contributions are facilitated by the Foundation for the National Institutes of Health (www.fnih.org). The grantee organization is the Northern California Institute for Research and Education, and the study is coordinated by the Alzheimer’s Therapeutic Research Institute at the University of Southern California. ADNI data are disseminated by the Laboratory for Neuro Imaging at the University of Southern California.
Data used in preparation of this article were obtained from the Alzheimer’s Disease Neuroimaging Initiative (ADNI) database (adni.loni.usc.edu). As such, the investigators within the ADNI contributed to the design and implementation of ADNI and/or provided data but did not participate in analysis or writing of this report. A complete listing of ADNI investigators can be found at: http://adni.loni.usc.edu/wp-content/uploads/how_to_apply/ADNI_Acknowledgement_List.pdf.
Disclosure
The authors report no conflicts of interest in this work.
References
Camus V, Payoux P, Barré L, et al. Using PET with 18F-AV-45 (florbetapir) to quantify brain amyloid load in a clinical environment. Eur J Nucl Med Mol Imaging. 2012;39(4):621–631. | ||
Huang KL, Lin KJ, Hsiao T, et al. Regional amyloid deposition in amnestic mild cognitive impairment and Alzheimer’s disease evaluated by [18 F] AV-45 positron emission tomography in Chinese population. PLoS One. 2013;8(3):e58974. | ||
Lopresti BJ, Klunk WE, Mathis CA, et al. Simplified quantification of Pittsburgh compound B amyloid imaging PET studies: a comparative analysis. J Nucl Med. 2005;46(12):1959–1972. | ||
Ikonomovic MD, Klunk WE, Abrahamson EE, et al. Post-mortem correlates of in vivo PiB-PET amyloid imaging in a typical case of Alzheimer’s disease. Brain. 2008;131(6):1630–1645. | ||
Landau SM, Fero A, Baker SL, et al. Measurement of longitudinal β-amyloid change with 18F-florbetapir PET and standardized uptake value ratios. J Nucl Med. 2015;56(4):567–574. | ||
Brendel M, Högenauer M, Delker A, et al; Alzheimer’s Disease Neuroimaging Initiative. Improved longitudinal [(18)F]-AV45 amyloid PET by white matter reference and VOI-based partial volume effect correction. Neuroimage. 2015;108:450–459. | ||
Chen K, Roontiva A, Thiyyagura P, et al. Improved power for characterizing longitudinal amyloid-β PET changes and evaluating amyloid-modifying treatments with a cerebral white matter reference region. J Nucl Med. 2015;56(4):560–566. | ||
Shokouhi S, Mckay JW, Baker SL, et al. Reference tissue normalization in longitudinal 18 F-florbetapir positron emission tomography of late mild cognitive impairment. Alzheimer’s Res Ther. 2016;8(1):2. | ||
Matías-Guiu JA, Cabrera-Martín MN, Matías-Guiu J, et al. Amyloid PET imaging in multiple sclerosis: an 18 F-florbetaben study. BMC Neurol. 2015;15(1):243. | ||
Englund E. Neuropathology of white matter changes in Alzheimer’s disease and vascular dementia. Dement Geriatr Cogn Disord. 1998;9(Suppl 1):6–12. | ||
Head D, Buckner RL, Shimony JS, et al. Differential vulnerability of anterior white matter in nondemented aging with minimal acceleration in dementia of the Alzheimer type: evidence from diffusion tensor imaging. Cerebral Cortex. 2004;14(4):410–423. | ||
Charlton RA, Barrick TR, McIntyre DJ, et al. White matter damage on diffusion tensor imaging correlates with age-related cognitive decline. Neurology. 2006;66(2):217–222. | ||
Zhang Y, Schuff N, Du AT, et al. White matter damage in frontotemporal dementia and Alzheimer’s disease measured by diffusion MRI. Brain. 2009;132(9):2579–2592. | ||
Haralick RM, Shanmugam K. Textural features for image classification. IEEE Trans Syst Man Cybern. 1973;3(6):610–621. | ||
Rosen WG, Mohs RC, Davis KL. A new rating scale for Alzheimer’s disease. Am J Psychiatry. 1984;141(11):1356–1364. | ||
Wong DF, Rosenberg PB, Zhou Y, et al. In vivo imaging of amyloid deposition in Alzheimer disease using the radioligand 18F-AV-45 (florbetapir [corrected] F 18). J Nucl Med. 2010;51(6):913–920. | ||
Vanderbilt School of Engineering. Available from: http://masiweb.vuse.vanderbilt.edu/workshop2012/index.php/Main_Page. Accessed June 6, 2017. | ||
Open Access Series of Imaging Studies. Available from: http://www.oasis-brains.org/. Accessed June 6, 2017. | ||
Neuromorphometrics, Inc. Building a Model of the Living Human Brain. Available from: http://neuromorphometrics.com/. Accessed June 6, 2017. | ||
Freeborough PA, Fox NC. MR image texture analysis applied to the diagnosis and tracking of Alzheimer’s disease. IEEE Trans Med Imaging. 1998;17(3):475–478. | ||
Klyuzhin IS, Blinder S, Mabrouk R, Rahmim A, Sossi V. Investigation of texture quantification parameters for neurological PET image analysis. In: Nuclear Science Symposium and Medical Imaging Conference (NSS/MIC), 2015 IEEE; 2015:1–5. | ||
Bruce CV, Clinton J, Gentleman SM, Roberts GW, Royston MC. Quantifying the pattern of beta/A4 amyloid protein distribution in Alzheimer’s disease by image analysis. Neuropathol Appl Neurobiol. 1992;18(2):125–136. | ||
Li Y, Tsui W, Rusinek H, et al. Cortical lamina binding of PET amyloid and Tau Tracers in Alzheimer’s disease. J Nucl Med. 2015;56(2):270–273. |
 © 2017 The Author(s). This work is published and licensed by Dove Medical Press Limited. The
full terms of this license are available at https://www.dovepress.com/terms
and incorporate the Creative Commons Attribution
- Non Commercial (unported, 3.0) License.
By accessing the work you hereby accept the Terms. Non-commercial uses of the work are permitted
without any further permission from Dove Medical Press Limited, provided the work is properly
attributed. For permission for commercial use of this work, please see paragraphs 4.2 and 5 of our Terms.
© 2017 The Author(s). This work is published and licensed by Dove Medical Press Limited. The
full terms of this license are available at https://www.dovepress.com/terms
and incorporate the Creative Commons Attribution
- Non Commercial (unported, 3.0) License.
By accessing the work you hereby accept the Terms. Non-commercial uses of the work are permitted
without any further permission from Dove Medical Press Limited, provided the work is properly
attributed. For permission for commercial use of this work, please see paragraphs 4.2 and 5 of our Terms.