Back to Journals » Risk Management and Healthcare Policy » Volume 13
Application of GIS Spatial Analysis and Scanning Statistics in the Gynecological Cancer Clustering Pattern and Risk Screening: A Case Study in Northern Jiangxi Province, China
Received 6 May 2020
Accepted for publication 28 July 2020
Published 10 August 2020 Volume 2020:13 Pages 1079—1093
DOI https://doi.org/10.2147/RMHP.S261221
Checked for plagiarism Yes
Review by Single anonymous peer review
Peer reviewer comments 6
Editor who approved publication: Professor Marco Carotenuto
Zhiwei Wan,1,* Yaqi Wang,2,* Chunhong Deng2
1School of Geography and Environment, Jiangxi Normal University, Nanchang 330022, People’s Republic of China; 2Jiangxi Provincial Cancer Center, Jiangxi Provincial Cancer Hospital, Nanchang 330029, People’s Republic of China
*These authors contributed equally to this work
Correspondence: Zhiwei Wan
School of Geography and Environment, Jiangxi Normal University, Nanchang 330022, People’s Republic of China
Email [email protected]
Yaqi Wang
Jiangxi Provincial Cancer Center, Jiangxi Provincial Cancer Hospital, Nanchang 330029, People’s Republic of China
Email [email protected]
Objective: The incidence of gynecological cancer is high in China, and the effects of related treatments and preventive measures need to be improved.
Methods: This study uses GIS spatial analysis methods and a scanning statistical analysis to study the major gynecological cancers in northern Jiangxi Province from 2016 to 2018.
Results: The incidence and spatial pattern of cervical cancer, ovarian cancer, and uterine cancer had agglomeration characteristics and changes during the study period. The gynecological cancer had a spatial autocorrelation and agglomeration in its spatial pattern. The Moran’s Index of the overall gynecological cancer incidence rate was 0.289 (p = 0.005). Ripley’s L(d) function showed that the agglomeration radius was between 51.40 and 52.82 km. The results of the kernel density estimation showed that the cases of gynecological cancer were concentrated in the central and northeastern areas of the study area. The overall county-level incidence of gynecological cancer varied from 0.26 to 11.14 per 100,000. The results of the gravity center analysis showed that the spatial distribution of the gravity center point of gynecological cancer had moved toward the east during the past three years. The results of a hotspot analysis showed that there were five hotspot areas that had gynecological cancers. The most likely clusters of gynecological cancer at the county level in northern Jiangxi Province were distributed in the adjacent areas of Jiujiang, Yichun, and Nanchang, with a relative risk of 1.85.
Conclusion: The research shows that GIS can display the distribution of cancer cases and can use spatial analysis methods and scanning statistical techniques to obtain key areas of cancer incidence. These results can provide data and key areas for the formulation of regional public health policies and provide recommendations for cancer screening and the rational allocation of health resources.
Keywords: gynecological cancer, cervical cancer, ovarian cancer, uterine cancer, spatial pattern, spatiotemporal heterogeneity, risk scanning, GIS spatial analysis
Introduction
According to the latest report from the International Agency for Research on Cancer (IARC), 18.1 million new cancer cases were added globally in 2018, of which 9.6 million were deaths, and the global cancer burden is further increasing.1 Gynecological cancers are one of the primary types of cancers that affect women’s health and quality of life.2 Gynecological cancers account for approximately one-sixth of the number of cancers in females, of which cervical cancer, ovarian cancer, and uterine cancer are the most common types of gynecological cancers.3–5 About 80% of global gynecological cancers occur in developing countries, accounting for about 15% of female cancers. The areas with higher incidence rates are distributed in Africa, Central Asia, South Asia and Southeast Asia.6,7 In 2018, there were approximately 570,000 new cases of cervical cancer worldwide and more than 311,000 deaths.8 Statistics in the United States show that,6 there were 110,070 newly diagnosed gynecological cancer patients in 2018, of which 32,120 died. There are approximately 130,000 new cases of cervical cancer each year in China, accounting for one-third of new cases worldwide.7
Relevant research9,10 has shown that gynecological cancers are characterized by many types, a wide age distribution, and complicated disease factors. Gynecological cancers have characteristics of high morbidity, high mortality, and recurrence.11,12 Moreover, rational use of some technical methods to study the spatial distribution of gynecological cancer and identify areas with high incidence of gynecological cancer can help improve the efficiency of early screening. In particular, the late treatment of gynecological cancer is not effective. Therefore, early detection, early treatment, and advance prevention have become trends in cancer prevention.13–15 In recent years, with the promotion of the cervical cancer vaccine, prevention strategies for related gynecological cancers have significantly improved.16,17 However, many gynecological cancer vaccines still require further research and development. The improvement of preventive gynecological cancer strategies has become a major research direction in recent years.18–22
Due to the development of geospatial information technologies in recent years, GIS and related technologies have been fully applied to discover the early spatial distribution of diseases and early screening studies in potential disease areas.23,24 GIS and spatial exploration technologies have played an important role in fields such as influenza,25 hand, foot and mouth disease,26,27 AIDS,28 schistosomiasis,29 cancers,30–38 and other diseases, helping to detect the spatial distribution patterns and potential pathogenic factors.39 In particular, spatial and temporal heterogeneity analysis techniques, such as spatial autocorrelation,40 cold and hot spot detection,41 and spatial scanning statistics,42 have played increasingly important roles in the detection of the spatial distribution pattern of diseases, detecting areas of high and low incidence of disease, and the quantitative calculation of the relative risks of diseases.43
The spatial distribution patterns and evolution laws of cancer cases can help administrative departments to make reasonable health policies. In addition, this information can provide a decision-making basis for cancer prevention, screening, and the rational allocation of public health resources.44 Related studies45,46 have shown that the onset factors of cancers are complicated. In addition to genetic and variability factors, the geographical environment is also an important factor that can affect the incidence of cancers.47,48 A spatial analysis of cancer cases can provide theoretical hypotheses and research directions for the role of related environmental factors in the pathogenesis of cancers. It can also provide data support for a rational formulation of cancer diagnosis and treatment.49,50 Related studies51,52 have also found that gynecological cancers can have significant clustering characteristics in their spatial distributions, and they can also have characteristics of complex influencing factors. Therefore, the application of geographic information technology in the spatial analysis of gynecological cancers can improve prevention and promote the formulation of regional gynecological screening policies.53
Spatial analysis and scanning statistics have rarely been used in the study of gynecological cancers in China, and this study selected the northern Jiangxi Province area in the Yangtze River Valley as the research area. The objective of this study is to explore regional gynecological cancer screening and identification methods for high-risk areas through GIS spatial analysis methods. It is generally believed that the spatial distribution of gynecological cancer may be affected by lifestyle and socio-economic development.54 Therefore, this study hopes to use case studies to try to discover the socioeconomic factors that affect the spatial distribution of gynecological cancer. This research also provides decision support for regional cancer screening and prevention policy formulations, and it provides a reference for the formation and detection of geographic cancer risk factors.
Materials and Methods
Study Area
This study used northern Jiangxi Province in China as the research area (Figure 1). The regional geographical range is between 113°34′36″–118°28′58″E and 25°51′04″–30°04′41″N. The area of the study area is approximately 127,000 square kilometers, and the population is approximately 36.83 million. Hills, mountains, and basins dominate the overall terrain of the study area, and valleys are widely distributed in the central and southern regions. The north consists of the Poyang Lake Plain. The primary tributary of the Yangtze River, the Gan River, runs through the entire study area from the south to the north and is the primary water source river in the region.55 The study area is divided into 10 prefecture-level cities and 73 county-level administrative areas, with an urbanization level of approximately 57%.56 Northern Jiangxi Province is an important part of the urban agglomeration in the middle reaches of the Yangtze River in China. At the same time, the region is located in the central economic belt of China, and its economic and social development is at the national average level, which is well represented. On the other hand, because most of the economic and social activities in southern Jiangxi Province are organized by the regional central city Ganzhou. Considering that the Jiangxi Provincial Cancer Center is located in northern Jiangxi Province, and its data mainly represents the northern region, this study selects North Jiangxi Province as the study area. According to data from the sixth census in 2010, the population of North Jiangxi Province is 36.19 million.57
 |
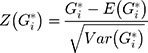
Figure 1 Location map and administrative division of the study area. |
Spatialization of Case Data
The gynecological cancer case data from the Jiangxi Provincial Cancer Center from 2016 to 2018 were collected. Classification and coding according to the International Classification of Diseases Tenth Edition (ICD-10) standards, including C53.9, C56 and C55. It should be noted that this study only included cervical cancer, ovarian cancer and uterine cancer, not breast cancer. Since gynecological tumors generally refer to female reproductive system cancers, the diagnosis and treatment of breast cancer are relatively independent. Therefore, considering the convenience of data acquisition, breast cancer is not included in this study.
Microsoft Access 2010 database software and ArcGIS 10.2 geographic information system software for database construction and spatial information management were used in this study. To identify the spatial attribute information of the case data, the Baidu map address space matching interface (http://api.map.baidu.com/) was used to obtain the latitude and longitude coordinates of the residential addresses of each specific medical record to achieve the precise spatialization of cancer patients. Two hundred and seventeen cases of missing addresses or diagnostic information were not counted, which account for 4.21% of the total. The data of gynecological cancers totaled 4938 cases, including 2161 cases of cervical cancer, 1992 cases of ovarian cancer, and 785 cases of uterine cancer. The population data were obtained from the county-level data of the sixth census in the Jiangxi Statistical Yearbook (http://tjj.jiangxi.gov.cn/). In this study, the cancer incidence data has not been age-adjusted, and directly uses the ratio of the number of cancers to the total population of the region as the cancer incidence. It should be noted that the cancer data used in this study did not come from census or registration data. The incidence rate in this study only represents the ratio of the regional cancer case data to the population.
The GIS data for administrative divisions originated from the Geospatial Data Cloud of the Chinese Academy of Sciences (http://www.gscloud.cn/). The geographic information data adopted the WGS_1984 coordinate system, and the projection method was the WGS_1984_Plate_Carree system.
Research Methods
Point Pattern Analysis
A standard deviational ellipse is often used to analyze the spatial distribution direction, centrality, and overall characteristics of points.58,59 The long axis of the ellipse represents the maximum diffusion direction of the overall spatial distribution, the short axis represents the minimum diffusion direction, and the center of the ellipse represents the centrality of the overall distribution of each sample point. The rotation angle (θ) is expressed by the angle between the long axis of the ellipse and the north direction, indicating the spatial distribution of the sample points. The size of the standard deviation ellipse area can indicate the degree of dispersion of the sample point distribution. The smaller the area, the more concentrated the distribution is near the center. The ellipse equation and the center of gravity coordinates were calculated using ArcGIS 10.2 software (Environmental Systems Research Institute, Inc. Redlands, CA).
Spatial Autocorrelation and Ripley’s K Function
The overall spatial differentiation can be identified using Moran’s Index. This method was first proposed by Moran in 1950 and is now widely used to detect the spatial heterogeneity of diseases.60,61 It is generally believed that the index value is in the range of [−1, +1]. The closer to −1 indicates that the spatial distribution of the disease has a high negative correlation; and vice versa. The relevant equation is:
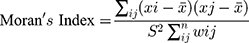
where xi denotes the sample value of the disease in the region;  denotes the mean; wij denotes the spatial weight matrix; and S2 denotes the mean square error. The calculation of the spatial weight matrix is carried out by Geoda software, which is defined as 1 if two regions are adjacent to each other, otherwise it is recorded as 0.
Ripley’s L(d) function is an analysis method based on the pattern of event points that can detect structural information, such as the aggregation state, peak position, and spatial scale of disease cases at different spatial distances. Ripley’s K function62,63 can measure the change in point pattern with distance. Therefore, this method can analyze the dot pattern characteristics at any scale. Ripley’s K(d) represents the ratio of the number of points in the radius of the observation range to the point density in the area. The calculation method is:
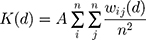
where A denotes the total area of the study area; n is the number of residential points; and  is the number of points within a distance d. To maintain the stability of variance, the general treatment is to perform a square root transformation, which is:
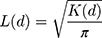
When L(d)-d>0, this indicates that the spatial point pattern is in an aggregated state. When L(d)-d<0, this indicates that the spatial point pattern is in a discrete state. The value of the L(d) is the strength of the aggregation. The larger the value, the higher the degree of aggregation. If L(d) exceeds the confidence interval generated by the Monte Carlo simulation, this means that the degree of aggregation or dispersion is significant.64
Kernel Density Estimation
Kernel density estimation is a non-parametric test method,65 which can be used to analyze the density of spatial point distribution. The basic principle is to estimate the theoretical distribution of the sample points in the area through the kernel density function, and convert the discrete sample point density into a spatially distributed density value. Kernel density analysis can identify the concentrated area of the distribution of spatial point elements, that is, the area with a large number of patients.66 Through the conversion of kernel density estimation, it is possible to smooth the area with fewer cancer patients, and obtain the overall spatial distribution of the number of patients. The calculation method is:
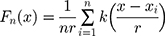
where k(·) is the kernel function, r is the analysis radius, and  is the distance between the point x to be estimated and the sample point xi.
Getis-Ord Cold and Hotspot Analysis
Getis-Ord cold and hotspot analysis can refine the identification of local high-risk and low-risk areas on the basis of global spatial autocorrelation.41,60 The calculation method is:
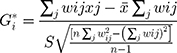
where n is the total number of samples,  is the mean, wij is the spatial weight matrix, and S is the standard deviation. Generally,
  will be standardized:
where  is the expected value and
  is the variance. The normalized value of
  can be used to identify cold and hotspots in the research area.
SaTScan Risk Scan
SaTScan spatiotemporal scanning can provide a quantitative risk value of disease incidence, which has advantages in identifying and detecting risk areas. SaTScan spatial risk scan statistics can adaptively perform multiple scans and risk value calculations in the study area based on the incidence rate and inter-regional population base.67 Because it does not need to define the size and position of the scanning window in advance, it has been widely used in the detection of regional disease risk.68,69 SaTScan spatial risk scan statistics use log likelihood ratio (LLR) to judge high-value risk areas. The calculation method is:
where LLR is the log likelihood ratio, N and n are the total population in the area and the window, respectively, and C and c represent the number of cases or events in the area and the window.
Results
Regional Cancer Incidence
By using the spatial statistics of 73 county-level units in northern Jiangxi Province from 2016 to 2018, the three-year average incidence rates of cervical cancer, ovarian cancer, uterine cancer, and overall gynecological cancer were obtained (Figure 2). The results showed that the incidence of cervical cancer was 0.22 to 7.39/100,000; the incidence of ovarian cancer was 0.00 to 5.76/100,000; the incidence of uterine cancer was 0.0 to 2.08/100,000; and the overall incidence rate varied from 0.26 to 11.14/100,000. In addition, by using the Jenks natural break classification method, all of the county-level regional incidence rates were divided into five categories. Among them, red represents the high-risk areas of cancer incidence and green represents low-risk areas. Figure 2 shows that the high-risk areas of cervical cancer were primarily concentrated in the northwest and southeastern regions. The high-risk areas of ovarian cancer were primarily concentrated in the central and southern areas; and the high-risk areas of uterine cancer were primarily concentrated in the central, western, and southern areas. The overall high-risk areas for gynecological cancer were primarily concentrated in the western and central regions. Overall, the western mountainous areas and central urban areas of the North Jiangxi Province were found to be high-risk areas for gynecological malignancies, and the risk of morbidity in the northeast and southwest areas was found to be relatively low.
 |
Figure 2 Spatial distribution of gynecologic cancer incidence in northern Jiangxi Province from 2016 to 2018. (A) Cervical cancer. (B) Ovarian cancer. (C) Uterine cancer. (D) Total gynecological cancer. |
Characteristics of Spatial Point Pattern
The results of the standard deviation ellipse analysis of gynecological cancer in northern Jiangxi Province (Figure 3) showed that the spatial patterns of ovarian cancer and uterine cancer were relatively close, and the spatial distribution area of cervical cancer was the largest. In terms of the ellipse major axis direction, ovarian cancer and uterine cancer were toward the north and east directions at 57.28° and 55.58°, respectively; and the cervical direction was toward the northeast at 69.23°. The overall spatial center of gynecological cancer was distributed between Nanchang County and Fengcheng from 2016 to 2018. The overall trend was from west to east, indicating that gynecological cancer in northern Jiangxi Province had moved to the east during the past three years. The results of the standard deviation ellipse analysis showed that the distribution of ovarian cancer and uterine cancer was more consistent, while the distribution of cervical cancer and other gynecological cancers displayed a difference.
 |
Figure 3 Standard deviation ellipse of gynecological cancer in northern Jiangxi Province and the changing trend of the center of gravity. |
Spatial Autocorrelation Features
The calculation results of the global spatial autocorrelation (Table 1) show that the incidence of cervical cancer, ovarian cancer, uterine cancer, and the overall gynecological cancer Moran’s Index are greater than 0. This indicates that the spatial distribution of the incidences of various types of gynecological cancers in northern Jiangxi Province have spatial autocorrelation. However, the Moran’s Index for uterine cancer was only 0.003, and the p-value was 0.924, which fails the relevant confidence test, which still has insignificant spatial autocorrelation. The Moran’s Index of cervical cancer was 0.179, which had a strong spatial concentration, but the p-value was 0.066, which just satisfies the 90% confidence test. The incidences of ovarian cancer and overall gynecological cancer had a high spatial autocorrelation in the spatial distribution of the research region, and the Moran’s Index value was 0.257 (p-value = 0.011) and 0.289 (p-value = 0.005) respectively, which was significantly higher than the expected index value. This also showed that regions with high incidence rates were adjacent to regions with high incidence rates, and regions with low incidence rates were adjacent to regions with low incidence rates.
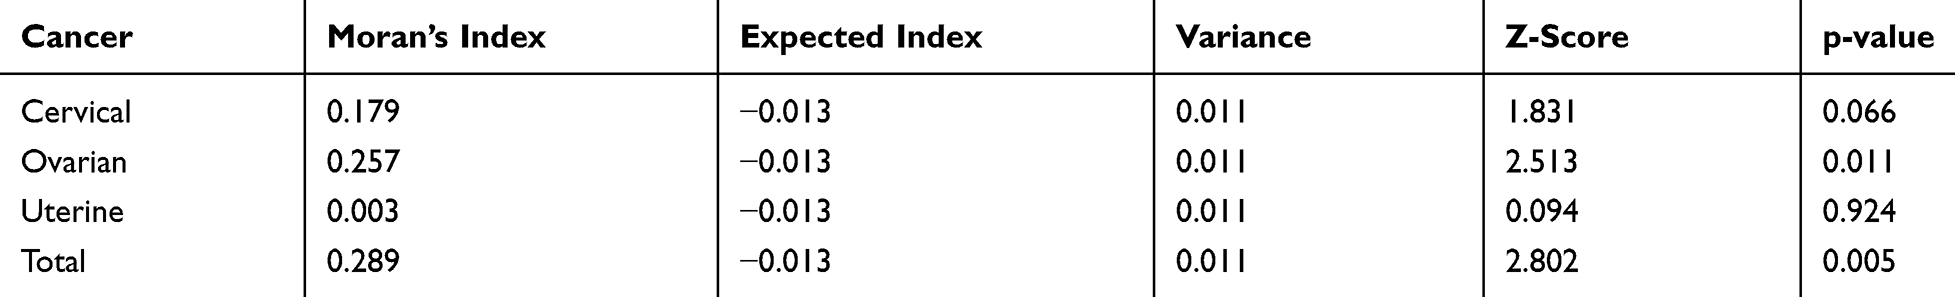 |
Table 1 Moran’s Index Value Distribution of Overall Gynecological Cancer Incidence in Northern Jiangxi Province |
By using the kernel density estimation tool of the ArcGIS platform, the spatial distribution pattern of the overall regional cancer cases was obtained. It can be concluded from Figure 4 that the majority of cervical cancer patients aggregated in Nanchang, and Xiushui and Jingdezhen were the secondary gathering centers within northern Jiangxi Province. The estimates of the kernel density of patients with ovarian cancer and uterine cancer further showed that the primary cluster centers were in the middle of Nanchang and northeast of Jingdezhen. The kernel density map of the overall spatial distribution of gynecological cancer patients in northern Jiangxi Province showed that Nanchang City, Yichun, and Jingdezhen in the middle were the main agglomeration belts, and Xiushui County in the northwest was the secondary aggregation center. By using the kernel density estimation of the resident address coordinate points of gynecological cancer patients in the study area, the concentrated area of the population of gynecological cancer in the region was obtained intuitively, providing a basis for future prevention and the allocation of public health resources.
 |
Figure 4 Estimation map of the spatial distribution of kernel density in patients with gynecological cancer in northern Jiangxi Province. |
Spatial Autocorrelation Scale
Using ArcGIS 10.2 and Crimestat 3.3 software, a Ripley’s L(d) function analysis of the incidence rate data of gynecological cancer in northern Jiangxi Province from 2016 to 2018 was performed. The results are shown in Figure 5. When the observed value is greater than the expected value and exceeds the range of the confidence interval, this indicates that the spatial distribution was clustered. The distance of the peak area of the L(d) function value represents the radius value of the concentration range. Based on these two criteria, the L(d) function values of the cervical cancer incidence rate, ovarian cancer incidence rate, uterine cancer incidence rate, and overall gynecological cancer incidence rate in northern Jiangxi Province significantly exceeded the confidence interval (Figure 5). The radius of the first agglomeration peak area is between 51.40 and 52.82 km, and the agglomeration intensity is between 17.44 and 29.07. The radius of the second agglomeration peak area is between 89.95 and 105.60 km, and the agglomeration intensity is between 19.75 and 32.79 (Table 2).
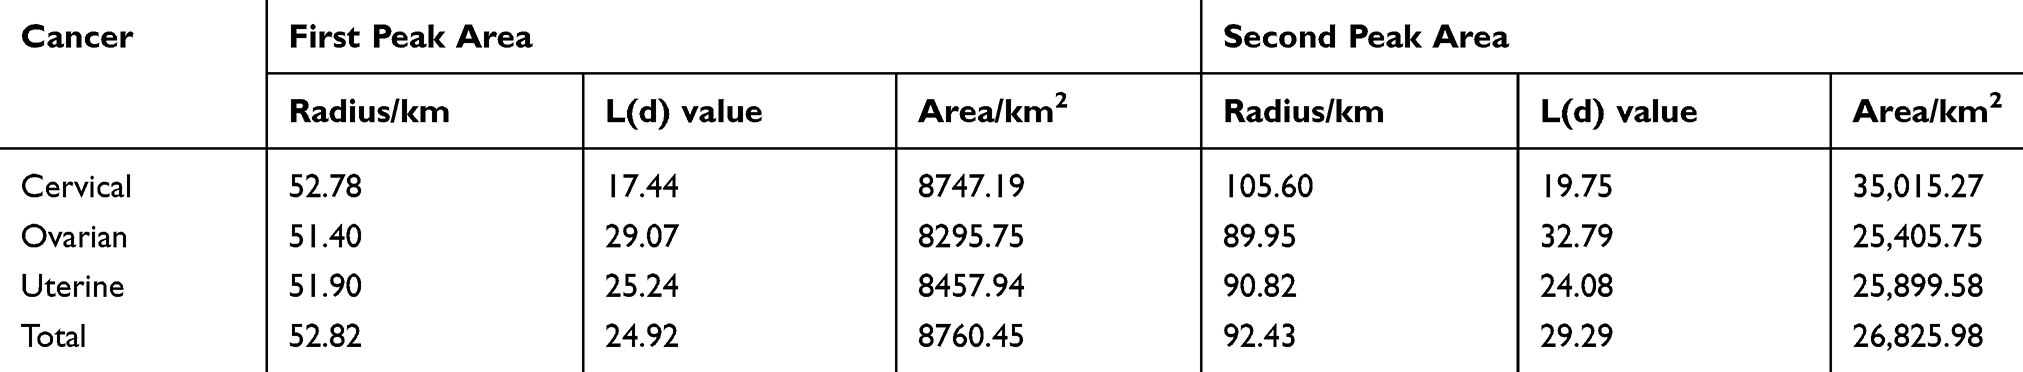 |
Table 2 Spatial Clustering Characteristics of L(d) Function for Gynecological Cancer in Northern Jiangxi Province |
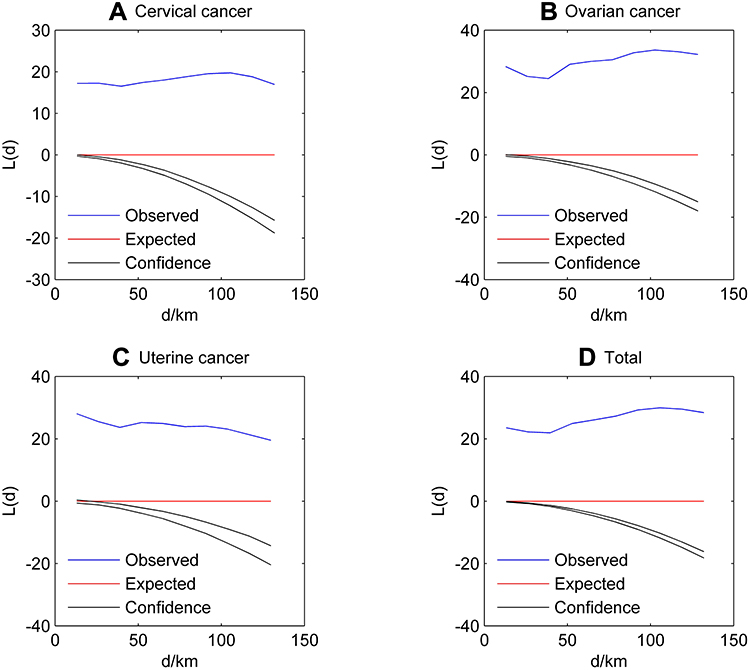 |
Figure 5 Ripley’s L(d) function graph of gynecological cancer incidence in northern Jiangxi Province. (A) Cervical cancer. (B) Ovarian cancer. (C) Uterine cancer. (D) Total gynecological cancer. |
Evolution of Agglomeration Pattern
The results of the Getis-Ord cold and hotspot analysis showed that (Figure 6) the number of cold and hotspots of the different types of gynecological cancers changed, but the overall results remained stable. There were 7 and 7 hot spots for cervical cancer at the county level, 5 and 8 for ovarian cancer, and 5 and 6 for uterine cancer according to the two analyses. There were 7 and 10 hot spots for total gynecological cancer at the county level. Cervical cancer had two hot areas at the county-level administrative regions that exceeded the 99% confidence, namely, Xiushui and Tonggu. One county-level administrative region of ovarian cancer had a hot spot with a 99% confidence level, which was Anyi County. Uterine cancer had a county-level administrative area with a hotspot of over 99% confidence, which was Chongren County. There were five hotspot areas with gynecological cancer with more than 95% confidence, namely, Fengxin (99% confidence) and Xiushui, Tonggu, Jingan, and Anyi (95% confidence).
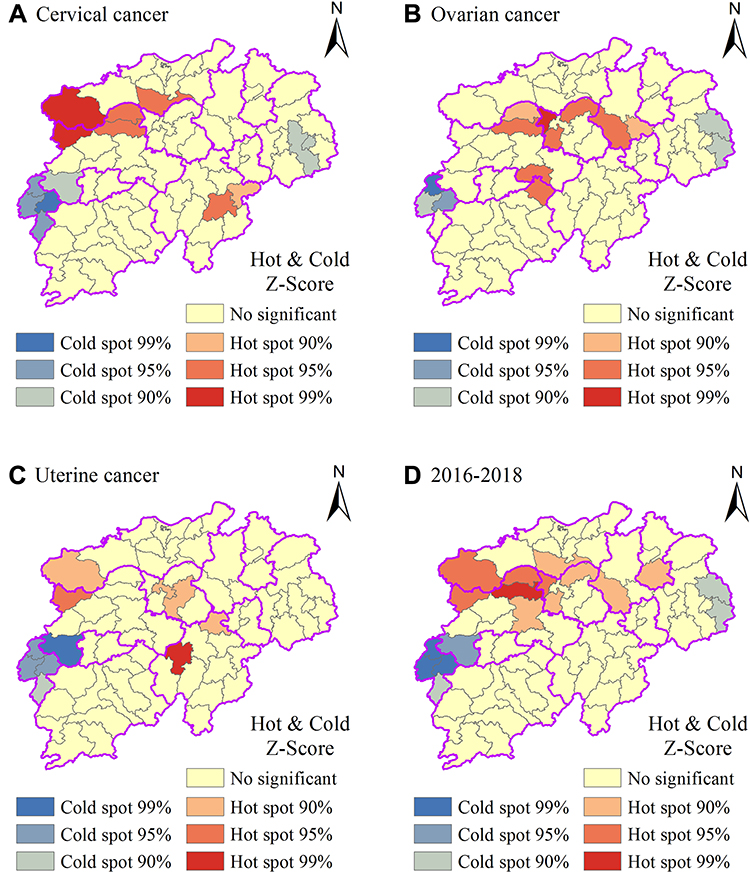 |
Figure 6 Spatial distribution of cold and hotspots in the incidence of gynecological cancer in northern Jiangxi Province. (A) Cervical cancer. (B) Ovarian cancer. (C) Uterine cancer. (D) 2016–2018 gynecological cancer. |
Results of Spatial Scanning
The scanning statistics showed that (Table 3, Figure 7) the most likely area of cervical cancer incidence in northern Jiangxi Province was primarily distributed in the northwest of the study area. This primarily included western Jiujiang City and northern Yichun City, the relative risk value was 2.63. The secondary possible agglomeration area was primarily distributed in the northeast of the study area, mainly including some counties in Shangrao and Jingdezhen, and its relative risk value was 1.64. The most likely cluster area of ovarian cancer incidence was primarily distributed in the combined areas of Jiujiang, Yichun, and Nanchang, with a relative risk value of 2.30. The secondary possible cluster area was distributed in the adjacent area of Yichun and Jian in the middle of the study area, and its relative risk value was 1.91. The areas with the highest possible concentration of uterine cancer were primarily distributed in the urban area of Nanchang City and Anyi County, with a relative risk value of 2.49. The secondary possible concentration area was distributed in Fuzhou and surrounding areas in the southeast of the study area, with a relative risk value of 1.76. The most likely clusters of gynecological cancer in northern Jiangxi Province were primarily distributed in the adjacent areas of Jiujiang, Yichun, and Nanchang, with a relative risk of 1.85. The secondary possible cluster area appeared in Jingdezhen and Shangrao City in the northeast of the study area, with a relative risk value of 1.53. The log likelihood ratio of the scan statistical results in this study ranged from 12.36 to 109.72, and all passed the p < 0.001 confidence test. This indicated that the identification of risk areas for gynecological cancer incidence in the study area had statistical significance.
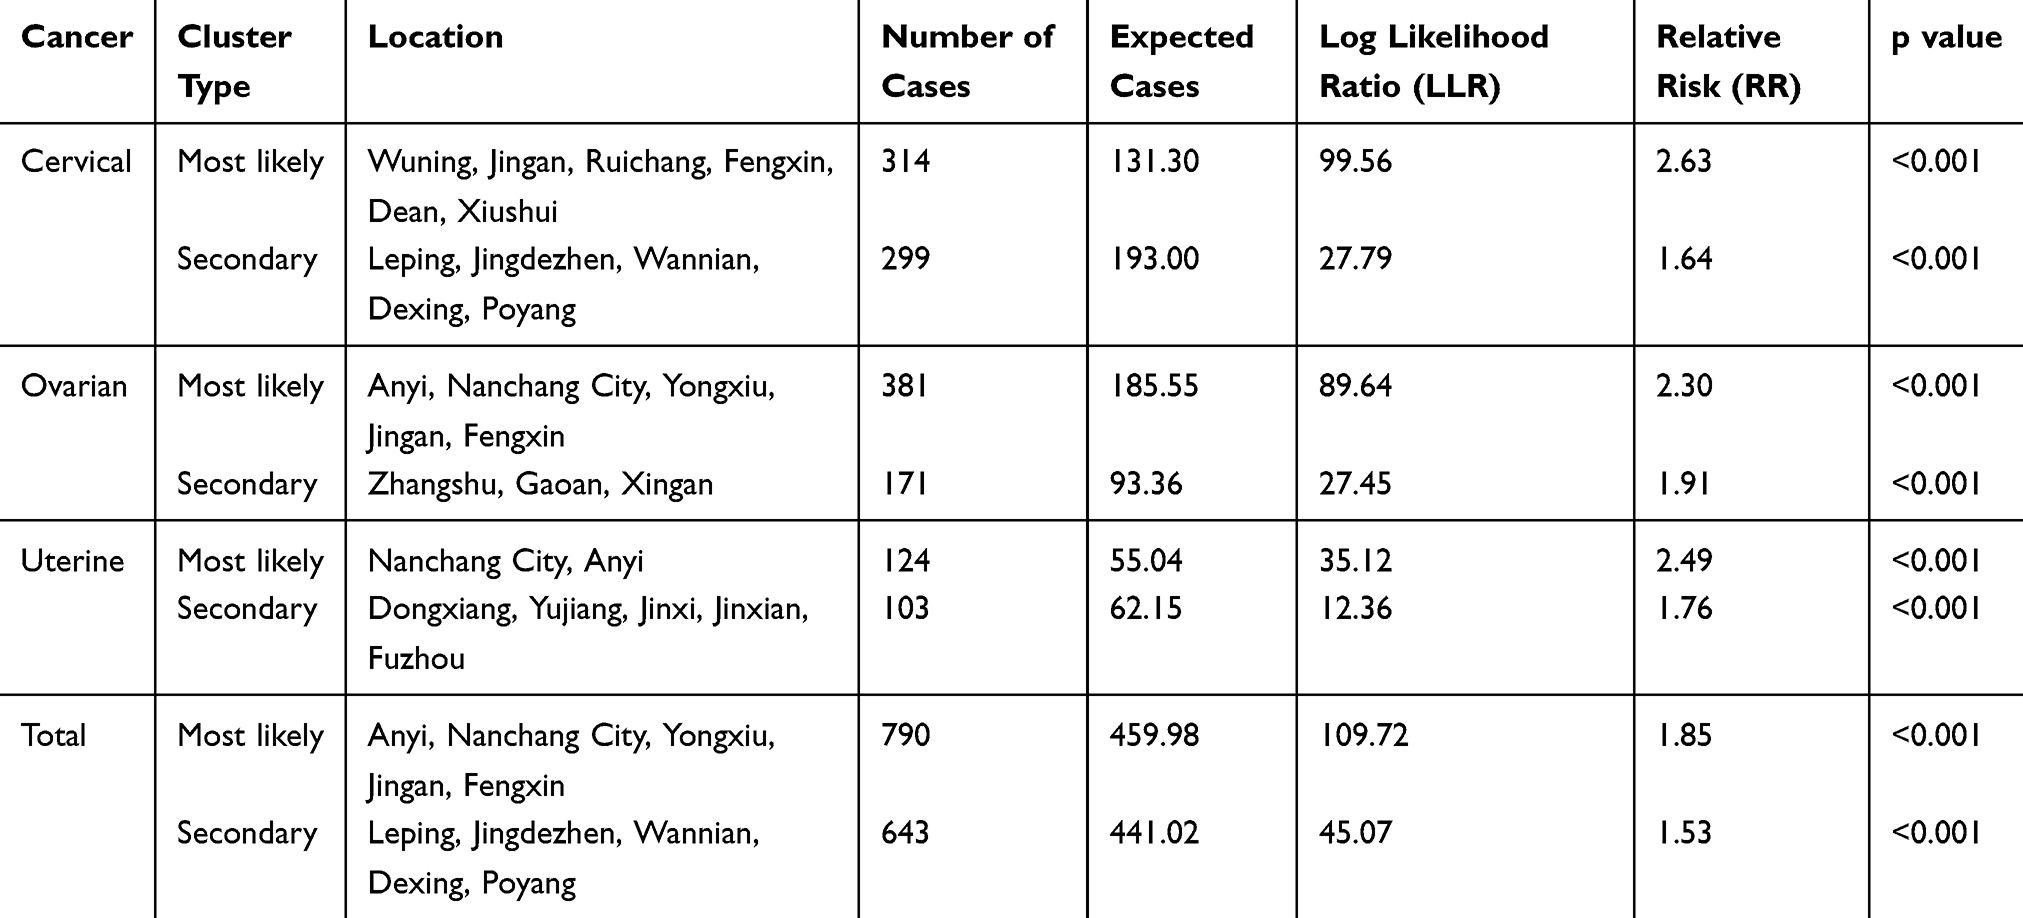 |
Table 3 Statistical Value of Spatial SaTScan Scan of Gynecological Cancer Incidence in Northern Jiangxi Province |
 |
Figure 7 Spatial clustering and relative risk distribution of gynecological cancer incidence spatial SaTScan in northern Jiangxi Province. (A) Cervical cancer. (B) Ovarian cancer. (C) Uterine cancer. (D) Total gynecological cancer. |
Discussions
The incidence of gynecological cancer is high in China, and the related treatment effects still need to be improved. This produces heavy family burdens and high public health expenditures. This study used GIS spatial analysis methods and a scan statistical analysis to study the major gynecological cancers in northern Jiangxi Province, China from 2016 to 2018. The main findings follow. The incidence rate of cervical cancer was 0.22–7.39/100,000; the incidence rate of ovarian cancer was 0.00–5.76/100,000; the incidence rate of uterine cancer was 0.00–2.08/100,000; and the overall incidence of gynecological cancer varied from 0.26 to 11.14/100,000. The most likely clusters of cervical cancer were primarily distributed in the northwestern part of the study area, and these included the western county of Jiujiang City and northern Yichun City, with a relative risk value of 2.63. The most likely concentration area of ovarian cancer was primarily distributed in the combined area of Jiujiang and Yichun in Nanchang, with a relative risk value of 2.30. The areas with the highest possible concentration of uterine cancer were primarily distributed in Nanchang City and Anyi County, with a relative risk value of 2.49. The most likely clusters of gynecological cancer in northern Jiangxi Province were primarily distributed in the adjacent areas of Jiujiang, Yichun, and Nanchang, with a relative risk of 1.85.
The cancer data used in this study just came from the Jiangxi Provincial Cancer Center. Due to the lack of census data or cancer registration data across the province, the results of the study are somewhat different from the actual spatial distribution of gynecological cancers in the study area. Considering that the Jiangxi Provincial Cancer Center is the largest cancer research and treatment institution in the study area, and is located in the central city of the study area, patients cover the entire study area. Therefore, it can be considered that the medical record data of this institution is representative and can be used to understand the spatial distribution pattern of cancer in the region.
When calculating the incidence rate in this study, the population data used came from the latest version of the 2010 Census. This will reduce the accuracy of the results to a certain extent. Considering that from 2010 to 2018, the total population of North Jiangxi Province only increased from 36.19 million to 36.66 million,57 the error of using the 2010 census data is not too great. At the same time, using the 2010 census data can improve the data accuracy at the county level. When calculating the incidence rate, considering the difference between the number of cancers after spatial smoothing interpolation and the true value, the original data of the number of cancers are used.
The gynecological cancer case data in this study were obtained from the case data group of the Jiangxi Cancer Center, which should be theoretically smaller than the actual number of regional cancers. Due to this, the Jiangxi Provincial Cancer Center is the largest cancer research institution in Jiangxi Province, and its case data have representativeness. Therefore, the spatial pattern and distribution laws obtained by this research have reliability. This study used GIS spatial analysis and scanning statistical analysis methods to study the spatial distribution pattern, structure, and agglomeration regularity of major gynecological cancers, such as cervical cancer, ovarian cancer, and uterine cancer, in northern Jiangxi Province. In addition, the spatial scan statistics revealed high-risk areas and relative risk values on the county scale. This research provides a reference for regional public health policy formulation, cancer screening key areas, and related disease risk detection.
It is generally believed that the spatial distribution of gynecological cancer may be affected by lifestyle and socio-economic development.54 There are many factors that affect the incidence of gynecological cancers, such as genetics, living environment, lifestyle, and socioeconomic factors. These factors influence the incidence and treatment of gynecological cancer.70 General screening can increase the early diagnosis of gynecological cancer.71 Many studies in recent years have shown that the social factors of gynecological cancer causes affect its incidence72 and are important from the perspective of the epidemiological characteristics of gynecological cancer. The incidence of gynecological cancer in undeveloped countries is higher than in developing countries.73 The results of hotspots analysis and scanning statistics show that Tonggu, Xiushui, Jingan, Fengxin and other counties in the northwest of the study area are all areas with high incidence of gynecological cancer. The socio-economic status of this area is an underdeveloped area. The secondary risk areas are also mostly located in economically underdeveloped counties. The spatial distribution of ovarian cancer and uterine cancer in Nanchang city is a risk area, which is probably due to the better economic conditions in the area, better medical conditions and proximity to the Jiangxi Cancer Center. This also shows that better medical conditions can improve the preventive effect.
Limited by the data source and region, this study only analyzed the gynecological cancer data in northern Jiangxi Province for 3 years. In the future, it is possible to collect more abundant cancer medical record data and population data, obtain a more precise spatial distribution pattern, and provide reasonable policy recommendations for the rational formulation of regional cancer prevention and screening.
Conclusions
This study uses spatial analysis methods and scanning statistical methods to analyze the data of gynecological cancers in northern Jiangxi Province from 2016 to 2018. The results show that regional medical record data can better achieve spatial matching and visualization through address conversion. Through point pattern analysis, spatial autocorrelation, Kernel density estimation, cold and hotspot analysis and scanning statistics, we can comprehensively identify the regional cancer distribution pattern and its changing process. The research results can provide a rational policy reference for future regional cancer treatment resource allocation and cancer prevention screening.
Data Accessibility
The data accessed is freely available.
Acknowledgment
We thank LetPub for its linguistic assistance during the preparation of this manuscript.
Author Contributions
All authors made a significant contribution to the work reported, whether that is in the conception, study design, execution, acquisition of data, analysis and interpretation, or in all these areas; took part in drafting, revising or critically reviewing the article; gave final approval of the version to be published; have agreed on the journal to which the article has been submitted; and agree to be accountable for all aspects of the work.
Disclosure
The authors declare that they have no conflicts of interest for this work.
References
1. Bray F, Ferlay J, Soerjomataram I, Siegel R, Torre L, Jemal A. Global cancer statistics 2018: GLOBOCAN estimates of incidence and mortality worldwide for 36 cancers in 185 countries. CA Cancer J Clin. 2018;68:394–424.
2. Jiang X, Tang H, Chen T. Epidemiology of gynecologic cancers in China. J Gynecol Oncol. 2018;29:e7. doi:10.3802/jgo.2018.29.e7
3. Torre LA, Bray FI, Siegel RL, Ferlay J, Lortettieulent J, Jemal A. Global cancer statistics, 2012. CA Cancer J Clin. 2015;65:87–108. doi:10.3322/caac.21262
4. Mendivil AA, Busch JR, Richards DC, Vittori H, Goldstein BH. The impact of an enhanced recovery after surgery program on patients treated for gynecologic cancer in the community hospital setting. Int J Gynecol Cancer. 2018;28:581–585. doi:10.1097/IGC.0000000000001198
5. Tai Y, Hsu H, Chiang Y, Chen Y, Chen C, Cheng W. Impact of adjuvant modalities on survival in patients with advanced stage endometrial carcinoma: a retrospective analysis from a tertiary medical center. Int J Env Res Pub He. 2019;16:2561. doi:10.3390/ijerph16142561
6. Siegel RL, Miller KD, Ahmedin J. Cancer statistics. CA Cancer J Clin. 2018;68:7–30. doi:10.3322/caac.21442
7. Chen W, Sun K, Zheng R, et al. Cancer incidence and mortality in China, 2014. Chinese J Cancer Res. 2018;30:1–12. doi:10.21147/j.issn.1000-9604.2018.01.01
8. Arbyn M, Weiderpass E, Bruni L, et al. Estimates of incidence and mortality of cervical cancer in 2018: a worldwide analysis. Lancet Glob Health. 2020;8(2):e191–e203. doi:10.1016/S2214-109X(19)30482-6
9. Disaia PJ, Creasman WT, Mannel RS, McMeekin DS, Mutch DG. Clinical Gynecologic Oncology. Philadelphia, PA: Elsevier Health Sciences; 2017:1–617.
10. Nelson G, Bakkum-Gamez J, Kalogera E, et al. Guidelines for perioperative care in gynecologic/oncology: Enhanced Recovery After Surgery (ERAS) society recommendations—2019 update. Int J Gynecol Cancer. 2019;29(4):651–668. doi:10.1136/ijgc-2019-000356
11. Tewari KS, Java JJ, Eskander RN, Monk BJ, Burger RA. Early initiation of chemotherapy following complete resection of advanced ovarian cancer associated with improved survival: NRG Oncology/Gynecologic Oncology Group study. Ann Oncol. 2016;27(1):114–121. doi:10.1093/annonc/mdv500
12. Hay CM, Lefkowits C, Crowley-Matoka M, et al. Strategies for introducing outpatient specialty palliative care in gynecologic oncology. J Oncol Pract. 2017;13:e712–e720. doi:10.1200/JOP.2017.020818
13. Barcellini A, Vitolo V, Facoetti A, et al. Feasibility of carbon ion radiotherapy in the treatment of gynecological melanoma. In Vivo (Brooklyn). 2019;33(2):473–476. doi:10.21873/invivo.11497
14. Small W
15. Simms KT, Steinberg J, Caruana M, et al. Impact of scaled up human papillomavirus vaccination and cervical screening and the potential for global elimination of cervical cancer in 181 countries, 2020–99: a modelling study. Lancet Oncol. 2019;20(3):394–407. doi:10.1016/S1470-2045(18)30836-2
16. Lyson HC, Le GM, Zhang J, et al. Social media as a tool to promote health awareness: results from an online cervical cancer prevention study. J Cancer Educ. 2019;34(4):819–822. doi:10.1007/s13187-018-1379-8
17. Bratic JS, Seyferth ER, Bocchini JA. Update on barriers to human papillomavirus vaccination and effective strategies to promote vaccine acceptance. Curr Opin Pediatr. 2016;28:407–412. doi:10.1097/MOP.0000000000000353
18. Monk BJ, Berman ML, Montz FJ. Adhesions after extensive gynecologic surgery: clinical significance, etiology, and prevention. Am J Obstet Gynecol. 1994;170:1396–1403. doi:10.1016/S0002-9378(94)70170-9
19. Kwon JS, Sun CC, Peterson SK, et al. Cost‐effectiveness analysis of prevention strategies for gynecologic cancers in Lynch syndrome. Cancer Am Cancer Soc. 2008;113:326–335.
20. Lindau ST, Tomori C, Lyons T, Langseth L, Bennett CL, Garcia P. The association of health literacy with cervical cancer prevention knowledge and health behaviors in a multiethnic cohort of women. Am J Obstet Gynecol. 2002;186:938–943. doi:10.1067/mob.2002.122091
21. Van Nguyen JM, Sadeghi M, Gien LT, et al. Impact of a preventive bundle to reduce surgical site infections in gynecologic oncology. Gynecol Oncol. 2019;152:480–485. doi:10.1016/j.ygyno.2018.09.008
22. Kassem N, Stout LA, Hunter C, Schneider B, Radovich M. Precision prevention: the current state and future of genomically guided cancer prevention. JCO Precis Oncol. 2020;4(4):96–108. doi:10.1200/PO.19.00278
23. Ge E, Zhang X, Wang X, Wei X. Spatial and temporal analysis of tuberculosis in Zhejiang Province, China, 2009–2012. Infect Dis Poverty. 2016;5:11–20. doi:10.1186/s40249-016-0104-2
24. Xu X, Zhao Y, Xia S, Zhang X. Investigation of multi-scale spatio-temporal pattern of oldest-old clusters in China on the basis of spatial scan statistics. PLoS One. 2019;14:e219695.
25. Qi F, Du F. Tracking and visualization of space-time activities for a micro-scale flu transmission study. Int J Health Geogr. 2013;12:6. doi:10.1186/1476-072X-12-6
26. Wu X, Hu S, Kwaku AB, et al. Spatio-temporal clustering analysis and its determinants of hand, foot and mouth disease in Hunan, China, 2009–2015. BMC Infect Dis. 2017;17:645. doi:10.1186/s12879-017-2742-9
27. Liao Y, Ouyang R, Wang J, Xu B. A study of spatiotemporal delay in hand, foot and mouth disease in response to weather variations based on SVD: a case study in Shandong Province, China. Bmc Public Health. 2015;15(1):71. doi:10.1186/s12889-015-1446-6
28. Qin Q, Guo W, Tang W, et al. Spatial analysis of the human immunodeficiency virus epidemic among men who have sex with men in China, 2006–2015. Clin Infect Dis. 2017;64:956–963. doi:10.1093/cid/cix031
29. Chen Y, Huang X, Xiao Y, et al. Spatial analysis of schistosomiasis in Hubei Province, China: a GIS-based analysis of schistosomiasis from 2009 to 2013. PLoS One. 2015;10:e0118362.
30. Fukuda Y, Umezaki M, Nakamura K, Takano T. Variations in societal characteristics of spatial disease clusters: examples of colon, lung and breast cancer in Japan. Int J Health Geogr. 2005;4:16. doi:10.1186/1476-072X-4-16
31. Keshavarzi B, Moore F, Najmeddin A, Rahmani F, Malekzadeh A. Quality of drinking water and high incidence rate of esophageal cancer in Golestan province of Iran: a probable link. Environ Geochem Health. 2012;34:15–26. doi:10.1007/s10653-011-9377-3
32. Shalowitz DI, Vinograd AM, Giuntoli RL
33. Bingi D, Anthony G, Okello D, Catherine LM. Spatial analysis of cervical cancer and correlated factors. J Remote Sens GIS. 2018;7:223. doi:10.4172/2469-4134.1000223
34. Padilla CM, Painblanc F, Soler-Michel P, Vieira VM. Mapping variation in breast cancer screening: where to intervene? Int J Env Res Pub He. 2019;16:2274. doi:10.3390/ijerph16132274
35. Mahdavifar N, Pakzad R, Ghoncheh M, Pakzad I, Moudi A, Salehiniya H. Spatial analysis of breast cancer incidence in Iran. Asian Pac J Cancer Prev. 2016;17(sup3):59–64. doi:10.7314/APJCP.2016.17.S3.59
36. Pakzad R, Ghoncheh M, Pournamdar Z, et al. Spatial analysis of skin cancer incidence in Iran. Asian Pac J Cancer Prev. 2016;17(sup3):33–37. doi:10.7314/APJCP.2016.17.S3.33
37. Pakzad R, Moudi A, Pournamdar Z, et al. Spatial analysis of colorectal cancer in Iran. Asian Pac J Cancer Prev. 2016;17(sup3):53–57. doi:10.7314/APJCP.2016.17.S3.53
38. Pakzad R, Khani Y, Pakzad I, et al. Spatial analysis of stomach cancer incidence in Iran. Asian Pac J Cancer Prev. 2016;17(sup3):27–32. doi:10.7314/APJCP.2016.17.S3.27
39. Wang JF, Li XH, Christakos G, et al. Geographical detectors-based health risk assessment and its application in the neural tube defects study of the Heshun Region, China. Int J Geogr Inf Sci. 2010;24:107–127. doi:10.1080/13658810802443457
40. Anselin L. Local indicators of spatial association-LISA. Geogr Anal. 1995;27:93–115. doi:10.1111/j.1538-4632.1995.tb00338.x
41. Getis A, Ord JK. The analysis of spatial association by use of distance statistics. Geogr Anal. 1992;24:189–206. doi:10.1111/j.1538-4632.1992.tb00261.x
42. Duczmal L, Kulldorff M, Huang L. Evaluation of spatial scan statistics for irregularly shaped clusters. J Comput Graph Stat. 2017;64(2):428–442. doi:10.1198/106186006X112396
43. Mitchell A. The ESRI Guide to GIS Analysis: Modeling Suitability, Movement, and Interaction. Vol. 3. Redlands, CA: Esri Press; 2012:1–109.
44. Salinas GD, Whitworth L, Merwin P, Emarine J. Pancreatic cancer management and treatment landscape awareness of gastroenterologists: results from us physician surveys conducted in 2013 and 2015. J Gastrointest Cancer. 2018;49(1):41–49. doi:10.1007/s12029-016-9906-5
45. Yin J, Wu X, Li S, Li C, Guo Z. Impact of environmental factors on gastric cancer: a review of the scientific evidence, human prevention and adaptation. J Environ Sci China. 2019;89:65–79. doi:10.1016/j.jes.2019.09.025
46. Gastounioti A, Oustimov A, Hsieh M, Pantalone L, Conant EF, Kontos D. Using convolutional neural networks for enhanced capture of breast parenchymal complexity patterns associated with breast cancer risk. Acad Radiol. 2018;25:977–984. doi:10.1016/j.acra.2017.12.025
47. Smith ND, Prasad SM, Patel AR, et al. Bladder cancer mortality in the United States: a geographic and temporal analysis of socioeconomic and environmental factors. J Urol. 2016;195:290–296. doi:10.1016/j.juro.2015.07.091
48. Shah V, Rieger RH, Pan LX. Precipitation and climate zone explains the geographical disparity in the invasive cancer incidence rates in the United States. Environ Eng Sci. 2019;36:1452–1458. doi:10.1089/ees.2019.0241
49. Cornelis C, Schoeters G, Kellen E, Buntinx F, Zeegers M. Development of a GIS-based indicator for environmental pesticide exposure and its application to a Belgian case–control study on bladder cancer. Int J Hyg Envir Heal. 2009;212:172–185. doi:10.1016/j.ijheh.2008.06.001
50. Atabi F, Mirzahosseini SAH. GIS-based assessment of cancer risk due to benzene in Tehran ambient air. Int J Occup Med Env. 2013;26:770–779.
51. Chen J, Roth RE, Naito AT, Lengerich EJ, MacEachren AM. Geovisual analytics to enhance spatial scan statistic interpretation: an analysis of US cervical cancer mortality. Int J Health Geogr. 2008;7:57. doi:10.1186/1476-072X-7-57
52. Lofters AK, Gozdyra P, Lobb R. Using geographic methods to inform cancer screening interventions for South Asians in Ontario, Canada. Bmc Public Health. 2013;13(1):395. doi:10.1186/1471-2458-13-395
53. Roche LM, Niu X, Henry KA. Invasive cervical cancer incidence disparities in New Jersey—a spatial analysis in a high incidence state. J Health Care Poor U. 2015;26:1173–1185. doi:10.1353/hpu.2015.0127
54. van Broekhoven ME, de Rooij BH, Pijnenborg JM, et al. Illness perceptions and changes in lifestyle following a gynecological cancer diagnosis: a longitudinal analysis. Gynecol Oncol. 2017;145:310–318. doi:10.1016/j.ygyno.2017.02.037
55. Tang X, Li H, Xu X, et al. Changing land use and its impact on the habitat suitability for wintering anseriformes in China’s Poyang Lake region. Sci Total Environ. 2016;557–558:296–306. doi:10.1016/j.scitotenv.2016.03.108
56. Xie J. Land Annals of Jiangxi Province. Beijing: China Local Records Press; 2003:1–78.
57. Wan Q. Jiangxi Statistical Yearbook. Beijing: China Statistics Press; 2018.
58. Rahman M, Yang R, Di L. Clustering Indian Ocean tropical cyclone tracks by the standard deviational ellipse. Climate. 2018;6(2):39. doi:10.3390/cli6020039
59. Lefever DW. Measuring geographic concentration by means of the standard deviational ellipse. AJS. 1926;32:88–94. doi:10.1086/214027
60. Ord JK, Getis A. Local spatial autocorrelation statistics: distributional issues and an application. Geogr Anal. 1995;27:286–306. doi:10.1111/j.1538-4632.1995.tb00912.x
61. Espindola GM, Câmara G, Reis IA, Bins LS, Monteiro AM. Parameter selection for region-growing image segmentation algorithms using spatial autocorrelation. J Remote Sens. 2006;27(14):3035–3040. doi:10.1080/01431160600617194
62. Kiskowski MA, Hancock JF, Kenworthy AK. On the use of Ripley’s K-function and its derivatives to analyze domain size. Biophys J. 2009;97:1095–1103. doi:10.1016/j.bpj.2009.05.039
63. Haase P. Spatial pattern analysis in ecology based on Ripley’s K-function: introduction and methods of edge correction. J Veg Sci. 1995;6:575–582. doi:10.2307/3236356
64. Ward JS, Parker GR, Ferrandino FJ. Long-term spatial dynamics in an old-growth deciduous forest. Forest Ecol Manag. 1996;83:189–202. doi:10.1016/0378-1127(96)03722-X
65. Chen Y-C. A tutorial on kernel density estimation and recent advances. Biostat Epidemiol. 2017;1(1):161–187. doi:10.1080/24709360.2017.1396742
66. Spencer CJ, Yakymchuk C, Ghaznavi M. Visualising data distributions with kernel density estimation and reduced chi-squared statistic. Geosci Front. 2017;8(6):1247–1252. doi:10.1016/j.gsf.2017.05.002
67. Randolph K. Using SaTScan TM spatial-scan software with national forest inventory data: a case study in South Carolina. Math Comput for Nat Resour Sci. 2017;9:1–13.
68. Coleman M, Coleman M, Mabuza AM, Kok G, Coetzee M, Durrheim DN. Using the SaTScan method to detect local malaria clusters for guiding malaria control programmes. Malar J. 2009;8:68. doi:10.1186/1475-2875-8-68
69. Takahashi K, Kulldorff M, Tango T, Yih K. A flexibly shaped space-time scan statistic for disease outbreak detection and monitoring. Int J Health Geogr. 2008;7(1):14. doi:10.1186/1476-072X-7-14
70. Seidman H, Stellman SD, Mushinski MH. A different perspective on breast cancer risk factors: some implications of the nonattributable risk. CA Cancer J Clin. 1982;32:301–313. doi:10.3322/canjclin.32.5.301
71. Wang Q, Li J, Zheng S, et al. Breast cancer stage at diagnosis and area-based socioeconomic status: a multicenter 10-year retrospective clinical epidemiological study in China. Bmc Cancer. 2012;12:122. doi:10.1186/1471-2407-12-122
72. Ghoncheh M, Pournamdar Z, Salehiniya H. Incidence and mortality and epidemiology of breast cancer in the world. Asian Pac J Cancer Prev. 2016;17:43–46. doi:10.7314/APJCP.2016.17.S3.43
73. Igene H. Global health inequalities and breast cancer: an impending public health problem for developing countries. Breast J. 2008;14:428–434. doi:10.1111/j.1524-4741.2008.00618.x
 © 2020 The Author(s). This work is published and licensed by Dove Medical Press Limited. The
full terms of this license are available at https://www.dovepress.com/terms
and incorporate the Creative Commons Attribution
- Non Commercial (unported, 3.0) License.
By accessing the work you hereby accept the Terms. Non-commercial uses of the work are permitted
without any further permission from Dove Medical Press Limited, provided the work is properly
attributed. For permission for commercial use of this work, please see paragraphs 4.2 and 5 of our Terms.
© 2020 The Author(s). This work is published and licensed by Dove Medical Press Limited. The
full terms of this license are available at https://www.dovepress.com/terms
and incorporate the Creative Commons Attribution
- Non Commercial (unported, 3.0) License.
By accessing the work you hereby accept the Terms. Non-commercial uses of the work are permitted
without any further permission from Dove Medical Press Limited, provided the work is properly
attributed. For permission for commercial use of this work, please see paragraphs 4.2 and 5 of our Terms.