Back to Journals » International Journal of General Medicine » Volume 19
Application of Epicardial Fat Volume for Identifying Hemodynamically Significant Coronary Artery Disease: A Retrospective Study
Authors Lu W ![]() , Zhang Z
, Zhang Z ![]() , Wang L
, Wang L ![]() , Wang Z
, Wang Z ![]()
Received 9 April 2026
Accepted for publication 12 June 2026
Published 23 June 2026 Volume 2026:19 615708
DOI https://doi.org/10.2147/IJGM.S615708
Checked for plagiarism Yes
Review by Single anonymous peer review
Peer reviewer comments 2
Editor who approved publication: Dr Redoy Ranjan
Wenqi Lu,1,2 Zhe Zhang,2 Ling Wang,2 Zhen Wang3,4
1The Fourth School of Clinical Medicine, Zhejiang Chinese Medical University, Hangzhou First People’s Hospital, Hangzhou, Zhejiang, People’s Republic of China; 2Department of Radiology, Zhejiang Provincial People’s Hospital (Affiliated People’s Hospital, Hangzhou Medical College), Hangzhou, Zhejiang, People’s Republic of China; 3Department of Radiology, Affiliated Hangzhou First People’s Hospital, School of Medicine, Westlake University, Hangzhou, Zhejiang, People’s Republic of China; 4Zhejiang Key Laboratory of Zero Magnetic Medicine, Affiliated Hangzhou First People’s Hospital, School of Medicine, Westlake University, Hangzhou, Zhejiang, People’s Republic of China
Correspondence: Zhen Wang, Email [email protected]
Background: With the widespread application of coronary computed tomography angiography (CCTA), exploring novel biomarkers in imaging data to optimize the risk stratification of hemodynamically significant coronary artery disease (HS-CAD) has become a research hotspot. HS-CAD was defined as ≥ 50% stenosis on CCTA with a corresponding reversible perfusion defect on single-photon emission computed tomography myocardial perfusion imaging (SPECT-MPI). Although coronary artery calcium score (CACS) is routinely used, it is difficult to fully reflect the biological activity and functional impact of plaques. This single-center retrospective study aimed to investigate the association between epicardial fat volume (EFV) and HS-CAD, and to evaluate its incremental diagnostic value over clinical risk factors and the CACS.
Methods: A single-center retrospective study included 140 patients who underwent both CCTA and SPECT-MPI. EFV and CACS were quantitatively assessed. Univariable and multivariable logistic regression analyses were performed to identify independent predictors.
Results: Among the included patients, 50 (35.7%) had HS-CAD. The HS-CAD group had a higher prevalence of smoking and significantly greater EFV and CACS (all P< 0.05). Multivariable analysis identified smoking history (OR=5.79;95% CI:2.14– 15.66; indicating that smokers had nearly 6-fold higher odds of HS-CAD), CACS (OR=1.91 per 100-unit increase;95% CI:1.35– 2.70), and EFV (OR=1.04 per cm3 increase;95% CI:1.02– 1.07) as independent predictors (all P< 0.01). The optimal EFV cutoff for predicting HS-CAD was 91.98 cm3, with a sensitivity of 0.53 (95% CI: 0.42– 0.63) and specificity of 0.96 (95% CI: 0.91– 1.00). The area under the curve (AUC) for identifying HS-CAD was 0.78 for EFV alone and 0.79 for CACS alone. The combination of smoking history and CACS yielded an AUC of 0.84, which significantly improved to 0.90 after adding EFV. The combined model also showed good calibration and provided a net clinical benefit.
Conclusion: EFV is independently associated with HS-CAD and provides incremental diagnostic value over clinical risk factors and CACS in this single-center retrospective study. These findings suggest that EFV may serve as a valuable biomarker for improving non-invasive risk stratification, warranting prospective validation in multicenter studies.
Keywords: epicardial fat volume, coronary artery calcium score, coronary computed tomography angiography, myocardial perfusion imaging, hemodynamically significant coronary artery disease
Introduction
Coronary artery disease (CAD) remains the leading cause of mortality in China, imposing a substantial public health burden.1 Coronary computed tomography angiography (CCTA) provides detailed anatomic information on luminal stenosis and plaque burden and is widely used in low- to intermediate-risk patients with suspected CAD.2 Nonetheless, anatomic stenosis does not necessarily equate to hemodynamic significance, and CCTA alone may be insufficient to determine the functional relevance of coronary lesions.3,4 Single-photon emission computed tomography myocardial perfusion imaging (SPECT-MPI), endorsed by clinical guidelines, is a well-established noninvasive modality that directly characterizes myocardial perfusion, delineating the location, extent, and severity of ischemia.5,6 Invasive coronary angiography (ICA) remains the gold standard for anatomically defining coronary artery stenosis, providing the reference against which non-invasive modalities such as CCTA are frequently compared.7 Although integrating CCTA with SPECT-MPI yields complementary anatomical and functional information, SPECT-MPI is time-consuming and operationally complex, highlighting the need for CT derived markers to identify hemodynamically significant coronary artery disease (HS-CAD). HS-CAD was defined as ≥50% stenosis on CCTA with a corresponding reversible perfusion defect on SPECT-MPI.8
Epicardial adipose tissue (EAT) is the visceral fat depot located between the myocardium and the visceral layer of the pericardium, typically following the course of the coronary arteries.9 It has garnered attention as an organ-specific fat depot that exerts local paracrine effects on the myocardium and coronary arteries through inflammatory cytokines and adipokines, thereby contributing to atherosclerosis and ischemia.10,11 Epicardial fat volume (EFV) is a reproducible quantitative measure of EAT that can be reliably obtained from CCTA.12 Several factors have been reported to influence EFV, including age, male sex, body mass index (BMI), waist circumference, metabolic syndrome components (hypertension, diabetes, dyslipidemia), and lifestyle factors such as smoking, alcohol intake, and reduced physical activity, with BMI and waist circumference demonstrating the strongest associations with EFV.13 Studies in Western cohorts have reported associations between EFV and CAD severity, myocardial ischemia, and clinical outcomes, albeit with heterogeneous findings.14,15 In Chinese populations, large-scale data demonstrate that EFV significantly improves the prediction of obstructive CAD beyond traditional risk factors and the coronary artery calcium score (CACS);16 moreover, EFV shows a strong association with myocardial ischemia and provides incremental predictive value over clinical risk factors and CACS in patients with suspected CAD.17 However, the relationship between EFV and HS-CAD with both anatomical stenosis and reversible perfusion defect remains unclear.
Therefore, this study aims to evaluate the association between EFV and HS-CAD in Chinese patients with suspected CAD and to assess the incremental value of EFV beyond clinical risk factors and CACS for identifying HS-CAD, with the goal of refining noninvasive risk stratification and informing clinical decision-making.
Materials and Methods
Study Design and Population
Design
Single-center, retrospective cohort adhering to the STROBE guidelines. The study was approved by the Ethics Committee of Zhejiang Provincial People’s Hospital (IRB No.2025–266) and conducted in accordance with the Declaration of Helsinki; the requirement for written informed consent was waived due to the retrospective design.
Enrollment
Using a consecutive sampling method, we identified patients with suspected coronary artery disease who underwent both CCTA and SPECT-MPI between January 2022 and June 2025. The time interval between CCTA and SPECT-MPI was required to be ≤2 months.
Inclusion Criteria
(1) No acute myocardial infarction within the preceding 3 months; (2) typical or atypical angina symptoms for ≥2 months; (3) abnormal resting ECG or exercise test.
Exclusion Criteria
(1) Prior coronary artery bypass grafting or percutaneous coronary intervention; (2) poor image quality on CCTA or SPECT-MPI, or missing key clinical data.
Final Cohort
140 patients were included. Clinical data (age, sex, BMI, systolic/diastolic blood pressure, fasting glucose, and smoking history) were extracted from the hospital information system. Image readers were blinded to clinical and opposing modality results. Figure 1 shows the exclusion criteria and the study flowchart.
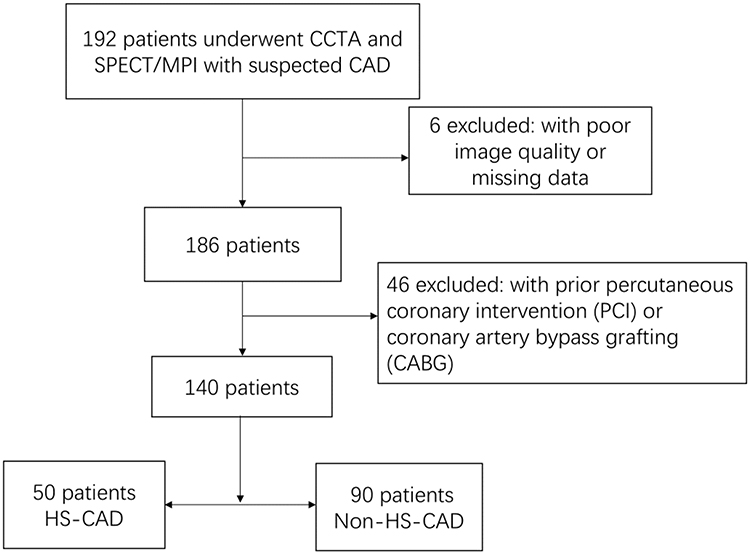 |
Figure 1 Study flow diagram showing patient selection, inclusion and exclusion criteria, and final cohort disposition (n=140). |
CCTA Acquisition and Image Analysis
Scanner and Preparation
All scans were performed on a Siemens SOMATOM Force dual-source CT system. Sublingual nitroglycerin (0.5 mg) was administered 5 minutes before image acquisition; β-blockers were given as needed to achieve a heart rate <65 bpm. Patients were coached for breath-holding; ECG gating was employed.
Protocol
Non-contrast, ECG-gated scans were first acquired for CACS, followed by contrast-enhanced CCTA. Iodinated contrast was injected via an antecubital vein at 4.5–5.0 mL/s with a dose of 0.6 mL/kg, followed by a 20 mL saline flush. Bolus tracking was performed in the descending aorta 1 cm below the carina with a trigger threshold of 150 HU. Images were reconstructed at the optimal diastolic phase (60–80% of the R–R interval). The scan range extended from 1 cm below the carina to 1 cm below the diaphragmatic surface of the heart. Tube voltage was set to 100 or 120 kV depending on body habitus, with automated tube current modulation.
Post-Processing and Stenosis Grading
The best cardiac phase was transferred to a dedicated workstation. Coronary stenosis was visually assessed by two radiologists (≥5 years of CAD imaging experience) using the American Heart Association (AHA) 15-segment model and the CAD-RADS framework, with the following categories: 0, no stenosis; 1, 1%–24%; 2, 25%–49%; 3, 50%–69%; 4, 70%–99%; 5, occlusion. Disagreements were resolved by consensus. Readers were blinded to SPECT-MPI findings.
Interobserver Reproducibility
Interobserver agreement for stenosis grading was assessed on a random subset of 30 patients (21.4% of the cohort) using quadratic weighted kappa. A kappa value > 0.75 was considered indicative of good to excellent agreement.
SPECT-MPI Protocol and Quantitative Analysis
Preparation and Protocol
A two-day, gated stress-rest protocol was performed in accordance with contemporary guidelines.18 Nitrates and β-blockers were withheld for ≥24 hours prior to testing when clinically feasible.
Radiotracer and Acquisition
For rest imaging, 25 mCi of 99mTc-MIBI was injected intravenously, and images were acquired 1.5 hours later. For stress imaging, patients underwent a modified Bruce treadmill protocol (2-minute stages with incremental workload). Blood pressure and heart rate were monitored; upon reaching target heart rate, 25 mCi of 99mTc-MIBI was injected and exercise continued for 2 minutes, with image acquisition 1.5 hours later. Data were acquired on a GE dual-head SPECT camera with high-resolution collimators using 180° acquisition and 32 projections, followed by reconstruction of short-axis, vertical long-axis, and horizontal long-axis slices.
Segmentation and Vascular Territories
The left ventricle was divided into 17 segments according to the AHA model, with assignment to left anterior descending artery (LAD), left circumflex artery (LCX), and right coronary artery (RCA) territories.19
Scoring and Ischemia Definition
Two experienced nuclear cardiologists performed visual perfusion scoring for each segment (0=normal, 1=mildly reduced, 2=moderately reduced, 3=severely reduced, 4=absent). Summed stress score (SSS) and summed rest score (SRS) were computed; the summed difference score (SDS=SSS−SRS) was used to define reversible defects. Myocardial ischemia was defined as SDS≥2.20 Readers were blinded to CCTA.
EFV Quantification
CCTA datasets were imported into Siemens Syngo.via. EAT was defined as fat located between the myocardium and the visceral pericardium, within a CT attenuation range of −190 to −30 HU.21 The pericardial contour was manually traced on contiguous axial slices from the level of the pulmonary artery bifurcation to the cardiac apex. A semi-automated threshold-based segmentation was applied to extract adipose voxels within the pericardial sac, and EFV (cm3) was calculated by summing the fat area multiplied by slice thickness across all slices.22 Measurements were performed with readers blinded to clinical and SPECT results.
Interobserver Reproducibility
Interobserver agreement for EFV measurements was assessed on the same random subset of 30 patients (21.4% of the cohort) as used for CCTA stenosis grading, using the intraclass correlation coefficient (ICC) with a two-way random-effects model for absolute agreement. An ICC value > 0.75 was considered indicative of good to excellent agreement.
CACS Quantification
Non-contrast, ECG-gated images were analyzed on Syngo.via using the Agatston method (threshold 130 HU; minimum area 1 mm2) to derive branch-specific and total CACS, in accordance with Society of Cardiovascular Computed Tomography recommendations.
Definition of HS-CAD
HS-CAD was defined as a coronary lesion with ≥50% diameter stenosis on CCTA in conjunction with a corresponding reversible perfusion defect on SPECT-MPI within the same vascular territory. Patients not meeting both criteria were classified as non–HS-CAD. Territory matching was adjudicated by a radiologist and a nuclear medicine physician using AHA mapping.
Statistical Analysis
Software and Overall Approach
Data processing and analysis were performed using R version 4.3.3 (2024–02-29), along with Zstats 1.0 (www.zstats.net). A p-value of < 0.05 was considered statistically significant during the study.
Sample Size Calculation
Based on the events-per-variable (EPV) principle recommending at least 10 events per predictor variable, and with 50 HS-CAD events and 4 predictors in the final multivariable model, the EPV ratio was 12.5, exceeding the minimum recommended threshold for logistic regression analysis.
Descriptive Statistics
Continuous variables were assessed for normality using the Shapiro–Wilk test. Normally distributed data were summarized as mean ± SD and compared using independent-samples t-tests; non-normally distributed data were summarized as median (IQR) and compared using the Mann–Whitney U-test. Categorical variables were expressed as n (%) and compared using χ2 or Fisher’s exact tests, as appropriate.
Regression Modeling
Univariable and multivariable logistic regression models were constructed with HS-CAD as the dependent variable. CACS was modeled as a continuous variable scaled by a factor of 100 (per 100-unit increase) to improve clinical interpretability. Variables with P<0.05 in univariable analysis were entered into multivariable models using a forward stepwise selection method with an entry criterion of P < 0.05 and a removal criterion of P > 0.10. Variables with P ≥ 0.05 in the univariable analysis were not considered for entry. Results were reported as ORs with 95% CIs.
Discrimination, Calibration, and Clinical Utility
Model discrimination was evaluated using receiver operating characteristic (ROC) curves and area under the curve (AUC) with 95% CIs. Model calibration was assessed by the Hosmer–Lemeshow test and calibration plots. Clinical utility was examined via decision curve analysis (DCA).
Results
Baseline Characteristics and Group Comparisons (Table 1)
A total of 140 patients with suspected coronary artery disease were included: 88 males (62.86%), 66 with hypertension (47.14%), 26 with diabetes (18.57%), and 46 with a smoking history (32.86%). Overall, the mean age was 59.31 ± 14.11 years, BMI 24.43 ± 3.46 kg/m2, EFV 100.05 ± 24.12 cm3, and CACS 13.25 (0.00, 167.57). Based on combined CCTA and SPECT-MPI findings, 50 patients (35.7%) were classified as HS-CAD and 90 (64.3%) as non–HS-CAD. Compared with the non–HS-CAD group, the HS-CAD group was older (63.60 ± 12.38 vs 56.93 ± 14.51 years, P=0.007), had a higher prevalence of smoking (54.00% vs 21.11%, P<0.001), and exhibited higher EFV (114.92 ± 16.56 vs 91.70 ± 23.74 cm3, P<0.001) and markedly elevated CACS [193.65 (34.08, 560.88) vs 0.55 (0.00, 39.72), P<0.001]. No significant between-group differences were observed for BMI, sex, hypertension, or diabetes (all P>0.05).
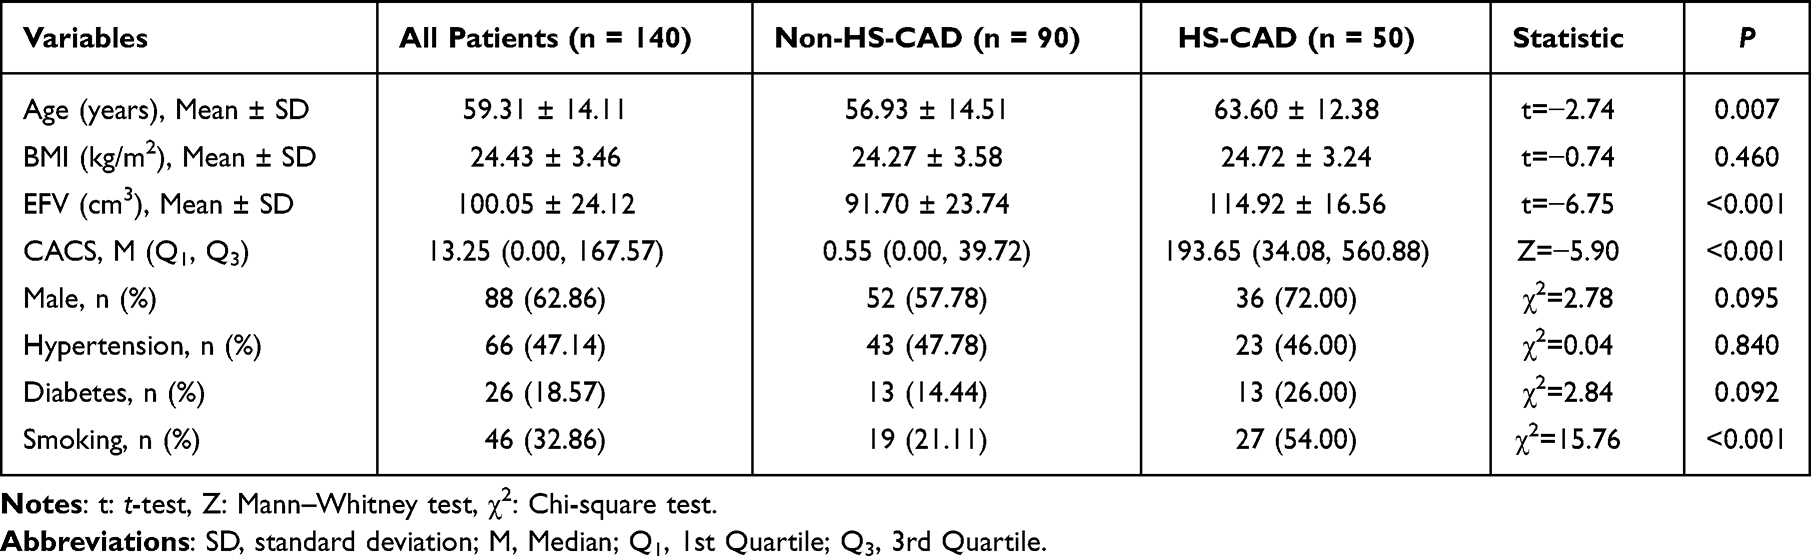 |
Table 1 Baseline Characteristics and Group Comparisons |
Association Between EFV and HS-CAD (Table 2)
In univariable logistic regression, smoking history, age, CACS, and EFV were significantly associated with HS-CAD (all P<0.01), whereas sex, BMI, hypertension, and diabetes were not. In the multivariable model, smoking history (OR=5.79; 95% CI: 2.14–15.66; P<0.001), CACS (OR=1.91 per 100-unit increase; 95% CI:1.35–2.70; P<0.001), and EFV (OR=1.04 per cm3 increase; 95% CI: 1.02–1.07; P<0.001) remained independent predictors of HS-CAD. Age, although significant in univariable analysis, was not retained as an independent predictor after adjustment (P=0.616), suggesting attenuation by imaging and behavioral covariates.
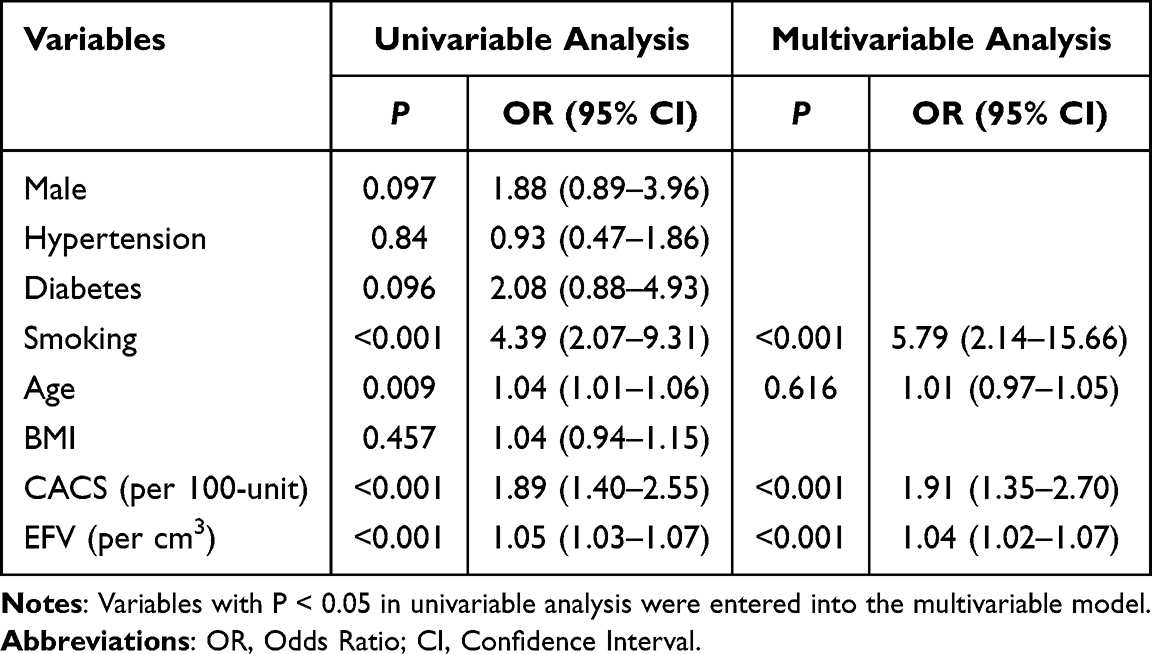 |
Table 2 Univariable and Multivariable Logistic Regression Analysis |
Diagnostic Performance of EFV for Identifying HS-CAD
ROC analysis demonstrated AUCs of 0.66 for smoking history, 0.79 for CACS, and 0.78 for EFV. Figure 2 shows ROC curves of different independent predictors. ROC analysis identified an optimal EFV cutoff of 91.98 cm3 for predicting HS-CAD. At this cutoff, the sensitivity was 0.53 (95% CI: 0.42–0.63) and the specificity was 0.96 (95% CI: 0.91–1.00). Combining smoking history with CACS increased the AUC to 0.85, and further addition of EFV improved the AUC to 0.90 (Figure 3 shows ROC curves of combined model), indicating clear incremental discrimination. Calibration plots showed good agreement between predicted and observed risks. Figure 4 shows calibration curve of combined model (Smoking + CACS + EFV). DCA revealed favorable net clinical benefit across a broad range of threshold probabilities. Figure 5 shows decision curve of combined model (Smoking + CACS + EFV). Figure 6 shows a representative case example.
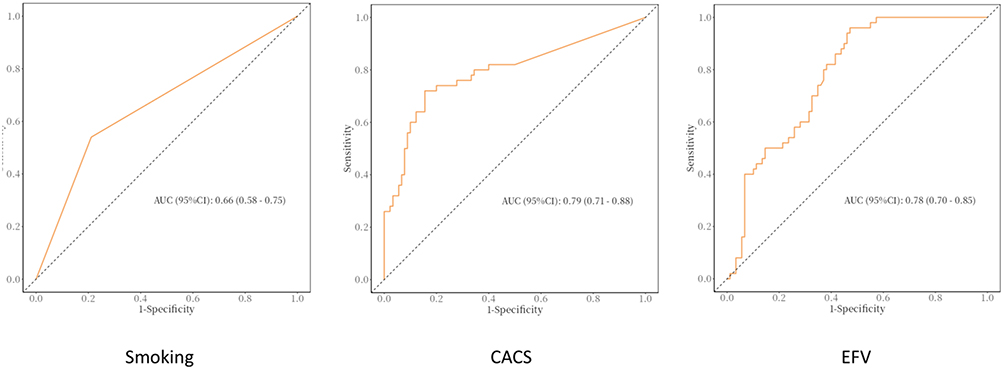 |
Figure 2 Receiver operating characteristic (ROC) curves of independent predictors (smoking history, CACS, and EFV) for identifying hemodynamically significant coronary artery disease (HS-CAD). |
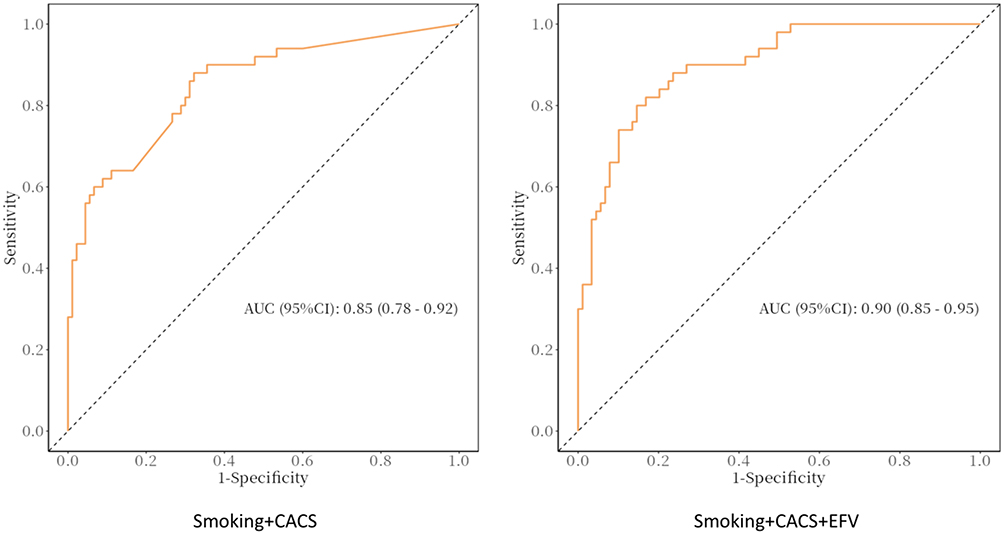 |
Figure 3 ROC curves comparing the combined models: smoking history + CACS (AUC=0.85) and smoking history + CACS + EFV (AUC=0.90). |
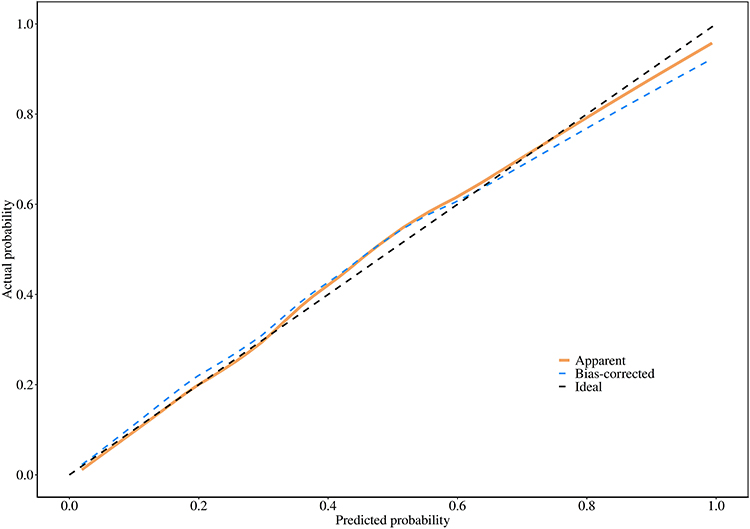 |
Figure 4 Calibration curve of the combined model (smoking history + CACS + EFV) showing agreement between predicted and observed risks. |
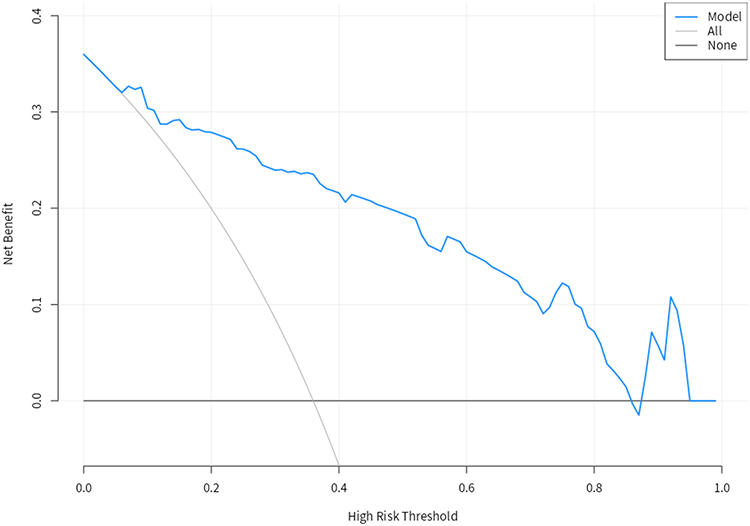 |
Figure 5 Decision curve analysis (DCA) of the combined model (smoking history + CACS + EFV) demonstrating net clinical benefit across a range of threshold probabilities. |
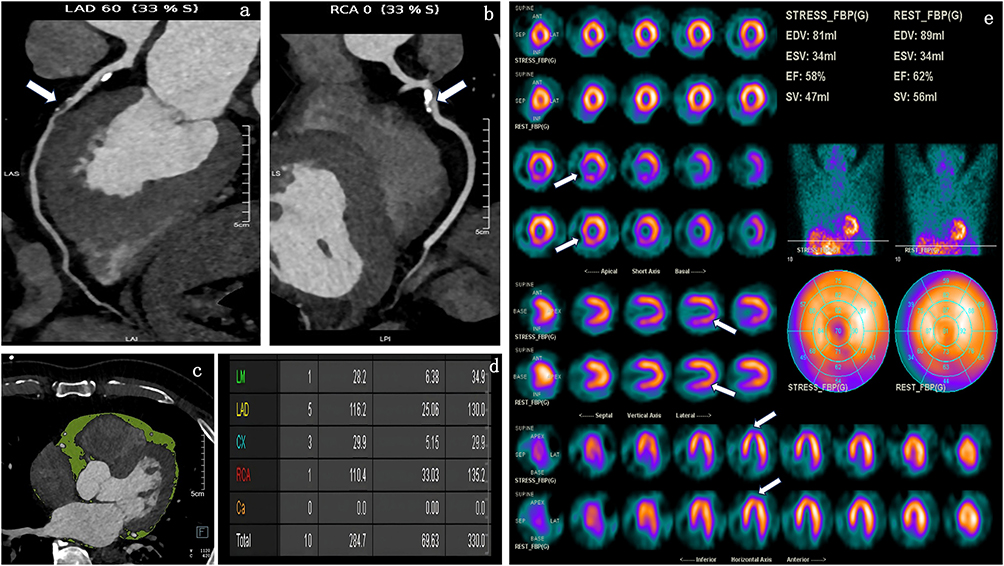 |
Figure 6 A representative case example. A 72-year-old male patient was admitted to the hospital due to chest pain after activity for one month. The patient was diagnosed with suspected CAD. Panel (a) shows the mid-segment of the LAD is 60% stenosed (white arrow). Panel (b) shows the proximal segment of the RCA is 80% stenosed (white arrow). Panel (c) shows EAT in green of transverse view. EFV was 120.99 cm3. Panel (d) shows indicates that CACS was 330.0. Panel (e) shows stress (the odd row) and rest (the even row) MPI of short-axis, vertical long-axis and horizontal long-axis images respectively, indicating that reversible myocardial ischemia on basal anterior, inferior, and inferoseptal, mid inferior and inferoseptal (white arrow), with SDS equaled to 5. |
Interobserver Reproducibility
Interobserver agreement was assessed on a random subset of 30 patients (21.4% of the cohort). For EFV measurements, the intraclass correlation coefficient (ICC) was 0.985 (95% CI: 0.969–0.993), indicating excellent agreement. For CCTA stenosis grading (CAD-RADS 0–5), the quadratic weighted kappa was 0.978, also indicating excellent agreement.
Discussion
Our study demonstrates that EFV is significantly associated with HS-CAD, independent of established clinical risk factors and the CACS. The incorporation of EFV into a model containing these traditional risk markers yielded a superior discriminative ability for identifying HS-CAD, as evidenced by an area under the curve of 0.90, and suggested a net clinical benefit on decision curve analysis.
These findings align with and extend previous research. Our results are consistent with Nakazato et al, who, using PET/CT, demonstrated that EFV remained independently associated with myocardial ischemia in the presence of obstructive CAD after adjusting for traditional risk factors and CACS.23 Similarly, Brandt et al, in a CT-FFR based study, reported higher EFV and its incremental predictive value in patients with hemodynamically significant lesions.24 By employing a composite definition of HS-CAD integrating both anatomical (CCTA) and functional (SPECT-MPI) criteria, our study further validates the robust association between EFV and hemodynamic significance.
Despite the growing body of evidence supporting the association between EFV and CAD severity, conflicting findings exist. Several studies have reported that the predictive value of EFV may be limited by substantial measurement variability and interobserver disagreement, particularly when different CT platforms, segmentation thresholds, or reconstruction parameters are used. For instance, interobserver variability for EFV quantification has been reported to range from 3% to 12% across different cohorts, potentially diluting diagnostic accuracy when applied in heterogeneous clinical settings. These discrepancies highlight the need for standardized acquisition and quantification protocols before EFV can be reliably integrated into routine clinical practice. In our study, we attempted to minimize this variability by using a consistent CT scanner, predefined fat attenuation windows (−190 to −30 HU), and manual pericardial contouring by experienced radiologists, followed by semi-automated segmentation. The excellent interobserver agreement (ICC = 0.985) observed in our reproducibility analysis supports the reliability of our EFV measurements.
The biological plausibility of this association is supported by the understanding of EAT as a metabolically active paracrine organ. EAT is a source of pro-inflammatory cytokines, including IL-1β, IL-6, MCP-1, and TNF-α, as well as adipokines such as leptin and adiponectin, which modulate insulin sensitivity and inflammatory responses.11 Given its proximity to the coronary arteries and the absence of a fascial barrier, these inflammatory mediators can directly influence the coronary wall and plaque microenvironment via paracrine or “vasocrine” signaling, thereby promoting inflammation, endothelial dysfunction, and plaque vulnerability, including the development of thin-cap fibroatheroma and positive remodeling, which ultimately exacerbate ischemic burden.25 This local inflammatory network provides a mechanistic foundation for our observations.
An important nuance in the relationship between EFV and coronary stenosis is the potential saturation effect. Previous investigations have suggested that once EFV exceeds approximately 130–135cm3, further increases in epicardial fat volume show a limited correlation with the physical degree of luminal stenosis. This non-linear relationship implies that EFV may serve as a more sensitive biomarker in patients with moderate fat accumulation, whereas its discriminative ability may plateau in individuals with markedly elevated EFV. In our study, the mean EFV in the HS-CAD group was 114.92 ± 16.56 cm3, which is below the proposed saturation threshold, suggesting that our findings reflect the discriminative range of EFV. However, the presence of a saturation effect warrants further investigation in larger cohorts with a wider distribution of EFV values, and non-linear modeling approaches (eg., restricted cubic splines) should be considered in future analyses.
From a clinical perspective, the incremental value of EFV is particularly relevant. Current guidelines emphasize the use of functional evidence to guide revascularization, as patient benefit is closely tied to the hemodynamic significance of a lesion.26 In this context, EFV, as a readily obtainable and reproducible metric from standard CCTA, may hold promise for improving pre-operative screening and risk stratification, potentially helping to identify patients who would benefit most from further functional assessment or revascularization, although prospective validation is needed before clinical application.
It is also noteworthy to consider the role of pericoronary adipose tissue (PCAT). The CT attenuation of PCAT, known as the fat attenuation index (FAI), has been linked to local inflammation and FFR-defined significance,27 though some studies have reported limited value for PCAT metrics in identifying HS-CAD.28 In comparison, the quantification of global EFV demonstrates higher reproducibility and operational stability on CCTA and has been linked to long-term event risk.29,30 Therefore, EFV may serve as a more robust CT-derived biomarker, complementing CACS and clinical factors for the non-invasive identification of HS-CAD.
The integration of advanced artificial intelligence (AI) techniques, particularly machine learning models such as deep neural networks and convolutional neural networks (CNNs), holds substantial promise for improving the diagnostic accuracy of CT-derived markers in identifying HS-CAD. Unlike traditional logistic regression models that assume linear relationships and require pre-specified predictors, deep learning algorithms can automatically extract high-dimensional features from raw imaging data, potentially capturing subtle patterns in epicardial fat distribution, texture, and radiomic characteristics that are not discernible by manual quantification. Several recent proof-of-concept studies have demonstrated that CNN-based models incorporating EAT radiomics achieve superior performance in detecting myocardial ischemia and predicting major adverse cardiovascular events compared to conventional EFV quantification alone. Future research should focus on developing and externally validating AI-based models that integrate EFV, CACS, clinical factors, and potentially per-coronary radiomic signatures to further enhance non-invasive risk stratification for HS-CAD.
Limitations
Our study has several limitations. First, its single-center, retrospective design limits causal inference and may be subject to referral and selection biases, necessitating validation in multi-center prospective cohorts. Second, this study did not include an external validation cohort. Although the events-per-variable ratio of 12.5 met the minimum recommended threshold, the lack of an independent external cohort may limit the generalizability of our findings; external validation in a separate population is therefore warranted in future studies. Third, stenosis quantification was based on CCTA rather than ICA or FFR, making it susceptible to potential misclassification due to calcium burden, heart rate, and image quality. Fourth, EFV quantification currently relies on semi-automated segmentation, and standardized, fully automated workflows are needed to facilitate broader clinical translation. Fifth, EAT characteristics exhibit ethnic variations, underscoring the urgent need to establish reference databases and risk thresholds specific to the Chinese population to improve external validity. Finally, our sample size was limited, and the lack of long-term follow-up precludes a robust assessment of the incremental prognostic value of EFV.
Additionally, the relatively small sample size (n=140) raises the potential risk of model overfitting, although the events-per-variable ratio of 12.5 meets the minimum recommended threshold. Multiple testing was performed without formal correction in the primary analyses; however, the main predictors (smoking, CACS, EFV) remained highly significant with P<0.001, making it unlikely that type I error substantially altered our conclusions. We also did not have complete data on medication use, detailed lipid profiles, or circulating inflammatory markers, which may confound the observed association between EFV and HS-CAD. Subgroup analyses were not performed due to the modest sample size and limited number of events, which would have compromised statistical power and the reliability of any stratified estimates.
Conclusions
In summary, EFV is independently associated with HS-CAD and provides incremental value over CACS and clinical risk factors for its identification in this retrospective, single-center cohort. As a simple and reproducible CT-derived metric, EFV shows potential as an adjunctive biomarker for non-invasive risk stratification. However, these findings require prospective validation in multi-center cohorts before clinical implementation. Future research should focus on establishing standardized EFV quantification protocols, exploring risk thresholds incorporating EFV and other inflammatory markers such as PCAT attenuation, and evaluating the impact of EFV-guided risk stratification on long-term clinical outcomes.
Abbreviations
CCTA, coronary computed tomography angiography; HS-CAD, hemodynamically significant coronary artery disease; CACS, coronary artery calcium score; EFV, epicardial fat volume; SPECT-MPI, single-photon emission computed tomography myocardial perfusion imaging; CAD, coronary artery disease; EAT, epicardial adipose tissue; ICA, invasive coronary angiography; BMI, body mass index; AHA, American Heart Association; LAD, left anterior descending artery; LCX, left circumflex artery; RCA, right coronary artery; SSS, summed stress score; SRS, summed rest score; SDS, summed difference score; ICC, intraclass correlation coefficient; EPV, events-per-variable; AUC, area under the curve; ROC, receiver operating characteristic; DCA, decision curve analysis; PCAT, pericoronary adipose tissue; FAI, fat attenuation index; AI, artificial intelligence; CNN, convolutional neural network.
Data Sharing Statement
The datasets used and analysed during the current study are available from the corresponding author on reasonable request.
Ethics Approval and Informed Consent
This study was performed in line with the principles of the Declaration of Helsinki. Approval was granted by the Ethics Committee of Zhejiang Provincial People’s Hospital (IRB No.2025-266).
Consent for Publication
This study was approved by the Ethics Committee of Zhejiang Provincial People’s Hospital, and the requirement for informed consent was waived due to the use of anonymized historical data.
Author Contributions
All authors made a significant contribution to the work reported, whether that is in the conception, study design, execution, acquisition of data, analysis and interpretation, or in all these areas; took part in drafting, revising or critically reviewing the article; gave final approval of the version to be published; have agreed on the journal to which the article has been submitted; and agree to be accountable for all aspects of the work.
Funding
Zhejiang Provincial Public Welfare Research Project (grant. LGC22H180003).
Disclosure
The authors declare that they have no competing interests in this work.
References
1. Ma L-Y, Chen -W-W, Gao R-L, et al. China cardiovascular diseases report 2018: an updated summary. J Geriatric Cardiol. 2020;17(1):1–12. doi:10.11909/j.issn.1671-5411.2020.01.001
2. von Ballmoos MW, Haring B, Juillerat P, Alkadhi H. Meta-analysis: diagnostic performance of low-radiation-dose coronary computed tomography angiography. Ann Internal Med. 2011;154(6):413–420. doi:10.7326/0003-4819-154-6-201103150-00007
3. Hacker M, Jakobs T, Hack N, et al. Sixty-four slice spiral CT angiography does not predict the functional relevance of coronary artery stenoses in patients with stable angina. Eur J Nucl Med Mol Imaging. 2007;34(1):4–10. doi:10.1007/s00259-006-0207-2
4. Meijboom WB, Van Mieghem CA, van Pelt N, et al. Comprehensive assessment of coronary artery stenoses: computed tomography coronary angiography versus conventional coronary angiography and correlation with fractional flow reserve in patients with stable angina. J Am College Cardiol. 2008;52(8):636–643. doi:10.1016/j.jacc.2008.05.024
5. American College of Cardiology Foundation/American Heart Association Task Force, Fihn SD, Gardin JM, Abrams J, et al. ACCF/AHA/ACP/AATS/PCNA/SCAI/STS guideline for the diagnosis and management of patients with stable ischemic heart disease: a report of the American College of Cardiology Foundation/American Heart Association task force on practice guidelines, and the American College of Physicians, American Association for Thoracic Surgery, Preventive Cardiovascular Nurses Association, Society for Cardiovascular Angiography and Interventions, and Society of Thoracic Surgeons. Circulation. 2012;126(25):e354–e471. doi:10.1161/CIR.0b013e318277d6a0
6. Dorbala S, Ananthasubramaniam K, Armstrong IS, et al. Single Photon Emission Computed Tomography (SPECT) Myocardial Perfusion Imaging Guidelines: instrumentation, Acquisition, Processing, and Interpretation. J Nucl Cardiol. 2018;25(5):1784–1846. doi:10.1007/s12350-018-1283-y
7. Pezel T, Habert P. Can coronary CT angiography be used as the new gold-standard for quantifying coronary artery disease burden? Diagn Interventional Imaging. 2024;105(4):127–128. doi:10.1016/j.diii.2024.01.001
8. Rispler S, Keidar Z, Ghersin E, et al. Integrated single-photon emission computed tomography and computed tomography coronary angiography for the assessment of hemodynamically significant coronary artery lesions. J Am College Cardiol. 2007;49(10):1059–1067. doi:10.1016/j.jacc.2006.10.069
9. Iacobellis G, Corradi D, Sharma AM. Epicardial adipose tissue: anatomic, biomolecular and clinical relationships with the heart. Nature clinical practice. Cardiovasc Med. 2005;2(10):536–543. doi:10.1038/ncpcardio0319
10. Baker AR, Harte AL, Howell N, et al. Epicardial Adipose Tissue as a Source of Nuclear Factor-κB and c-Jun N-Terminal Kinase Mediated Inflammation in Patients with Coronary Artery Disease. J Clin Endocrinol Metab. 2009;94(1):261–267. doi:10.1210/jc.2007-2579
11. Mazurek T, Zhang L, Zalewski A, et al. Human epicardial adipose tissue is a source of inflammatory mediators. Circulation. 2003;108(20):2460–2466. doi:10.1161/01.CIR.0000099542.57313.C5
12. Nichols JH, Samy B, Nasir K, et al. Volumetric measurement of pericardial adipose tissue from contrast-enhanced coronary computed tomography angiography: a reproducibility study. J Cardiovas Computed Tomography. 2008;2(5):288–295. doi:10.1016/j.jcct.2008.08.008
13. Hartiala O, Magnussen CG, Bucci M, et al. Coronary heart disease risk factors, coronary artery calcification and epicardial fat volume in the Young Finns Study. European Heart Journal – Cardiovascular Imaging. 2015;16(11):1256–1263. doi:10.1093/ehjci/jev085
14. Heinz Nixdorf Investigative Group, Mahabadi AA, Lehmann N, Möhlenkamp S, et al. Noncoronary Measures Enhance the Predictive Value of Cardiac CT Above Traditional Risk Factors and CAC Score in the General Population. JACC: Cardiovascular Imaging. 2016;9(10):1177–1185. doi:10.1016/j.jcmg.2015.12.024
15. Hell MM, Ding X, Rubeaux M, et al. Epicardial adipose tissue volume but not density is an independent predictor for myocardial ischemia. J Cardiovas Computed Tomography. 2016;10(2):141–149. doi:10.1016/j.jcct.2016.01.009
16. Zhou J, Chen Y, Zhang Y, et al. Epicardial Fat Volume Improves the Prediction of Obstructive Coronary Artery Disease Above Traditional Risk Factors and Coronary Calcium Score. Circ Cardiovasc Imaging. 2019;12(1):e008002. doi:10.1161/CIRCIMAGING.118.008002
17. Yu W, Zhang F, Liu B, et al. Incremental value of epicardial fat volume to coronary artery calcium score and traditional risk factors for predicting myocardial ischemia in patients with suspected coronary artery disease. J Nucl Cardiol. 2022;29(4):1583–1592. doi:10.1007/s12350-021-02538-5
18. Henzlova MJ, Duvall WL, Einstein AJ, Travin MI, Verberne HJ. ASNC imaging guidelines for SPECT nuclear cardiology procedures: stress, protocols, and tracers. J Nucl Cardiol. 2016;23(3):606–639. doi:10.1007/s12350-015-0387-x
19. American Heart Association Writing Group on Myocardial Segmentation and Registration for Cardiac Imaging, Cerqueira MD, Weissman NJ, Dilsizian V, et al. Standardized myocardial segmentation and nomenclature for tomographic imaging of the heart. A statement for healthcare professionals from the Cardiac Imaging Committee of the Council on Clinical Cardiology of the American Heart Association. Circulation. 2002;105(4):539–542. doi:10.1161/hc0402.102975
20. Xu Y, Fish M, Gerlach J, et al. Combined quantitative analysis of attenuation corrected and non-corrected myocardial perfusion SPECT: method development and clinical validation. J Nucl Cardiol. 2010;17(4):591–599. doi:10.1007/s12350-010-9220-8
21. Huang G, Wang D, Zeb I, et al. Intra-thoracic fat, cardiometabolic risk factors, and subclinical cardiovascular disease in healthy, recently menopausal women screened for the Kronos Early Estrogen Prevention Study (KEEPS). Atherosclerosis. 2012;221(1):198–205. doi:10.1016/j.atherosclerosis.2011.12.004
22. Bettencourt N, Toschke AM, Leite D, et al. Epicardial adipose tissue is an independent predictor of coronary atherosclerotic burden. Int J Cardiol. 2012;158(1):26–32. doi:10.1016/j.ijcard.2010.12.085
23. Nakazato R, Dey D, Cheng VY, et al. Epicardial fat volume and concurrent presence of both myocardial ischemia and obstructive coronary artery disease. Atherosclerosis. 2012;221(2):422–426. doi:10.1016/j.atherosclerosis.2011.12.018
24. Brandt V, Decker J, Schoepf UJ, et al. Additive value of epicardial adipose tissue quantification to coronary CT angiography-derived plaque characterization and CT fractional flow reserve for the prediction of lesion-specific ischemia. Eur Radiol. 2022;32(6):4243–4252. doi:10.1007/s00330-021-08481-w
25. Yudkin JS, Eringa E, Stehouwer CD. “Vasocrine” signalling from perivascular fat: a mechanism linking insulin resistance to vascular disease. Lancet. 2005;365(9473):1817–1820. doi:10.1016/S0140-6736(05)66585-3
26. ESC Scientific Document Group (2019), Neumann FJ, Sousa-Uva M, Ahlsson A, et al. ESC/EACTS Guidelines on myocardial revascularization. Eur Heart J. 2018;40(2):87–165. doi:10.1093/eurheartj/ehy394
27. Ma S, Chen X, Ma Y, et al. Lesion-Specific Peri-Coronary Fat Attenuation Index Is Associated With Functional Myocardial Ischemia Defined by Abnormal Fractional Flow Reserve. Front Cardiovasc Med. 2021;8:755295. doi:10.3389/fcvm.2021.755295
28. Wen D, Li J, Ren J, Zhao H, Li J, Zheng M. Pericoronary adipose tissue CT attenuation and volume: diagnostic performance for hemodynamically significant stenosis in patients with suspected coronary artery disease. Eur J Radiol. 2021;140:109740. doi:10.1016/j.ejrad.2021.109740
29. Gorter PM, van Lindert AS, de Vos AM, et al. Quantification of epicardial and peri-coronary fat using cardiac computed tomography; reproducibility and relation with obesity and metabolic syndrome in patients suspected of coronary artery disease. Atherosclerosis. 2008;197(2):896–903. doi:10.1016/j.atherosclerosis.2007.08.016
30. Cheng VY, Dey D, Tamarappoo B, et al. Pericardial fat burden on ECG-gated noncontrast CT in asymptomatic patients who subsequently experience adverse cardiovascular events. JACC Cardiovasc Imaging. 2010;3(4):352–360. doi:10.1016/j.jcmg.2009.12.013
 © 2026 The Author(s). This work is published and licensed by Dove Medical Press Limited. The
full terms of this license are available at https://www.dovepress.com/terms
and incorporate the Creative Commons Attribution
- Non Commercial (unported, 4.0) License.
By accessing the work you hereby accept the Terms. Non-commercial uses of the work are permitted
without any further permission from Dove Medical Press Limited, provided the work is properly
attributed. For permission for commercial use of this work, please see paragraphs 4.2 and 5 of our Terms.
© 2026 The Author(s). This work is published and licensed by Dove Medical Press Limited. The
full terms of this license are available at https://www.dovepress.com/terms
and incorporate the Creative Commons Attribution
- Non Commercial (unported, 4.0) License.
By accessing the work you hereby accept the Terms. Non-commercial uses of the work are permitted
without any further permission from Dove Medical Press Limited, provided the work is properly
attributed. For permission for commercial use of this work, please see paragraphs 4.2 and 5 of our Terms.