Back to Journals » Cancer Management and Research » Volume 18

Apolipoprotein E (APOE) Promotes Cell Proliferation and Invasion in Glioma via the PI3K/AKT Signaling Pathway
Authors Xia M, Chen K, Chen W, Ren Z, Li X ![]()
Received 9 January 2026
Accepted for publication 18 March 2026
Published 1 April 2026 Volume 2026:18 594906
DOI https://doi.org/10.2147/CMAR.S594906
Checked for plagiarism Yes
Review by Single anonymous peer review
Peer reviewer comments 2
Editor who approved publication: Dr Sanjeev K. Srivastava
Mengdi Xia,1 Ke Chen,1 Weiwei Chen,2 Zhenhua Ren,1 Xiaohui Li1
1Department of Anatomy, School of Basic Medicine, Anhui Medical University, Hefei, Anhui, 230032, People’s Republic of China; 2Department of Neurosurgery, The First Affiliated Hospital of Anhui Medical University, Hefei, Anhui, 230022, People’s Republic of China
Correspondence: Xiaohui Li, Email [email protected] Zhenhua Ren, Email [email protected]
Background: Glioma presents significant therapeutic challenges due to its marked heterogeneity and resistance to conventional treatments. Apolipoprotein E (APOE), a glycoprotein involved in lipid metabolism, has been reported to be dysregulated in glioma; however, its functional role in glioma progression remains poorly understood.
Methods: APOE expression in glioma was analyzed using publicly available transcriptomic datasets from The Cancer Genome Atlas (TCGA) and Chinese Glioma Genome Atlas (CGGA). Functional studies were performed in U251MG and U87MG glioma cells with APOE overexpression or knockout. Cell proliferation, migration, and invasion were evaluated using CCK-8, Edu, Transwell, and wound-healing assay. Mechanistic analyses included RNA sequencing, immunofluorescence, nucleocytoplasmic fractionation, Western blotting and immunoprecipitation. A nude mouse xenograft model was used to assess tumor growth in vivo.
Results: APOE expression was elevated in glioma datasets. Functional assays demonstrated that APOE promotes glioma cell proliferation, migration, and invasion. Notably, APOE was detected in the nucleus, where it exhibited transcriptional regulatory activity. Mechanistically, APOE overexpression significantly activated the PI3K/AKT signaling pathway, and this effect was effectively reversed by the PI3K inhibitor LY294002. Consistently, APOE overexpression enhanced tumor growth in vivo.
Conclusion: These findings indicate that APOE promotes glioma progression through nuclear activity and activation of the PI3K/AKT signaling pathway, highlighting APOE-related signaling as a potential therapeutic target in glioma.
Keywords: glioma, APOE, PI3K/AKT signaling pathway, tumor progression, nuclear translocation
Introduction
Gliomas account for approximately 30% of all primary intracranial neoplasms and nearly 80% of malignant brain tumors, making them the leading cause of death from primary brain cancer.1 Glioma remains a major therapeutic challenge, largely due to the blood-brain barrier (BBB), which restricts the intracranial delivery and therapeutic efficacy of many systemic anticancer agents.2 Following the 2021 World Health Organization (WHO) classification, these tumors are graded 1 to 4 based on integrated histopathological and molecular features. This classification reveals significant disparities in treatment response: IDH-mutant, 1p/19q-codeleted oligodendrogliomas offer the most favorable outcomes, IDH-mutant astrocytomas are associated with intermediate prognosis, while IDH-wild-type glioblastomas, representing the most malignant form of glioma, confer the worst survival.3 Current standards of care still primarily rely on treatment that induce DNA damage, including adiotherapy and alkylating agents, such as temozolomide (TMZ), carmustine (BCNU), lomustine (CCNU) and procarbazine.4,5 Beyond molecular therapies, multifunctional biomaterials have become essential in surgical reconstruction.6 For instance, processed bovine pericardium is frequently utilized as a flexible, biocompatible dural substitute to ensure reliable repair and support tissue regeneration following glioma resection.7
Despite advancements in surgical cytoreduction, radiation, and chemotherapy, glioma recurrence remains nearly inevitable.8 Glioma progression is driven by diverse genetic and molecular alterations;9 therefore, genomic investigations are critical for understanding the pronounced intertumoral heterogeneity of gliomas and for identify key genes in tumor progression that may represent therapeutic targets.
In this context, identifying genes that link neurobiology and tumor biology is a high priority. Apolipoprotein E (APOE), a 34-kDa glycoprotein primarily known for its role in lipid metabolism and Alzheimer’s disease10,11 has emerged as a promising candidate. Increasing evidence indicates that APOE is also associated with the development and progression of multiple cancers, including gliomas.12–15 In glioma, APOE has been implicated in the regulation of tumor cell metabolism, immune response, and the tumor microenvironment.16–19 Notably, nuclear localization of APOE has been reported,20,21 suggesting novel functions beyond its traditional roles. Despite these observation, the molecular mechanisms underlying APOE’s effects in glioma remain poorly understood.
Given APOE’s involvement in critical tumor processes, it is plausible that its effects are mediated, at least in part, through key intracellular signaling pathways. Among these, the PI3K/AKT signaling cascade plays a central role in regulating cell proliferation, survival, metabolism, and migration, and aberrant activation of this pathway has been observed in up to 85% of glioblastomas.22–24 A variety of PI3K and AKT inhibitors have been developed and evaluated in preclinical and clinical studies,25 LY294002, a specific phosphatidylinositol 3-kinase (PI3K) inhibitor, has been shown to suppress PI3K/AKT signaling and promote apoptosis in glioma cells.26,27
Therefore, this study aimed to investigate the role of APOE in glioma progression and to determine whether it exerts its oncogenic effects through modulation of the PI3K/AKT singling pathway. We hypothesized that elevated APOE expression in glioma promotes its nuclear translocation and transcriptional activation, thereby regulating downstream signaling pathways such as PI3K/AKT. Elucidating APOE’s contribution to glioma biology may provide novel insights into disease mechanisms and suggest potential therapeutic strategies targeting APOE or its associated signaling pathways to inhibit glioma progression and improve patient outcomes.
Materials and Methods
APOE Expression Analysis of Public Database
APOE expression in glioma and normal brain tissues was analyzed using two independent datasets. First, the GEPIA2 web tool (http://gepia2.cancer-pku.cn), which integrates The Cancer Genome Atlas (TCGA) and Genotype-Tissue Expression (GTEx) RNA-seq data, was used to compare APOE expression in LGG and GBM tumor tissues versus normal controls. Box plots were generated using default parameters, with expression levels log2(TPM + 1) transformed. Statistical significance was assessed using one-way ANOVA (P<0.01). Second, mRNA-seq count data from the Chinese Glioma Genome Atlas (CGGA) were used to analyze APOE expression in glioma and normal brain tissues. Tumor samples (mRNAseq_693) and normal brain tissues (normal_20)28 were merged, and raw counts were normalized using the median-of-ratios method implemented in the DESeq2 package (v1.38.3) in R (v4.2.3). Differential expression analysis was performed following the standard DESeq2 workflow. For subgroup analysis, glioma samples were stratified by IDH mutation status to compare APOE expression between IDH_mutant and IDH_wildtype groups. Statistical significance was determined by Benjamini-Hochberg adjusted p-values. Normalized APOE expression values were log-transformed as log2(normalized count +1), and box plots were used for visualization.
Survival analysis was conducted using GEPIA2 to evaluate the prognostic value of APOE expression in LGG and GBM. Patients were stratified into high and low expression groups based on the median value. Kaplan–Meier curves were generated for overall survival (OS), and hazard ratios (HR) were calculated using the Cox proportional hazards model with 95% confidence intervals. Statistical significance was assessed using the Log rank test. Additionally, the CGGA mRNAseq_695 dataset was used to analyze the impact of IDH mutation status on OS. Patients with available mutation and survival data were included. Kaplan–Meier survival curves were generated using the R packages “survival” and “survminer” (v4.3.1). OS was defined as the time from diagnosis to death or last follow-up. Survival differences were assessed using the Log rank test, with p-values < 0.05 considered significant. Curves were visualized using ggsurvplot () with pval = TRUE, risk. table = TRUE, and 95% confidence intervals.
Cell Culture
The U251MG (#CL-0237, Wuhan Pricella Biotechnology Co., Ltd)., U87MG (glioblastoma of unknown origin, #CL-0238, Wuhan Pricella Biotechnology Co., Ltd)., and the 293T (#CL-0005, Wuhan Pricella Biotechnology Co., Ltd.) cell lines were procured from Wuhan Pucell Technology Co., Ltd. All the cell lines were verified through STR genotyping, and mycoplasma testing was performed. All the cells were cultured in DMEM (#BL301A, Biosharp) supplemented with 10% foetal bovine serum (#C04001, VivaCell), streptomycin (100 μg/mL, #C0222, Beyotime), and penicillin (100 U/mL, #C0222, Beyotime). The cells were incubated at 37 °C in humidified 5% CO2. The treated cells were subsequently harvested for Western blot analysis, CCK-8 and EdU assays, and transwell invasion and migration assays.
APOE Lentiviral Transduction
Lentiviral vectors encoding APOE (Lv-APOE) and control (CON335; Ubi-MCS-3FLAG-CBh-gcGFP-IRES-puromycin) were purchased from GeneChem Technology (Shanghai Genechem Co., Ltd.). Cells were infected at 70–90% confluency, and GFP expression was assessed 48–72 h post infection using fluorescence microscopy. Stable cell lines were selected by culturing infected cells in 2 μg/mL puromycin (#ST551, Beyotime) for 3–7 days. Infection efficiency was confirmed by Western blotting.
Construction of APOE Knockout Cell Line
APOE knockout cells were generated using a puromycin selection vector for CRISPR/Cas9-mediated enhancer deletion. The CRISPR/Cas9 plasmid used was pSpCas9(BB)-2A-Puro (PX459) V2.0 (Addgene plasmid, #62988). Two sgRNA sequences targeting the APOE locus were designed as follows:
sgRNA1: forwards, 5′-caccgGCGGACATGGAGGACGTGTG-3′;
reverse, 5′-aaacCACACGTCCTCCATGTCCGCC-3′;
sgRNA2: forwards, 5′-caccgGGCCTACAAATCGGAACTGG-3′;
reverse,5′- aaacCCAGTTCCGATTTGTAGGCCC-3′.
U251 cells were transfected at 60–70% confluency. At 24 hours post-transfection, the cultured medium was supplemented with 1 μg/mL puromycin and cells were incubated for 48–72 h to eliminate transfected cells. Surviving cells were dissociated into single cell suspension and seeded into 96-well plates for clonal expansion. After 2–3 weeks, individual colonies were harvested and screened for APOE knockout by Western blotting. Confirmed APOE knockout clones were expanded and maintained for downstream experiments.
Western Blotting
The cells subjected to various treatments were lysed via RIPA buffer supplemented with PMSF (# HY-B0496, MedChemExpress) (1:100) and proteinase inhibitor cocktail (#HY-K00010, MedChemExpress) (1:100). Nuclear and cytoplasmic proteins were extracted from U251MG cells subjected to various treatments via a Nuclear and Cytoplasmic Protein Extraction Kit (catalogue #P0027; Beyotime). Equal amounts of protein were subjected to SDS‒PAGE and transferred to nitrocellulose (NC) membranes (#66485, PALL). The membrane was subsequently blocked with 5% nonfat dry milk for 30‒60 min and then incubated with the following primary antibodies overnight at 4 °C: APOE (#68587, CST), PI3 kinase p85 (#660225-1-Ig, ProteinTech), phospho-PIK3R1 (p-PI3K) (#CSB-PA000712, CUSABIO), AKT (#2920S, Cell Signaling), P-AKT (S473) (#9271s, Cell Signaling), β-actin (#66009-1-Ig, ProteinTech), Lamin B1 (#12987-1-AP, ProteinTech), and α-Tubulin (#66031-1-Ig, ProteinTech) Next, the membrane was incubated with HRP-conjugated secondary antibodies for 60 min at ambient temperature Protein band signals were captured via the Tanon 5200 system (Tanon Technology Co., Ltd.) and analyzed with ImageJ software (version 1.40 g; National Institutes of Health).
Immunohistochemistry (IHC)
The collected the subcutaneous tumors from the nude mice were formalin fixed and paraffin embedded. The sections were stained according to the reagent instructions (#PV-9001, Beijing Zhongshan Jinqiao Biotechnology Co., Ltd.) and labelled with primary antibodies against APOE (#66830-1-Ig, ProteinTech), PI3 kinase p85 (#660225-1-Ig, ProteinTech), phospho-PIK3R1 (p-PI3K) (#CSB-PA000712, CUSABIO), AKT (#2920S, Cell Signaling), and phospho-AKT1/AKT2/AKT3 (S473) (#CUB-PA000466, CUSABIO) The sections were stained and photographed.
CCK-8 Assay
For the cell proliferation assay, U251MG (control, APOE-overexpressing and APOE-knockout) and U87MG (control, APOE-overexpressing) glioma cells were seeded into 96-well plates. The cells were treated with LY294002 (#T2008, Shanghai Top Science & Technology Co., Ltd.) at a concentration of 20 µM. At distinct time intervals following cell inoculation, CCK-8 (#CT0001-B, Sparkjade®, Shandong Sparkjade Biotechnology Co., Ltd.) reagent was added to the 96-well plates, and the absorbance at a wavelength of 450 nm (OD450) was measured via a plate reader (SpectraMax iD3/iD5).
Trans Well Assay
BD Matrigel™ Basement Membrane Matrix (#356234, BD Biosciences) diluted in PBS buffer was applied to the upper compartment of a 24-well plate (#143341-D; LABSELECT) on the membrane (the migration assay omitted this step). The cells subjected to various treatment conditions were resuspended at a density of 1.5 × 10⁴ cells per well in serum-free fresh medium and then seeded onto membranes coated with extracellular matrix gel, where the experimental group was treated with 20 µM LY294002 for 24 h. The cells that did not traverse the membrane and those in the upper compartment were removed, and the remaining cells were fixed with 4% paraformaldehyde (PFA). Thereafter, the cells were incubated with crystal violet staining solution for 20 min, followed by visualization under an inverted microscope (YUEHSI, YIB510, China).
Wound Healing Experiments
Initially, approximately 3×10⁵ cells were seeded into 6-well plates. On the following day, vertical scratches were introduced into the wells via a pipette tip. The detached cells were subsequently removed by washing with PBS. The remaining cells were then cultured in serum-free medium for 0, 24, or 48 h, and images were captured at these time points. During this process, the cells were treated with LY294002 at a concentration of 20 µM for 0, 24, or 48 h.
EdU Assay
The cells subjected to various treatments were labelled via an EdU Cell Proliferation Kit (#C0075S, Beyotime, China) with Alexa Fluor 555. First, the cells were seeded into a 24-well plate at an appropriate density and incubated with medium supplemented with 1× EdU at 37 °C for 3 h. Subsequently, the cells were permeabilized with 0.3% Triton X-100 at 37 °C for 15 min, followed by staining with Click Addictive Solution and Hoechst 33342. Images were acquired under a fluorescence microscope (Olympus, Axio Observer 3, Germany). Each experimental treatment was repeated at least three times to ensure the accuracy of the EdU positivity rate data.
Immunofluorescence (IF)
The cells were seeded onto glass coverslips placed in a 24-well plate at a density of 25% confluence. After the cells adhered to the substrate, the culture medium was removed, and the residual medium was washed away with PBS (#BL302A, Biosharp). The cells were then fixed with prewarmed 4% PFA (#BL593A, Biosharp) for 30 min. After three washes with PBS, the cells were permeabilized with 0.1% Triton X-100 for 20 min. Following three additional washes with PBS, the cells were blocked with goat serum (catalogue #C0265, Beyotime) at 37 °C for 30 min and then incubated with the primary antibody against APOE (#66830-1-Ig, Proteintech) overnight at 4 °C The following day, the cells were incubated with the corresponding secondary antibody (#20000930, Proteintech) for 50 min at room temperature in the dark The cell nuclei were counterstained with DAPI (#BL105A, Biosharp) for 5–10 min at room temperature in the dark. After mounting and drying, the coverslips were photographed, and the data were collected.
Immunoprecipitation (IP)
For APOE immunoprecipitation, the nuclear and cytoplasmic proteins of U251MG cells were extracted via a nuclear protein extraction kit (#P0027, Beyotime). The extracted lysates were incubated with anti-APOE (#13366S, CST) or rabbit IgG (#30000-0-AP, Proteintech) overnight at 4 °C, followed by incubation with protein A/G magnetic beads (#HY-K0202, MedChemExpress) for 2h at 4 °C. The beads were then washed three times with washing buffer and eluted with 1×SDS‒PAGE loading buffer. Subsequently, the IP was subjected to electrophoresis. After electrophoresis, the SDS‒PAGE gel was placed in Coomassie Brilliant Blue staining solution (#P0017A, Beyotime) and stained at room temperature for 1 h. Then, the gel was decolorized in Coomassie Brilliant Blue decolorizing solution (P0017C, Beyotime) by heating in a microwave until boiling and shaking on a rocker for 1 h. Finally, the gel was photographed for documentation.
RNA Sequencing
The collected APOE-overexpressing U251MG cells and control samples were subjected to RNA sequencing conducted by Beijing Tsingke Biotech Co., Ltd., with three biological replicates performed for each group. RNA integrity was assessed via an Agilent 2100 LabChip GX Bioanalyzer (Agilent, model number Platinum Agilent LabChipGX). The resulting data were analysed by Beijing Tsingke Biotech Co., Ltd. Differentially expressed genes (DEGs) between the two conditions/groups were analysed via the DESeq2 (http://www.bioconductor.org/packages/release/bioc/html/DESeq.html) R package. Gene Ontology (GO) enrichment analysis was performed via DAVID. We utilized KOBAS software to assess the enrichment of DEGs in KEGG pathways statistically.
Xenograft Tumor Model in Nude Mice
Male BALB/c nude mice were purchased from GemPharmatech Bio-Company in Jiangsu, China. All animals were housed under specific pathogen-free (SPF) conditions in a controlled environment maintained at 20–22°C, with a 12-hour light/dark cycle and 50–60% relative humidity. Food and water were provided ad libitum. The thymus-deficient nude mice were randomly assigned to four groups: (1) APOE-knockout U251MG (KO) group, (2) control U251MG glioma cell (C) group, (3) APOE-overexpressing U251MG (OE) group, and (4) APOE-overexpression U251MG treated with the PI3K inhibitor LY294002 (OE+ LY294002) group. Prior to the injection of tumor cells, the mice were anaesthetized with 2–3% isoflurane for induction, followed by maintenance with 1–1.5% isoflurane. Cancer cells were injected subcutaneously into the right dorsal side of the nude mice. Each mouse received a subcutaneous injection of 100 μL of Matrigel solution containing 5×10⁶ tumor cells. Beginning on Day 7, the OE + LY294002 group received intraperitoneal injections of LY294002 at 35 mg/kg every 3 days. Tumor size was measured weekly using calipers, and tumor volume was calculated using the formula: 1/2×length×width2. All measurements are expressed in millimeters(mm) for length and width, and in cubic millimeters (mm3) for calculated volume. The study endpoint was defined when the largest tumor reached approximately 18.1mm in diameter (close to the 20mm ethical upper limit), at which time significant intergroup differences in tumor growth were observed, and all mice were euthanized for further analysis. At the time of sacrifice, the average body weight of the mice was 28.4 ± 0.51g. Ethical approval for the in vivo portion of this study, which demonstrated that APOE promotes tumor growth, was granted by the Institutional Animal Care and Use Committee of Anhui Medical University (NO. LLSC20231146).
Statistical Analyses
Statistical analyses and data visualization were performed using GraphPad Prism 9.0.For comparisons between two groups, unpaired two-tailed Student’s t tests were used.For experiments involving more than two groups or multiple experimental conditions, one-way or two-way analysis of variance (ANOVA) was applied as appropriate. Two-way ANOVA was used for time-course experiments, including CCK-8 cell viability assays and in vivo tumor growth and body weight analyses, with time and treatment or genotype as independent factors. One-way ANOVA was applied to assess differences among multiple groups when only a single factor was involved. For experiments involving multiple pairwise comparisons, such as Trans well migration and invasion assays and Western blot quantifications of multiple protein phosphorylation markers, unpaired two-tailed t tests with false discovery rate (FDR) correction were performed to account for multiple comparisons. Kaplan–Meier survival analyses were conducted using log-rank (Mantel–Cox) tests to evaluate differences in overall survival between groups. Data are presented as mean ± SEM or mean ± SD, as specified in the corresponding figure legends. Statistical significance was defined as P < 0.05 or FDR-adjusted q < 0.05, as indicated.
Results
APOE Expression Is Elevated in Glioma and Associated with IDH Mutation and Patient Prognosis
To elucidate the role of APOE in human glioma, we first analyzed gene expression profiles using the GEPIA2 platform, which integrates TCGA and GTEx data. Comparison of glioma tumor tissues, including both lower-grade glioma (LGG) and glioblastoma multiforme (GBM), with matched normal tissues revealed that APOE is significantly upregulated in glioma (Figure 1A). To further validate this observation, we analyzed mRNA-Seq data from the Chinese Glioma Genome Atlas (CGGA). Consistently, APOE expression was significantly higher in glioma tissues compared to normal brain tissues (Figure 1B). Additionally, stratification of glioma samples by IDH mutation status showed that APOE expression was higher in IDH-mutant tumors than in their IDH-wildtype counterparts (Figure 1C).
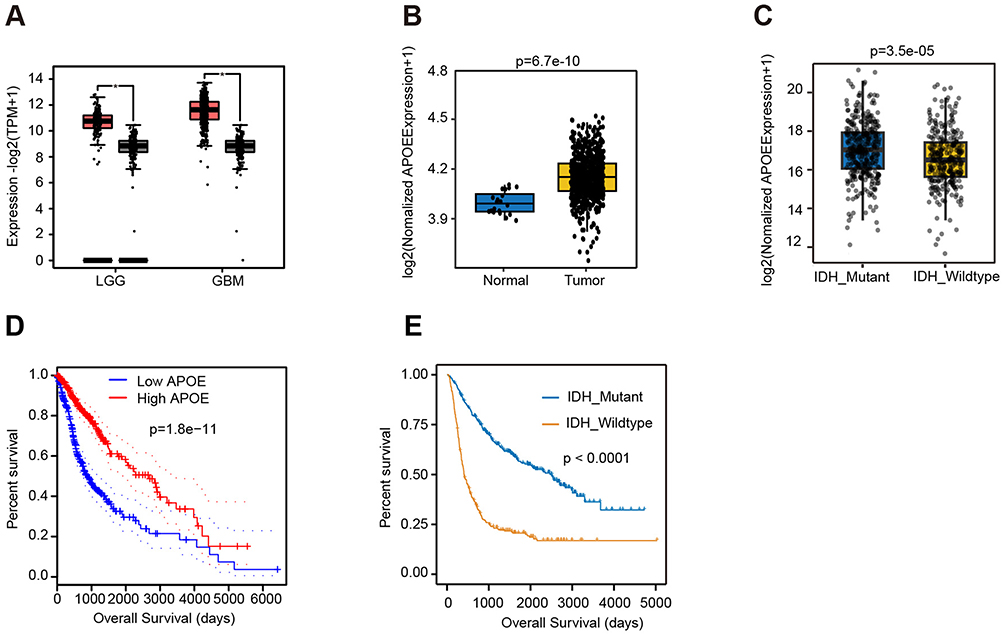 |
Figure 1 APOE expression and its clinical relevance in glioma. (A) APOE mRNA expression levels in tumor and non-tumor tissues of lower-grade glioma (LGG) and glioblastoma multiforme (GBM), analyzed using GEPIA2 database (red, tumor; black, non-tumor). (B) Comparison of APOE expression between glioma and normal brain tissues using CGGA RNA-Seq data (blue, normal; yellow, tumor). (C) APOE expression levels in glioma tissues stratified by IDH mutation status using CGGA data (blue, IDH_Mutant; yellow, IDH_Wildtype). (D) Kaplan-Meier overall survival curves of glioma patients with high versus low APOE expression based on GEPIA2 analysis. (E) Kaplan-Meier overall survival curves comparing IDH-mutant and IDH-wildtype glioma patients in the CGGA dataset. |
Next, we examined the prognostic significance of APOE expression. Kaplan-Meier survival analysis using GEPIA2 demonstrated that patients with high APOE expression exhibited significantly longer overall survival (OS) than those with low APOE expression (Figure 1D). This result was further validated using CGGA data, which also showed that IDH-mutant patients had significantly longer OS than those with IDH- wildtype gliomas (Figure 1E). Given the enrichment of APOE in IDH-mutant tumors, which are typically associated with better prognosis, this survival advantage may be partly attributable to IDH mutation status.
These findings indicate that APOE is upregulated in glioma tissues, particularly in IDH-mutant subtypes, and that higher APOE expression is associated with favorable prognosis. These results suggest that APOE may contributed to glioma development and progression, possibly in an IDH- dependent manner.
APOE Promotes Glioma Cell Line Growth
To investigate the function of APOE in glioma, we first examined its expression levels across multiple glioma cell lines using the CCLE database. U251MG and U87MG cells exhibited relatively low baseline APOE expression and were selected for further studies (Figure 2A). APOE was overexpressed in both cell lines, and successful overexpression was confirmed by Western blotting (Figure 2B). CCK-8 assays revealed significant increased cell viability in APOE-overexpressing cells compared to controls (Figure 2C). Consistently, EdU incorporation assays showed a higher proportion of proliferation cells in the APOE-overexpressing groups (Figure 2D), indicating enhanced proliferative capacity. To evaluate effects on cell motility, Transwell assays were performed. APOE overexpression markedly promoted both migration and invasion in glioma cells (Figure 2E).
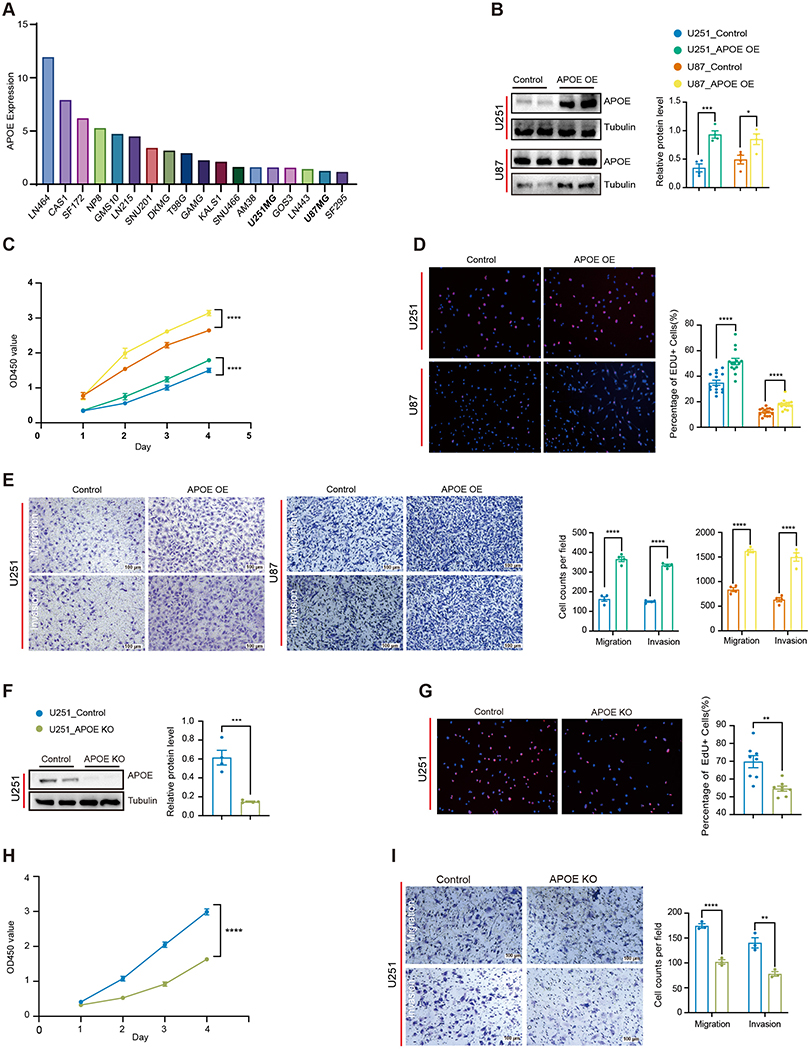 |
Figure 2 APOE promotes glioma cell proliferation, migration, and invasion. (A) Analysis of APOE expression levels across glioblastoma (GBM) cell lines using the Cancer Cell Line Encyclopedia (CCLE) database. (B) Western blotting validation of APOE overexpression in U251 and U87 cell lines, with densitometric quantification. Data are presented as mean ± SEM (n=4). Statistical significance was determined using an unpaired two-tailed t-test. (C) Cell viability assessment by the CCK-8 assay in U251and U87 cells over a 4-day period, with OD450 measured daily. Data are presented as mean ± SD (n=4). Statistical significance between control and APOE-overexpression cells across the entire observation period was determined using two-way ANOVA, with time and genotype as factors. (D) EdU incorporation assays evaluating the proportion of proliferating U251 and U87 cells, with quantification. Data are presented as mean ± SEM (U251, n=15; U87, n=16). Statistical significance was determined using an unpaired two-tailed t-test. (E) Quantification of cell migration and invasion in U251 and U87 cells using Transwell assays. Representative images and quantitative analyses of migrated and invaded cells are shown. Migration and invasion were quantified by counting cells that traversed the membrane and are presented as mean ± SEM from independent experiments (n=4). Statistical analysis was performed using unpaired two-tailed t tests with false discovery rate (FDR) correction for multiple comparisons. (F) Western blot analysis confirming APOE knockout in U251 cells, with densitometric quantification. Data are presented as mean ± SEM (n=4). Statistical significance was determined using an unpaired two-tailed t-test. (G) EdU incorporation assay assessing proliferation in APOE-knockout U251 cells, with quantification. Data are presented as mean ± SEM (n=8). Statistical significance was determined using an unpaired two-tailed t-test. (H) Cell viability assessed by the CCK-8 assay in APOE-knockout U251 cells over a 4-day period. Data are presented as mean ± SD (n=4). Statistical significance between control and APOE-knockout cells across the entire observation period was determined using two-way ANOVA, with time and genotype as factors. (I) Evaluation of migration and invasion in APOE-knockout U251 cells using Transwell assays. Representative images and quantitative analyses of migrated and invaded cells are shown. Migration and invasion were quantified by counting cells that traversed the membrane and are presented as mean ± SEM from independent experiments (n=3). Statistical analysis was performed using unpaired two-tailed t tests with false discovery rate (FDR) correction for multiple comparisons. (*P < 0.05, **P < 0.01, ***P < 0.001, ****P < 0.0001). |
To further confirm the oncogenic role of APOE, we generated APOE-knockout U251 cells using CRISPR-Cas9 with specific sgRNAs targeting the APOE gene. Efficient knockout was validated by Western blotting (Figure 2F). Loss of APOE led to a significant reduction in cell proliferation (Figure 2G and H), along with a marked decrease in both migratory and invasive capabilities (Figure 2I). Taken together, these findings demonstrate that APOE promotes glioma cell proliferation, migration and invasion. Highlighting its potential role as an oncogenic driver in glioma.
APOE Overexpression Promotes Nuclear Translocation and Activate the PI3K/AKT Pathway in Glioma Cells
A previous study in Alzheimer’s disease (AD) demonstrated that APOE ε4 can translocate into the nucleus, bind double-stranded DNA, and exhibits transcription factor-like activity.20 Based on this, we hypothesized that the pro-tumorigenic effects of APOE in glioma might also involve its nuclear translocation. To test this, we performed immunofluorescence staining in U251 cells overexpressing APOE. Compared to control cells, APOE-overexpression cells exhibited markedly increased APOE signal in both the nucleus and cytoplasm (Figure 3A). To validate these findings, we conducted subcellular fractionation followed by Western blot analysis. Consistent with immunofluorescence results, APOE protein levels were substantially elevated in both nucleus and the cytoplasm fractions of APOE-overexpression U251 cells (Figure 3B). Further, nuclear proteins were subjected to immunoprecipitation followed by SDS-PAGE and Coomassie blue staining. We observed an increased number of nuclear APOE-binding protein bands in the APOE-overexpression groups, suggesting potential transcriptional regulatory roles for APOE in the nucleus (Figure 3C).
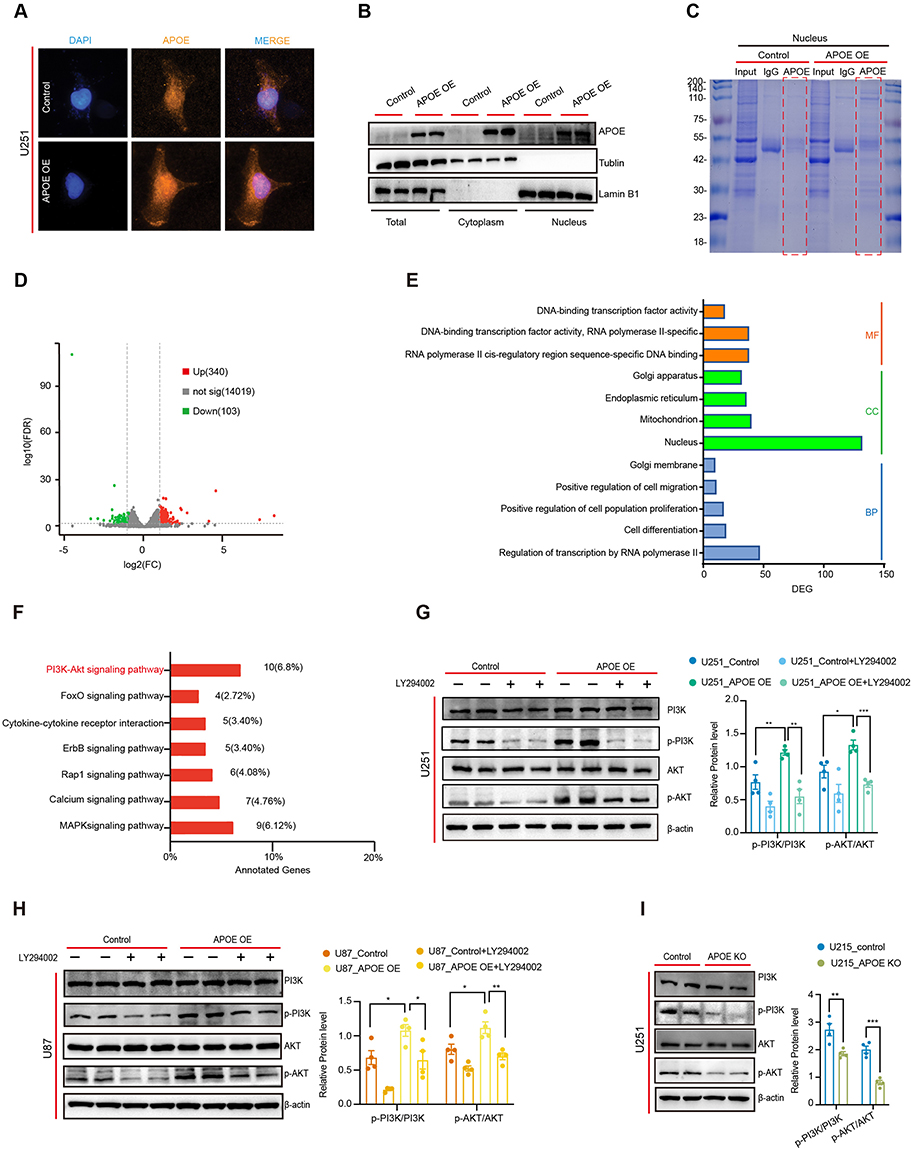 |
Figure 3 Nuclear translocation of APOE activates the PI3K/AKT signaling pathway in glioma cells. (A) Immunofluorescence staining showing the subcellular localization of APOE in U251 cells. (B) Western blot analysis of APOE protein in nuclear and cytoplasmic fractions of U251 cells. (C) Coomassie Brilliant Blue staining of immunoprecipitated APOE protein complexes in U251 cells. (D) Volcano plot showing differentially expressed genes (DEGs) in APOE-overexpressing U251 cells compared with control cells. A total of 443 DEGs were identified. (E) Gene Ontology (GO) enrichment analysis of the DEGs. (F) KEGG pathway enrichment analysis of the DEGs. (G) Western blot analysis and quantification of p-PI3K/PI3K and p-AKT/AKT ratios in APOE-overexpressing U251 cells treated with LY294002. Protein phosphorylation levels were quantified and analyzed using unpaired two-tailed t tests with false discovery rate (FDR) correction. Differences were considered statistically significant at q < 0.05. (H) Western blot analysis and quantification of p-PI3K/PI3K and p-AKT/AKT ratios in APOE-overexpressing U87 cells treated with LY294002. Protein phosphorylation levels were quantified and analyzed using unpaired two-tailed t tests with false discovery rate (FDR) correction. Differences were considered statistically significant at q < 0.05. (I) Western blot analysis and quantification of p-PI3K/PI3K and p-AKT/AKT ratios in APOE knockout U251 cells. Protein phosphorylation levels were quantified and analyzed using unpaired two-tailed t tests with false discovery rate (FDR) correction. Differences were considered statistically significant at q < 0.05. (*P < 0.05, **P < 0.01, ***P < 0.001). |
To investigate the downstream effects of APOE overexpression, we performed RNA sequencing to compare transcriptomic profiles between APOE-overexpression and control U251 cells. A total of 443 differentially expressed genes (DEGs) were identified, including 340 upregulated and 103 downregulated genes (Figure 3D). Gene Ontology (GO) enrichment analysis revealed that these DEGs were significantly associated with biological processes such as transcriptional regulation by RNA polymerase II, cell migration, cell proliferation, and cell differentiation. Enriched cellular components included the nucleus, mitochondria and endoplasmic reticulum, while enriched molecular functions involved DNA-binding transcription factor activity, DNA binding, and RNA polymerase II-specific activity (Figure 3E), supporting the notion that APOE enhances transcriptional activity.
KEGG pathway enrichment analysis of APOE-associated DEGs indicated significant enrichment in the PI3K/AKT signaling pathway (Figure 3F). To validate this association, we examined the phosphorylation status of PI3K and AKT in glioma cells with altered APOE expression. In U251 cells, APOE overexpression led to a significantly increase in the p-PI3K/PI3K and p-AKT/AKT ratios compared to control cells. Treatment with the PI3K inhibitor LY294002 effectively reduced phosphorylation of these proteins (Figure 3G). Similar results were observed in U87 cells, where APOE overexpression elevated p-PI3K/PI3K and p-AKT/AKT ratios, and LY294002 treatment effectively suppressed phosphorylation (Figure 3H). Conversely, APOE knockout in U251 cells significantly decreased p-PI3K/PI3K and p-AKT/AKT ratios relative to controls (Figure 3I). These data demonstrated that APOE overexpression in glioma cells promotes its nuclear translocation, enhances transcriptional activity, and activates the PI3K/AKT signaling pathway.
APOE Promotes Glioma Progression via Activation of the PI3K/AKT Pathway
To determine whether APOE promotes glioma progression through activation of the PI3K/AKT signaling pathway, we assessed whether pharmacological inhibition of PI3K could reverse the tumor-promoting effects of APOE overexpression. U251 glioma cells stably overexpressing APOE were treated with the PI3K inhibitor LY294002, and cell viability was measured using the CCK-8 assay. The results showed that APOE overexpression significantly enhanced cell viability compared to control cells; however, treatment with LY294002 effectively abolished this growth-promoting effect (Figure 4A), indicating that PI3K signaling is required for APOE-mediated glioma cell proliferation. To further evaluate whether APOE enhances glioma cell motility through PI3K/AKT signaling, we performed Tran swell invasion and wound healing assays in APOE-overexpressing U251 cells with or without LY294002 treatment. APOE overexpression led to increased invasion and migration, whereas PI3K inhibition efficiently reversed these effects (Figure 4B and C). Similar rescue effects were observed in U87 glioma cells, where LY294002 treatment significantly mitigated the APOE-induced increases in cell proliferation, invasion, and migration (Figure 4D and E).
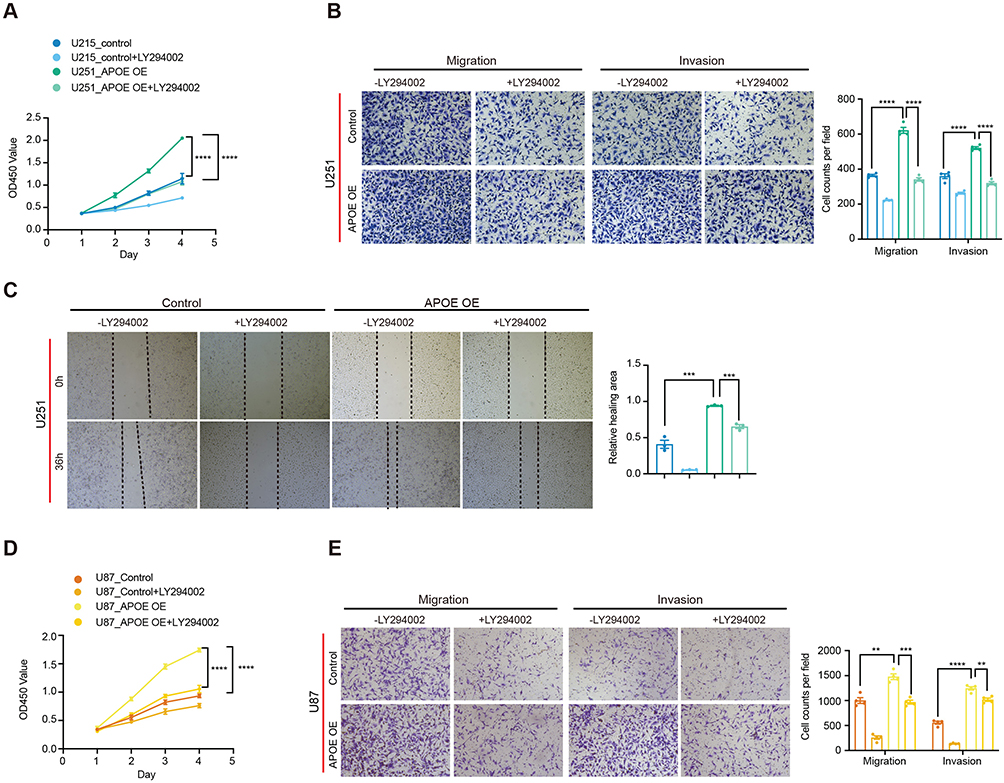 |
Figure 4 PI3K inhibition attenuates APOE-mediated proliferation and motility in glioma cells. (A) Cell viability of U251 cells stably overexpressing APOE or vector control following treatment with the PI3K inhibitor LY294002, assessed using the CCK-8 assay over a 4-day period, with OD450 measured daily. Data are presented as mean ± SD (n=3). Statistical significance between control and APOE-overexpressing cells across the entire observation period was determined using two-way ANOVA, with time and genotype as factors. (B) Transwell assays evaluating the migratory and invasive capacities of U251 cells with or without APOE overexpression and LY294002 treatment, with quantitative analysis. Representative images and quantification of migrated and invaded cells are shown. Migration and invasion were quantified by counting cells that traversed the membrane and are presented as mean ± SEM from independent experiments (n=4). Statistical analysis was performed using unpaired two-tailed t tests with false discovery rate (FDR) correction for multiple comparisons. (C) Wound healing assays assessing cell migration in U251 cells under the same experimental conditions as in (B), with quantitative analysis of relative wound closure area. Representative images and quantification are shown. Data are presented as mean ± SEM from independent experiments (n=3). Statistical significance was determined using unpaired two-tailed t tests. (D) Cell viability of U87 cells assessed by the CCK-8 assay following PI3K inhibition. Data are presented as mean ± SD (n=3). Statistical significance between control and APOE-overexpression cells across the entire observation period was determined using two-way ANOVA, with time and genotype as factors. (E) Transwell migration and invasion assays of U87 cells following PI3K inhibition, with quantitative analysis. Representative images and quantification of migrated and invaded cells are shown. Migration and invasion were quantified by counting cells that traversed the membrane and are presented as mean ± SEM from independent experiments (n=4). Statistical analysis was performed using unpaired two-tailed t tests with false discovery rate (FDR) correction for multiple comparisons. (**P < 0.01, ***P < 0.001, ****P < 0.0001). |
Collectively, these findings indicated that APOE promotes glioma progression, at least in part, by activating the PI3K/AKT signaling pathway and that pharmacological inhibition of PI3K can reverse these effects.
APOE Promotes Tumorigenicity and Proliferation in a Mouse Model
To validate the tumor-promoting role of APOE in vivo, we established a subcutaneous xenograft model using U251 glioma cells with differential APOE expression. Compared with the control group (U251_Control), the APOE-knockout group (U251_APOE KO) exhibited significantly reduced tumor volume and weight. In contrast, APOE-overexpressing group (U251_APOE OE) markedly increased tumor growth, as reflected by increased tumor volume and weight over a 56-day period. Notably, treatment with PI3K inhibitor LY294002 effectively suppressed tumor growth in the APOE-overexpression group without affecting mouse body weight (Figure 5A–D). Indicating that APOE-induced tumorigenicity is at least partially dependent on PI3K/AKT signaling.
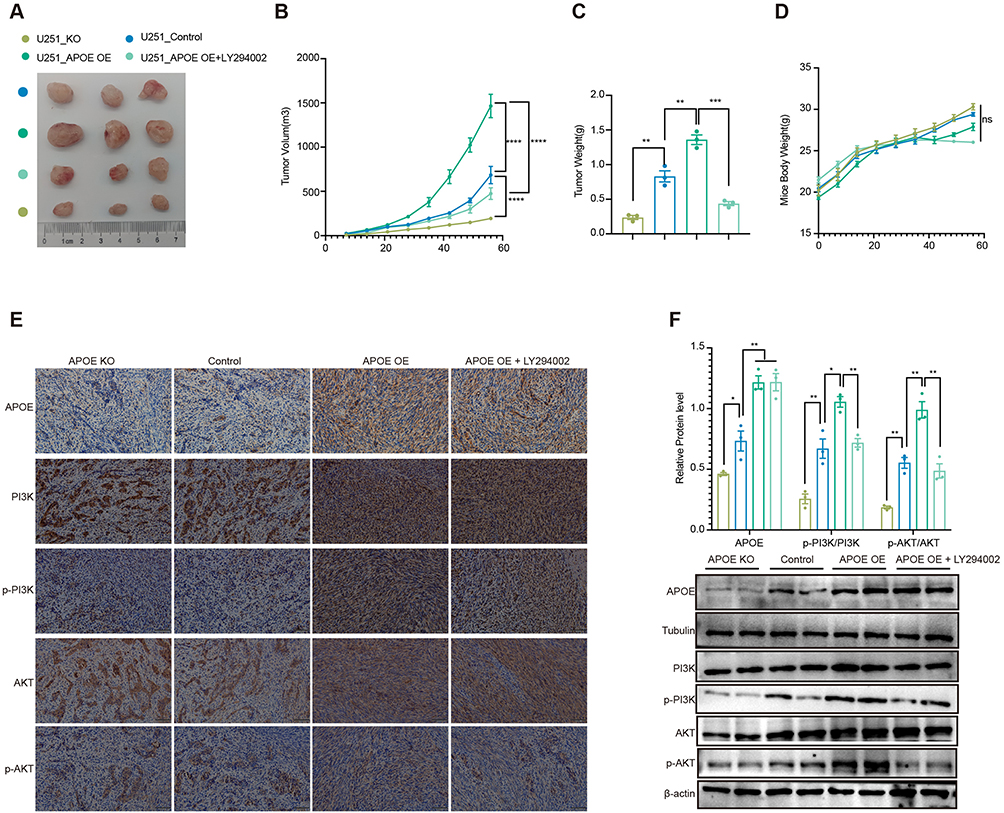 |
Figure 5 APOE promotes glioma growth in vivo through activation of the PI3K/AKT pathway. (A) Representative images of subcutaneous tumors formed in nude mice (n = 3 per group). (B) Tumor growth curves of U251 xenografts over a 56-day period. Tumor volumes were measured at the indicated time points in mice bearing U251 xenografts with APOE knockout (KO), control, APOE overexpression (APOE OE), or APOE OE treated with the PI3K inhibitor LY294002. Data are presented as mean ± SEM (n=3). Statistical significance was determined using two-way ANOVA, with time and treatment as factors. (C) Statistical comparison of tumor weights at the end of the 56-day experimental period. Data are presented as mean ± SEM (n=3). Statistical significance was determined using an unpaired two-tailed t test. (D) Body weight curves of nude mice over the 56-day experimental period. Data are presented as mean ± SEM (n=3). Statistical significance was determined using two-way ANOVA, with time and treatment as factors. (E) Immunohistochemical (IHC) staining of APOE, PI3K, p-PI3K, AKT, and p-AKT in subcutaneous tumor tissues. (F) Western blot analysis and quantification of APOE, PI3K, p-PI3K, AKT, and p-AKT expression levels in subcutaneous tumors from nude mice. APOE and protein phosphorylation levels were quantified and analyzed using unpaired two-tailed t tests with false discovery rate (FDR) correction. Differences were considered statistically significant at q < 0.05. (*P < 0.05, **P < 0.01, ***P < 0.001, ****P < 0.0001). |
To further investigate the molecular mechanism, we performed immunohistochemistry and Western blot analyses of tumor tissues. As expected, levels of phosphorylated PI3K (p-PI3K) and phosphorylated AKT (p-AKT) were significantly elevated in tumors derived from APOE-overexpression cells. In contrast, both the APOE-knockout and APOE-overexpressing + LY294002 groups showed reduced p-PI3K and p-AKT expression (Figure 5E and F). In conclusion, these in vivo findings support that APOE enhances glioma tumorigenicity and proliferation by activating the PI3K/AKT signaling pathway, and that inhibition of this pathway can effectively mitigate the tumor-promoting effects of APOE.
Discussion
The therapeutic outcomes of surgery, chemotherapy, and radiotherapy for glioma patients are suboptimal.29 In-depth investigations into the pathogenesis of gliomas are expected to provide theoretical guidance for disease treatment and may offer insights into the development of novel therapeutic strategies. APOE promotes cell growth by interacting with receptors involved in lipid metabolism and cellular signaling pathways, such as those in the low-density lipoprotein receptor (LDLR) family, which are often upregulated in cancer cells.30,31 In GBM, the levels of APOE in cerebrospinal fluid (CSF) are significantly elevated.32 Wei Huang et al also found that knocking down APOE affected macrophage polarization and immune evasion in glioma through the paracrine signaling of CCL5.18 However, the potential mechanisms underlying the effects of APOE in glioma have yet to be established.
The present study investigated the molecular mechanisms involved in the cancer-promoting effects of APOE in glioma cells. Bioinformatics analysis of public datasets revealed that APOE is expressed at higher levels in glioma tumor than in control brain tissue (Figure 1). Further research demonstrated that APOE promotes the growth, migration, and invasion of IDH-wildtype glioma cells (Figure 2). On the basis of our findings, APOE plays a context-dependent oncogenic role; while clinical datasets may show varied prognostic associations across pan-glioma cohorts, our data specifically underscore its potent tumor-promoting activity in the IDH-wildtype/GBM background. This is consistent with the literature published on various cancers.15,33–35 Consequently, APOE may serve as a biomarker for poor prognosis and a potential therapeutic target specifically for patients with IDH-wildtype GBM.
Studies have demonstrated that APOE ε4 undergoes proteolytic fragmentation, facilitating its translocation into the nucleus. Once inside the nucleus, APOE ε4 exhibits high-affinity DNA binding, targeting over 1,700 promoter regions.36 Both APOE ε4 and APOE ε3 isoforms have been shown to bind to the promoter of the apolipoprotein D (APOD) gene, acting as transcriptional repressors.37 Additionally, both isoforms can translocate to the nucleus and directly bind to the promoter region of SirT1, influencing gene expression pattern.36
In this study, we utilized IF staining and nuclear‒cytoplasmic separation followed by WB analysis to confirm that APOE is localized not only in the cytoplasm but also in the cell nucleus. Compared with that in the control group, the nuclear protein expression level of APOE in the overexpression group was significantly greater. Therefore, we hypothesize that APOE may perform certain functions within the nucleus, such as acting as a transcription factor. To explore this possibility, we subsequently performed IP to assess whether APOE interacts with nuclear proteins, providing preliminary evidence that APOE may function as a transcriptional regulator (Figure 3). This suggests that APOE plays a direct role in modulating gene expression. While the exact mechanisms by which APOE enters the nucleus remain to be elucidated, our findings highlight the potential role of APOE in nuclear processes and suggest that APOE may serve as a therapeutic target for gliomas. Future research should focus on unravelling the detailed mechanisms of APOE nuclear translocation and its functional implications in glioma biology.
Several studies have elucidated multiple mechanisms of PI3K function in gliomas.38–40
Our RNA-seq data revealed that APOE is associated with the PI3K/AKT signaling pathway in glioma (Figure 3). Further experiments in our study demonstrated that the activation of the PI3K/AKT signaling pathway in gliomas is associated with glioma progression. Additionally, treatment with the PI3K inhibitor LY294002 blocked the activation of the PI3K/AKT signaling pathway and subsequently resulted in decreased proliferation, invasion and migration in APOE-overexpressing glioma cells (U251 and U87) (Figure 4). Furthermore, in an in vivo mouse model, APOE-overexpression tumors exhibited significantly accelerated growth, which was markedly inhibited by LY294002 treatment through suppression of PI3K/AKT signaling pathway (Figure 5). Therefore, APOE may promote the malignant phenotypes of glioma cells by activating the PI3K/AKT signaling pathway. However, the specific mechanisms of activation have not been elucidated and warrant further in-depth investigation.
In conclusion, our recent findings indicate that APOE enhances the proliferation, invasion, and migration of IDH-wildtype GBM cells, with these malignant effects potentially mediated through the PI3K/AKT signaling pathway. Additionally, APOE can translocate to the nucleus and activate transcription, suggesting a further layer of involvement in glioma biology. This connection opens a promising research direction to explore how APOE may contribute to glioma progression, possibly through transcriptional activation or other mechanisms that influence the PI3K/AKT signaling pathway. Investigating the enrichment of PI3K/AKT signaling pathway-related genes coexpressed with APOE could offer valuable insights for the development of targeted therapies.
Animal Ethics Statement
All animal procedures followed the guidelines of the Institutional Animal Care and Use Committee (IACUC) of Anhui Medical University and were approved by the Animal Ethics Committee of Anhui Medical University (No. LLSC20231146). To ensure animal welfare, mice were monitored daily for signs of distress and were euthanized by CO2 inhalation followed by cervical dislocation at the end of the 56-day observation period.
AI-Assisted Writing Statement
During the preparation of this manuscript, the authors used artificial intelligence tools (including ChatGPT) for language editing, grammar refinement, and improvement of clarity and readability. The AI tools were not used to generate scientific content, analyze data, interpret results, or draw scientific conclusions. All authors reviewed and approved the final manuscript and take full responsibility for its content.
Abbreviations
APOE, Apolipoprotein E; PI3K/AKT signaling pathway, Phosphatidylinositol-3-kinase/Protein Kinase B pathway; GBM, Glioblastoma; LGG, Low-grade Glioma; TCGA, The Cancer Genome Atlas Program; GTEx, Genotype -Tissue Expression; CGGA, Chinese Glioma Genome Atlas; GEPIA, Gene Expression Profiling Interactive Analysis; CCLE, Cancer Cell Line Encyclopedia; KEGG, Kyoto Encyclopedia of Genes and Genomes; IDH, Isocitrate Dehydrogenase; U251_Control, Control U251 cell line; U251_APOE OE, APOE-overexpressing U251 cell line; U251_APOE KO, APOE-knockout U251 cell; U87_Control, Control U87 cell line; U87_APOE OE, APOE-overexpressing U87MG cell line; LY294002, Inhibitors of Phosphatidylinositol-3-kinase (PI3K); RNA-seq, RNA sequencing; DEGs, Differential expressed genes; DESeq2, Differential gene expression analysis based on the negative binomial distribution; OS, Overall survival; HR, Hazard ratios; CCK8, Cell Counting Kit-8 assay; EdU, 5-Ethynyl-2′-Deoxyuridine assay; IP, Immunoprecipitation; IF, Immunofluorescence; IHC, Immunohistochemistry; SDS-PAGE, Sodium dodecyl sulfate - polyacrylamide gel electrophoresis; NC, Nitrocellulose membrane.
Data Sharing Statement
The datasets generated and/or analyzed during the current study are available from the corresponding author upon reasonable request. The RNA sequencing data have been deposited in the NCBI BioProject database under accession number PRJNA1217886.
Ethics and Data Availability
The clinical data analyzed in this study were retrieved from the TCGA (via GEPIA2) and CGGA public databases. As these datasets are publicly accessible and contain de-identified information, this research was exempt from Institutional Review Board (IRB) approval and the requirement for patient informed consent.
Author Contributions
All authors made a significant contribution to the work reported, whether that is in the conception, study design, execution, acquisition of data, analysis and interpretation, or in all these areas; took part in drafting, revising or critically reviewing the article; gave final approval of the version to be published; have agreed on the journal to which the article has been submitted; and agree to be accountable for all aspects of the work.
Funding
This work was supported by the Basic and Clinical Research Improvement Program of Anhui Medical University (2023xkjT013) and the Natural Science Research Project of Anhui Provincial Department of Education (KJ2021A0218).
Disclosure
Dr Xiaohui Li reports grants from Anhui Medical University, grants from Anhui Provincial Department of Education, during the conduct of the study. The authors declare no competing interests.
References
1. Ostrom QT, Price M, Neff C, et al. CBTRUS statistical report: primary brain and other central nervous system tumors diagnosed in the United States in 2016—2020. Neuro-Oncol. 2023;25(Supplement_4):iv1–15. doi:10.1093/neuonc/noad149
2. Bush NAO, Chang SM, Berger MS. Current and future strategies for treatment of glioma. Neurosurg Rev. 2017;40(1):1–14. doi:10.1007/s10143-016-0709-8
3. Louis DN, Perry A, Wesseling P, et al. The 2021 WHO classification of tumors of the central nervous system: a summary. Neuro-Oncol. 2021;23(8):1231–1251. doi:10.1093/neuonc/noab106
4. Lang F, Yang C. Targeting cell cycle checkpoints for glioma therapy. Pharmacol Ther. 2025;275:108932. doi:10.1016/j.pharmthera.2025.108932
5. Sarkaria JN, Kitange GJ, James CD, et al. Mechanisms of chemoresistance to alkylating agents in malignant glioma. Clin Cancer Res. 2008;14(10):2900–2908. doi:10.1158/1078-0432.CCR-07-1719
6. Mas-Moruno C, Su B, Dalby MJ. Multifunctional coatings and nanotopographies: toward cell instructive and antibacterial implants. Adv Healthc Mater. 2019;8(1):1801103. doi:10.1002/adhm.201801103
7. Bernardi S, Marchetti E, Torge D, Simeone D, Macchiarelli G, Bianchi S. Ultrastructural assessment of human periodontal ligament fibroblast interaction with bovine pericardium membranes: an in vitro study. Histol Histopathol. 2025;40(8):1185–1194. doi:10.14670/HH-18-860
8. Wen PY, Weller M, Lee EQ, et al. Glioblastoma in adults: a Society for Neuro-Oncology (SNO) and European Society of Neuro-Oncology (EANO) consensus review on current management and future directions. Neuro-Oncol. 2020;22(8):1073–1113. doi:10.1093/neuonc/noaa106
9. Weller M, Wen PY, Chang SM, et al. Glioma. Nat Rev Dis Primer. 2024;10(1):33. doi:10.1038/s41572-024-00516-y
10. Jackson RJ, Hyman BT, Serrano-Pozo A. Multifaceted roles of APOE in Alzheimer disease. Nat Rev Neurol. 2024;20(8):457–474. doi:10.1038/s41582-024-00988-2
11. Li X, Zhang J, Li D, et al. Astrocytic ApoE reprograms neuronal cholesterol metabolism and histone-acetylation-mediated memory. Neuron. 2021;109(6):957–970.e8. doi:10.1016/j.neuron.2021.01.005
12. Liu J, Chen W, Tao X. Association between APOE polymorphisms and glioma risk. Int J Clin Exp Pathol. 2016;9(3):3962–3966.
13. Saadat M. Apolipoprotein E (APOE) polymorphisms and susceptibility to breast cancer: a meta-analysis. Cancer Res Treat off J Korean Cancer Assoc. 2012;44(2):121–126. doi:10.4143/crt.2012.44.2.121
14. Zheng P, Luo Q, Wang W, et al. Tumor-associated macrophages-derived exosomes promote the migration of gastric cancer cells by transfer of functional Apolipoprotein E. Cell Death Dis. 2018;9(4):434. doi:10.1038/s41419-018-0465-5
15. Chen YC, Pohl G, Wang TL, et al. Apolipoprotein E is required for cell proliferation and survival in ovarian cancer. Cancer Res. 2005;65(1):331–337. doi:10.1158/0008-5472.331.65.1
16. Nicoll JA, Zunarelli E, Rampling R, Murray LS, Papanastassiou V, Stewart J. Involvement of apolipoprotein E in glioblastoma: immunohistochemistry and clinical outcome. Neuroreport. 2003;14(15):1923–1926. doi:10.1097/00001756-200310270-00008
17. Chien TY, Chiang CS. Temporal and spatial dynamics of glial cells apolipoprotein E expression in astrocytoma microenvironment. Cancer Res. 2024;84(6_Supplement):289. doi:10.1158/1538-7445.AM2024-289
18. Huang W, Li W, Chen X, Xiang C, Luo K. APOE drives glioma progression by modulating CCL5/CCR5 signaling in the tumor microenvironment and inducing M2 macrophage polarization. Immunobiology. 2025;230(3):152895. doi:10.1016/j.imbio.2025.152895
19. Liu X, Chang Y, Long M, et al. ApoE Inhibits the Progression of Glioma by Activating Immune Function. J Cell Mol Med. 2025;29(13):e70697. doi:10.1111/jcmm.70697
20. Love JE, Day RJ, Gause JW, et al. Nuclear uptake of an amino-terminal fragment of apolipoprotein E4 promotes cell death and localizes within microglia of the Alzheimer’s disease brain. Int J Physiol Pathophysiol Pharmacol. 2017;9(2):40.
21. Kim WS, Elliott DA, Kockx M, et al. Analysis of apolipoprotein E nuclear localization using green fluorescent protein and biotinylation approaches. Biochem J. 2008;409(3):701–709. doi:10.1042/BJ20071261
22. Langhans J, Schneele L, Trenkler N, et al. The effects of PI3K-mediated signalling on glioblastoma cell behaviour. Oncogenesis. 2017;6(11):398. doi:10.1038/s41389-017-0004-8
23. He Y, Sun MM, Zhang GG, et al. Targeting PI3K/Akt signal transduction for cancer therapy. Signal Transduct Target Ther. 2021;6(1):425.
24. Vanhaesebroeck B, Guillermet-Guibert J, Graupera M, Bilanges B. The emerging mechanisms of isoform-specific PI3K signalling. Nat Rev Mol Cell Biol. 2010;11(5):329–341. doi:10.1038/nrm2882
25. Alzahrani AS. PI3K/Akt/mTOR inhibitors in cancer: at the bench and bedside. Semin Cancer Biol. 2019;59:125–132. doi:10.1016/j.semcancer.2019.07.009
26. Zając A, Sumorek-Wiadro J, Maciejczyk A, et al. LY294002 and sorafenib as inhibitors of intracellular survival pathways in the elimination of human glioma cells by programmed cell death. Cell Tissue Res. 2021;386(1):17. doi:10.1007/s00441-021-03481-0
27. Zając A, Maciejczyk A, Sumorek-Wiadro J, et al. The role of Bcl-2 and Beclin-1 complex in “switching” between apoptosis and autophagy in human glioma cells upon LY294002 and sorafenib treatment. Cells. 2023;12(23):2670. doi:10.3390/cells12232670
28. Zhao Z, Zhang KN, Wang Q, et al. Chinese Glioma Genome Atlas (CGGA): a comprehensive resource with functional genomic data from Chinese glioma patients. Genomics Proteomics Bioinf. 2021;19(1):1–12. doi:10.1016/j.gpb.2020.10.005
29. Thenuwara G, Curtin J, Tian F. Advances in diagnostic tools and therapeutic approaches for gliomas: a comprehensive review. Sensors. 2023;23(24):9842. doi:10.3390/s23249842
30. Zhang J, Chen J, Wo D, et al. Physical and functional interactions between LDLR family members and CXCR4 in breast cancer. FEBS J. 2025;292:4580–4590. doi:10.1111/febs.70016
31. He L, Shi M, Ren S, et al. Jun-APOE-LRP1 axis promotes tumor metastasis in colorectal cancer. Biomol Biomed. 2023;23(6):1026. doi:10.17305/bb.2023.9248
32. Ghantasala S, Pai MGJ, Biswas D, et al. Multiple reaction monitoring-based targeted assays for the validation of protein biomarkers in brain tumors. Front Oncol. 2021;11:548243. doi:10.3389/fonc.2021.548243
33. Liu C, Xie J, Lin B, et al. Pan-cancer single-cell and spatial-resolved profiling reveals the immunosuppressive role of APOE+ macrophages in immune checkpoint inhibitor therapy. Adv Sci. 2024;11(23):2401061. doi:10.1002/advs.202401061
34. Bancaro N, Calì B, Troiani M, et al. Apolipoprotein E induces pathogenic senescent-like myeloid cells in prostate cancer. Cancer Cell. 2023;41(3):602–619. doi:10.1016/j.ccell.2023.02.004
35. Kemp SB, Carpenter ES, Steele NG, et al. Apolipoprotein E promotes immune suppression in pancreatic cancer through NF-κB–mediated production of CXCL1. Cancer Res. 2021;81(16):4305–4318. doi:10.1158/0008-5472.CAN-20-3929
36. Theendakara V, Peters-Libeu CA, Spilman P, Poksay KS, Bredesen DE, Rao RV. Direct transcriptional effects of Apolipoprotein E. J Neurosci. 2016;36(3):685. doi:10.1523/JNEUROSCI.3562-15.2016
37. Levros JLC, Labrie M, Charfi C, Rassart E. Binding and repressive activities of apolipoprotein E3 and E4 isoforms on the human ApoD promoter. Mol Neurobiol. 2013;48(3):669–680. doi:10.1007/s12035-013-8456-0
38. Mu Q, Wang L, Yu F, et al. Imp2 regulates GBM progression by activating IGF2/PI3K/Akt pathway. Cancer Biol Ther. 2015;16(4):623–633. doi:10.1080/15384047.2015.1019185
39. Kleber S, Sancho-Martinez I, Wiestler B, et al. Yes and PI3K bind CD95 to signal invasion of glioblastoma. Cancer Cell. 2008;13(3):235–248. doi:10.1016/j.ccr.2008.02.003
40. Fu H, Wu S, Shen H, et al. Dihydroartemisinin inhibits EphA2/PI3K/Akt pathway-mediated malignant behaviors and vasculogenic mimicry in glioma stem cells. Heliyon. 2025;11(3):e42095. doi:10.1016/j.heliyon.2025.e42095
 © 2026 The Author(s). This work is published and licensed by Dove Medical Press Limited. The
full terms of this license are available at https://www.dovepress.com/terms
and incorporate the Creative Commons Attribution
- Non Commercial (unported, 4.0) License.
By accessing the work you hereby accept the Terms. Non-commercial uses of the work are permitted
without any further permission from Dove Medical Press Limited, provided the work is properly
attributed. For permission for commercial use of this work, please see paragraphs 4.2 and 5 of our Terms.
© 2026 The Author(s). This work is published and licensed by Dove Medical Press Limited. The
full terms of this license are available at https://www.dovepress.com/terms
and incorporate the Creative Commons Attribution
- Non Commercial (unported, 4.0) License.
By accessing the work you hereby accept the Terms. Non-commercial uses of the work are permitted
without any further permission from Dove Medical Press Limited, provided the work is properly
attributed. For permission for commercial use of this work, please see paragraphs 4.2 and 5 of our Terms.