Back to Journals » Drug Design, Development and Therapy » Volume 11
Anticancer and anti-inflammatory activities of girinimbine isolated from Murraya koenigii
Authors Iman V, Mohan S, Abdelwahab SI, Karimian H, Nordin N, Fadaeinasab M, Noordin MI, Noor SM
Received 22 June 2016
Accepted for publication 16 August 2016
Published 28 December 2016 Volume 2017:11 Pages 103—121
DOI https://doi.org/10.2147/DDDT.S115135
Checked for plagiarism Yes
Review by Single anonymous peer review
Peer reviewer comments 3
Editor who approved publication: Prof. Dr. Wei Duan
Venoos Iman,1 Syam Mohan,2 Siddig Ibrahim Abdelwahab,2 Hamed Karimian,1 Noraziah Nordin,1 Mehran Fadaeinasab,3 Mohamad Ibrahim Noordin,1 Suzita Mohd Noor4
1Department of Pharmacy, Faculty of Medicine, University of Malaya, Kuala Lumpur, Malaysia; 2Medical Research Center, Jazan University, Jazan, Saudi Arabia; 3Department of Chemistry, 4Department of Biomedical Science, Faculty of Medicine, University of Malaya, Kuala Lumpur, Malaysia
Abstract: Therapy that directly targets apoptosis and/or inflammation could be highly effective for the treatment of cancer. Murraya koenigii is an edible herb that has been traditionally used for cancer treatment as well as inflammation. Here, we describe that girinimbine, a carbazole alkaloid isolated from M. koenigii, induced apoptosis and inhibited inflammation in vitro as well as in vivo. Induction of apoptosis in human colon cancer cells (HT-29) by girinimbine revealed decreased cell viability in HT-29, whereas there was no cytotoxic effect on normal colon cells. Changes in mitochondrial membrane potential, nuclear condensation, cell permeability, and cytochrome c translocation in girinimbine-treated HT-29 cells demonstrated involvement of mitochondria in apoptosis. Early-phase apoptosis was shown in both acridine orange/propidium iodide and annexin V results. Girinimbine treatment also resulted in an induction of G0/G1 phase arrest which was further corroborated with the upregulation of two cyclin-dependent kinase proteins, p21 and p27. Girinimbine treatment activated apoptosis through the intrinsic pathway by activation of caspases 3 and 9 as well as cleaved caspases 3 and 9 which ended by triggering the execution pathway. Moreover, apoptosis was confirmed by downregulation of Bcl-2 and upregulation of Bax in girinimbine-treated cells. In addition, the key tumor suppressor protein, p53, was seen to be considerably upregulated upon girinimbine treatment. Induction of apoptosis by girinimbine was also evidenced in vivo in zebrafish embryos, with results demonstrating significant distribution of apoptotic cells in embryos after a 24-hour treatment period. Meanwhile, anti-inflammatory action was evidenced by the significant dose-dependent girinimbine inhibition of nitric oxide production in lipopolysaccharide/interferon-gamma-induced cells along with significant inhibition of nuclear factor-kappa B translocation from the cytoplasm to nucleus in stimulated RAW 264.7 cells. Girinimbine was also shown to have considerable antioxidant activity whereby 20 µg/mL of girinimbine was equivalent to 82.17±1.88 µM of Trolox. In mice with carrageenan-induced peritonitis, oral pretreatment with girinimbine helped limit total leukocyte migration (mainly of neutrophils), and reduced pro-inflammatory cytokine levels (interleukin-1beta and tumor necrosis factor-alpha) in the peritoneal fluid. These findings strongly suggest that girinimbine could act as a chemopreventive and/or chemotherapeutic agent by inducing apoptosis while suppressing inflammation. There is a potential for girinimbine to be further investigated for its applicability in treating early stages of cancer.
Keywords: carbazole alkaloid, apoptosis, inflammation, chemopreventive, chemotherapeutic
Introduction
Nearly a million new cases of colorectal cancers are diagnosed annually, making it the third most common malignancy in men and the second most common among women. Despite advances in cancer therapy, it remains the fourth most common cause of cancer mortality worldwide.1 Among colorectal cancer patients, only ~20% have a familial basis; environmental factors, food-borne mutagens, intestinal commensals, and inflammatory bowel disease, which lead to tumor development, are among the known predisposing risk factors for colorectal cancer.2,3
Among the most important advances in cancer research in the past decade is the recognition of the profound role of apoptosis and inflammation in malignant phenotypes.4 Apoptosis is of significant concern because cancer cells act not only by hijacking normal cell growth patterns but also by evading cellular death pathways. This gained resistance to apoptosis is the hallmark of many cancers.5 Identification of apoptotic triggers provides a conceptual framework for various cancer treatments, including for colon cancer.
Meanwhile, inflammation is a necessary and crucial immune defense system response.4 However, recent evidence has shown that inflammation could trigger mechanisms that lead to cancer. Underlying infections and inflammatory responses are associated with 25% of all cancer cases,6 and there is a well-known association between inflammation and colorectal cancer.7
At present, standard treatment strategies for most cancers, especially for relapses and metastases, are surgical tumor resection and chemotherapy.8 Major drawbacks of chemotherapy include occurrence of side effects from the nonspecific targeting of both normal and cancerous cells, and the emergence of multidrug resistance in cancer cells.9 In addition, conventional anti-inflammatory drugs have not been effective for treatment of chronic inflammatory disorders which might lead to cancer development due to the damaging side effects to the body which occur with long-term consumption.10 Based on these concerns, there has been growing interest in the use of natural molecules with chemotherapeutic, chemopreventive, and anti-inflammatory effects in cancer therapy.11
Plants have played an essential role as anticancer agents.12 Murraya koenigii (curry tree) is a widely used edible herb in traditional medicine. It belongs to the citrus family, Rutaceae, and is native to parts of Asia including India and Sri Lanka.13 This tonic plant has long been used for various disease conditions,14 and has been reported to have a potential role as a remedy for cancer15 and inflammation.16 Previous reports showed that carbazole alkaloids, the main compounds isolated from the plant, possess cytotoxic17 and antitumor activity,13 and a few have already entered into clinical trials.18
Girinimbine, one of the first M. koenigii carbazole alkaloids to be isolated and identified,19 has been shown to have antitumor effects involving free radical scavenging and apoptosis.20 Moreover, it has demonstrated significant antiplatelet activity through inhibition of cyclooxygenase21 and also exhibited antitrichonomal,15 antibacterial,22 antiangiogenic,23 and antitumor activities.24 The current study was intended to add to the body of knowledge by exploring girinimbine’s potential in cancer therapy, particularly colorectal cancer, via induction of apoptosis and inhibition of inflammation in vitro and in vivo.
Materials and methods
Plant material
The girinimbine used in this research was kindly provided by Professor Dr Mohamed Aspollah Sukari, from Universiti Putra Malaysia, Serdang, Malaysia. Methods of extraction and analyzing spectroscopic data were based on Bakar et al.16 Stock solution of girinimbine was 10 mg/mL in dimethyl sulfoxide (DMSO). The final concentration of DMSO was 0.1% (v/v), which was also the concentration used for vehicle controls.
Reagents
Chemicals used in this research were obtained from Sigma-Aldrich Co. (St Louis, MO, USA), Thermo Fisher Scientific (Waltham, MA, USA), BD Biosciences (San Jose, CA, USA), ScienCell (Carlsbad, CA, USA), and Santa Cruz Biotechnology Inc. (Dallas, TX, USA).
Cell culture
Cell lines of human colon cancer cells (HT 29), human colon normal cells (CCD-18Co), and murine monocyte macrophage cells (RAW 264.7) were all obtained from American Type Culture Collection (ATCC) (Manassas, VA, USA). HT-29 cells were cultured in Rosewell Park Memorial Institute-1640 media supplemented with 10% fetal bovine serum and 1% penicillin/streptomycin. Cells were grown in humidified conditions at 37°C with 5% CO2. CCD-18Co and RAW 264.7 cells were cultured in Dulbecco’s Modified Eagle’s Medium (DMEM) with similar supplementation and growth conditions as HT-29 cells. In addition, 4.5 g/L glucose, sodium pyruvate (1 mM), and L-glutamine (2 mM) were supplemented to DMEM for RAW 264.7 cell growth.
Cell viability assay
The antiproliferative activity of girinimbine was evaluated by MTT assay. HT-29, CCD-18Co, and RAW 264.7 were seeded in 96-well plates at a density of 2.6×10⁴ cells/well and cultured for 24 hours at 37°C. Various concentrations of girinimbine were added and incubated at three different time points – 12, 24, and 48 hours. In the next step, MTT solution (20 μL) was added and incubated for another 4 hours, following which formed formazan crystals were dissolved by adding 100 μL of DMSO. Absorbance was measured at 570 nm using a microplate reader (Hidex, Turku, Finland). IC50 values were measured as the concentration of girinimbine which decreased the absorbance of the treated cells up to 50% of that of the control cells (DMSO treated). Cell viability was calculated as the percentage of viable girinimbine-treated cells compared to vehicle-treated controls (100%) of three independent experiments.
Apoptosis assays on HT-29 cells
Dual-staining assay (AO/PI)
Morphological changes in treated HT-29 cells were characterized using an acridine orange (AO) and propidium iodide (PI) double-staining assay. HT-29 cells were cultured in a 25 cm2 flask and incubated for 24 hours. Then, cells were treated with IC50 concentration of girinimbine for 12, 24, and 48 hours. After incubation, treated and untreated cells were harvested and washed twice with phosphate-buffered saline (PBS). The cells were stained with 5 μL of AO (1 mg/mL) and 5 μL of PI (1 mg/mL). Within 30 minutes, the stained cells were analyzed under a UV-fluorescent microscope (Olympus BX51; Olympus Corporation, Tokyo, Japan).
Multiple cytotoxicity assay
To assess changes in mitochondrial membrane potential (MMP), nuclear intensity, cell membrane permeability, and cytochrome c release, multiple cytotoxicity assays were carried out using the Cellomics® Multiparameter Cytotoxicity 3 kit (Thermo Fisher Scientific) as described by Lövborg et al.25 This kit provided simultaneous measurements of the abovementioned apoptotic parameters in a single cell. In brief, HT-29 cells were seeded in 96-well plates at a density of 2.6×10⁴ cells/well and incubated for 24 hours. The cells were then treated with girinimbine at the 1C50 concentration for 24 hours. After incubation, cells were stained, fixed, and analyzed using the CellReporter™ Molecular Device (Molecular Devices LLC, Sunnyvale, CA, USA).
Cell cycle analysis
The cell cycle assay was done by flow cytometry. HT-29 cells were treated with girinimbine for 12, 24, and 48 hours in Rosewell Park Memorial Institute-1640 media with 10% fetal bovine serum. After collecting with trypsin–ethylenediaminetetraacetic acid solution (Sigma-Aldrich Co.), cells were fixed with 70% ethanol and incubated at 20°C for 30 minutes. Cells were then stained with 1 mL of PI staining solution (20 μg/mL PI in the presence of RNase-A) for 30 minutes on ice in the dark. Samples were analyzed using the BD FACSCanto™ II flow cytometer (BD Biosciences). The Cell Fit Cell analysis program (Becton Dickinson Immunocytometry Systems, NJ, USA) was used to analyze data from 10,000 cells per sample.
Annexin V assay
The annexin V-fluorescein isothiocyanate (FITC) assay can detect plasma membrane alterations, such as phosphatidylserine (PS) externalization during the early stages of apoptosis. The assay was performed using an Annexin V-FITC Apoptosis Detection kit I (BD Pharmingen Inc., San Diego, CA, USA). In brief, cells (2×10⁵ cells/well) were seeded into a six-well plate and exposed to the compound for 12, 24, and 48 hours. Cells were harvested and washed twice with PBS and resuspended in the annexin V binding buffer. The cells were then stained with annexin V-FITC and PI, according to the manufacturer instructions. The flow cytometric analysis was performed using a BD FACSCanto II flow cytometer (BD Biosciences). This was followed by quadrant statistics analysis for the detection of early and late apoptotic cells and necrotic cells.
Caspase analysis
Girinimbine’s effect on activation of caspases 3/7 and 9 was evaluated by Caspase-Glo® 7 and 9 assays (Promega Corporation, Fitchburg, WI, USA). In brief, HT-29 cells were treated with girinimbine at five different time points – 3, 6, 12, 24, and 48 hours. Following the treatment, 50 μL of Caspase-Glo reagents were added to the treated and untreated HT-29 cells (vehicle control) and incubated at 25°C for 30 minutes in the dark. Luminescence microplate reader (Infinite M200PRO; Tecan, Männedorf, Switzerland) was used to measure the induced activation of tested caspases.
Western blot analysis
Western blot was done according to the protocol described by Kurien and Scofield.26 Total proteins were extracted from cells using Pierce cell lysis buffer (Pierce Biotechnology, Rockford, IL, USA) according to the kit instructions. Protein concentrations were calculated using the Bradford method (Bio-Rad Laboratories Inc., Hercules, CA, USA). Of the total protein, 40 μg/mL was fractionated on sodium dodecyl sulfate polyacrylamide gel electrophoresis (10%) and subsequently transferred to a polyvinylidene flouride membrane (Bio-Rad Laboratories Inc.). After blocking with casein for 1 hour, the membrane was washed with Tris-buffered saline/Tween-20 (20 mM Tris, 150 mM NaCl, and 0.1% Tween-20) and incubated with 1:10,000-diluted specific primary antibodies Bax (Cat: sc-493), Bcl-2 (Cat: sc-492), caspase 9 (Cat: sc-7885), caspase 3 (Cat: sc-7148), cleaved caspase 9 (Cat: sc-22182), cleaved caspase 3 (Cat: sc-22171R), p21 (Cat: sc-397), p27 (Cat: sc-528), p53 (Cat: sc-126), and β-actin (Cat: sc-7210) (Santa Cruz Biotechnology Inc.) overnight. Following incubation, the cells were washed with Tris-buffered saline/Tween-20 and subsequently incubated with a peroxidase-coupled anti-rabbit secondary antibody (Santa Cruz Biotechnology Inc.) for 1 hour. The membrane was then exposed, and the Gel Doc 1000 Documentation System (Bio-Rad Laboratories Inc.) was used to detect protein bands, while quantification of bands was done using ImageJ 1.32 software (National Institutes of Health, Bethesda, MD, USA).
In vivo apoptosis assay
Zebrafish model
All animal experimental procedures were done following approval from the Faculty of Medicine Institutional Animal Care and Use Committee, University of Malaya (ethics number: 2013-05-07/FAR/R/VI), and the animal care and use guidelines of this committee were followed. Adult zebrafish were maintained in a recirculating aquaculture tank (Zebtec; Tecniplast, Buguggiate, Italy) at 28°C with 14-/10-hour day/night light cycle. Embryos were obtained by natural spawning of adult zebrafish (4–8 months old). One hundred and eighty healthy embryos were selected at 24 hours postfertilization (hpf) and dechorionated manually. Embryos were then treated by incubating them in system water containing 20 μg/mL girinimbine for 24 hours. DMSO (1%) was used as negative control. Following 24-hour exposure, embryos were returned to system water for another 24 hours and monitored up to 72 hpf by stereomicroscopy (Olympus SZX10; Olympus Corporation) for viability and developmental abnormalities.
AO staining
AO is a nucleic acid-selective metachromatic dye applicable for studying apoptosis patterns.27 Embryos at 48 and 72 hpf were incubated in AO solution (1 μg of AO powder in 1 mL of embryo water) for 30–45 minutes in the dark and then washed with embryo water for 1 minute. Stained embryos were observed under a UV-fluorescence microscope using FITC filter (Olympus BX51; Olympus Corporation) within 30 minutes before the fluorescence faded. ImageJ 1.32 software (National Institutes of Health) was used to analyze images.
TUNEL assay
Detection of apoptotic cells was evaluated by TdT-DAB In Situ Apoptosis Detection Kit (Trevigen, Gaithersburg, MD, USA) according to the manufacturer instructions. Briefly, 48 and 72 hpf embryos were fixed in 4% paraformaldehyde/1X PBS at 4°C overnight. Fixed embryos were dehydrated sequentially in 50%, 75%, and 100% ethanol prior to rehydration by placing in 100%, 95%, 70%, and 50% ethanol solution, and then washed in 1X PBS for 10 minutes. Fifty microliters of Proteinase K solution was added and incubated for 30 minutes. After washing twice in deionized water, embryos were immersed in quenching solution for 5 minutes. Embryos were then washed in 1X PBS followed by the addition of 1X terminal deoxynucleotidyl transferase-labeling buffer for 5 minutes. Next, 50 μL of labeling reaction mix solution was added, and embryos were incubated for 60 minutes at 37°C. Labeling reaction was stopped by adding 1X terminal deoxynucleotidyl transferase stop buffer, and embryos were covered with 50 μL of streptavidin–horse radish peroxidase solution and incubated for 10 minutes at 37°C. Embryos were then washed twice in 1X PBS, after which diaminobenzidine solution was added for 5 minutes. Embryos were then washed in deionized H2O and observed under a stereomicroscope (Olympus SZX10; Olympus Corporation) to visualize apoptotic cells. WimTUNEL Image Analyser software (Wimasis GmbH, Munich, Germany) was used for data analysis.
Measurement of nitric oxide in RAW 264.7 cells
Stimulation of cells
RAW 264.7 cells were used to study nitric oxide (NO) production using Griess assay. A total of 4×10⁵ cells/well were seeded into 96-well plates and stimulated with 100 U/mL of interferon-gamma (IFN-γ) and 5 μg/mL of lipopolysaccharide (LPS) in the presence of girinimbine. RAW 264.7 control cells received the same stimulation except for the girinimbine treatment. DMSO was used as vehicle. Cells were incubated at 37°C in the presence of 5% CO2 for 20 hours after which the supernatant was subjected to Griess assay.
Griess assay
The effect of girinimbine on NO production was evaluated by assaying the culture supernatant using the Griess reaction as described by Granger et al.28 In brief, an equal volume of Griess reagent (1% sulfanilamide and 0.1% N-(l-naphthyl)-ethylene diamine dihydrochloride, dissolved in 2.5% H3PO4) was added to culture supernatant, and color development was read at 550 nm using a microplate reader (SpectraMax Plus; Molecular Devices LLC). NO inhibitory percentage was calculated using the following formula:
|
|

NF-κB translocation assay
RAW 264.7 cells were cultured in 96-well plates at a density of 5×10³ cells/well and pretreated with girinimbine for 24 hours. Following the pretreatment, RAW 264.7 cells were stimulated with LPS (10 ng/mL) for 30 minutes. Control wells received similar treatment conditions expect for girinimbine pretreatment. The cells were then stained using a Cellomics NF-κB activation kit (Thermo Fisher Scientific) according to the kit instructions. RAW 264.7 plates were evaluated on the ArrayScan HCS Reader (Cellomics; Thermo Fisher Scientific). Ratios of cytoplasmic and nuclear factor-kappa B (NF-κB) intensity29 (average intensity of 200 cells/well) were calculated by Cytoplasm to Nucleus Translocation BioApplication software (Cellomics, Inc, Pittsburgh, PA, USA).
ORAC assay
The oxygen radical absorbance capacity (ORAC) assay was performed to assess the antioxidant capacity of girinimbine, according to procedures described earlier.30 A fluorescence spectrophotometer (LS 55; PerkinElmer Inc., Waltham, MA, USA) equipped with an automatic thermostatic autocell-holder at 37°C was used to collect data. Results were obtained by comparing the differences of areas under the fluorescein decay curve between the sample and blank. The final values were expressed as Trolox equivalents.
In vivo inflammation assay
Ethics statement
All animal experimental procedures were done following approval from the Faculty of Medicine Institutional Animal Care and Use Committee, University of Malaya (ethics number: 2013-11-12/PHARM/R/VI). Male ICR mice (25–35 g) were obtained from and housed in the Association for Assessment and Accreditation of Laboratory Animal Care-accredited Animal Experimental Unit, Faculty of Medicine, University of Malaya, Kuala Lumpur, Malaysia, before the experimental period. Mice were acclimatized to the laboratory setting 1 hour prior to the study. The number of mice and the intensity of toxic stimuli used were the minimum necessary to exhibit consistent effects of girinimbine treatment, and mice were used only once throughout the experiments.
Assessment of peritoneal capillary permeability and peritoneal leukocyte counts
Peritonitis was induced in mice using carrageenan according to procedures described by Montanher et al.31 In brief, Evans blue dye (25 mg/kg) was injected intravenously into the tail vein. After 30 minutes, mice were orally fed with different concentrations of girinimbine (10, 30, and 100 mg/kg, intragastric gavage [ig]), dexamethasone (0.5 mg/kg, ig, positive control), or sodium chloride (10 mL/kg, ig, negative control). Following 1 hour of either girinimbine or control treatment, mice were intraperitoneally (ip) injected with 0.5 mL of carrageenan (750 μg per cavity) to induce peritonitis. After an additional 4 hours, mice were sacrificed by CO2 asphyxiation and dissected. Peritoneal cavities were washed with 1 mL of cold sterile saline (NaCl 0.9%) and heparin (25 UI/mL) to collect the peritoneal fluid required for total leukocyte and neutrophil counts and determination of cytokine levels (interleukin-1beta [IL-1β] and tumor necrosis factor-alpha [TNF-α]). Peritoneal fluid was centrifuged, and the absorbance of the supernatant was measured at 620 nm on an ELISA analyzer (Boehringer Mannheim Inc, Indianapolis, IN, USA). The permeability of peritoneal capillaries was expressed in terms of the amount of dye (μg/mL) which leaked into the peritoneal cavity, according to the Evans blue dye standard curve.32
Statistical analysis
Results were subjected to one-way analysis of variance, calculated on GraphPad Prism version 6.0 (GraphPad Software, Inc., La Jolla, CA, USA) and SPSS Statistic 20 (IBM Corporation, Armonk, NY, USA). In addition, Dunnett’s test was applied as a post hoc test. Statistical significance is expressed as *P<0.05 according to the table of Dunnett’s tests.
Results
Girinimbine inhibits HT-29 proliferation but has no effect on normal cells
Cell viability and proliferation were assessed by MTT assay, measuring cell metabolic activity. In order to rule out the possibility of nonselective cytotoxic effects, HT-29, RAW 264.7, and CCD-18Co cells were treated with girinimbine in parallel. We performed the treatments on HT-29 and CCD-18Co with seven concentrations of girinimbine ranging between 1.5 and 100 μg/mL for 12, 24, and 48 hours. Girinimbine was shown to significantly inhibit the proliferation of HT-29 cells at 24 hours in a dose-dependent manner with an IC50 value of 4.79±0.74 μg/mL. In contrast, there was no significant antiproliferative effect on CCD-18Co cells, which still continued to proliferate in the presence of girinimbine. Meanwhile, exposure to girinimbine at concentrations ranging from 3.13 to 100 μg/mL for 24 hours had no significant antiproliferative effect on RAW 264.7 cells, so these concentrations of girinimbine were noted to be suitable for further inflammation assays on RAW 264.7 cells.
Girinimbine induces morphological changes in HT-29 cells prior to cell death
We screened the morphological changes in HT-29 cells, including viability, and early and late features of apoptosis, by fluorescence microscopy after treatment with girinimbine for 12, 24, and 48 hours. After 24 hours, HT-29 cells showed early apoptotic features, including chromatin condensation and membrane blebbing. Chromatin condensation was detected through the integration of AO within the condensed DNA, seen as bright green fluorescence, along with cell membrane blebbing. A green intact nuclear structure and membrane indicated healthy cells. After 48 hours, PI binding to denatured DNA, shown by a reddish-orange color, confirmed late stage of apoptosis. These results indicated that girinimbine induced apoptosis in a time-dependent manner in treated cells, while in untreated cells, most of the cells remained viable (Figure 1A).
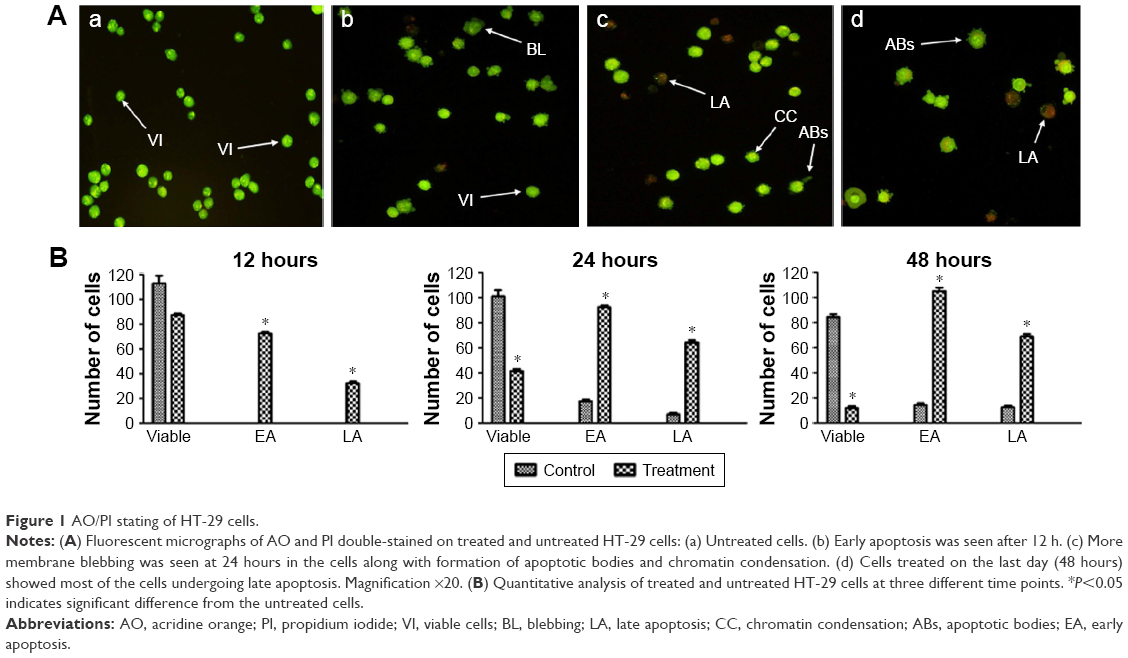 | Figure 1 AO/PI stating of HT-29 cells. |
Quantitative analyses involved the number of girinimbine-treated HT-29 cells that were entering early apoptosis (EA) and late apoptosis (LA) phases in comparison with untreated cells. After the first 12 hours of girinimbine treatment, HT-29 cells had begun to undergo apoptosis with an average number of 80 cells in EA, followed by 40 cells in LA, compared to untreated HT-29 cells which showed no signs of apoptosis. After 24 hours of treatment, there was a significant increase in the number of cells in both EA and LA phases in girinimbine-treated HT-29 cells. The highest average number of apoptotic cells (105) was seen in EA phase in girinimbine-treated HT-29 cells after 48 hours, whereas in untreated cells, there was an average of 18 apoptotic cells in EA phase after 48 hours (Figure 1B).
Girinimbine induces MMP perturbation and release of cytochrome c in HT-29 cells
Four cellular health parameters were examined, namely total nuclear intensity, cell permeability, MMP, and cytochrome c. Hoechst 33342 staining demonstrated that a high number of HT-29 cells treated with girinimbine displayed nuclear condensation, as evidenced by the intensity of blue fluorescence in the nuclei after 24 hours. As seen in Figure 2, nuclear intensity significantly increased after 24-hour treatment with girinimbine; a concurrent elevation was also seen in cell membrane permeability, shown by green fluorescence intensity. MMP was significantly reduced in girinimbine-treated HT-29 cells, shown by a conspicuous attenuation in the red fluorescence intensity seen for the same period. Furthermore, girinimbine triggered a significant translocation of cytochrome c from the mitochondria into the cytosol after 24 hours which was shown by the higher intensity of purple fluorescence in the cytoplasm (P<0.05). Conversely in untreated cells, there was an accumulation of cytochrome c in the mitochondria which was shown by the intensity of red florescence in the cells (Figure 2A). HT-29 cells treated with tamoxifen also showed significant increases in nuclear condensation, cell permeability, and release of cytochrome c from mitochondria into cytosol after 24 hours, while MMP was decreased for the same period (Figure 2B).
 | Figure 2 Effects of girinimbine on nuclear morphology, Cyto c release, CP, and MMP. |
Girinimbine induces G0/G1 cell cycle phase arrest in HT-29 cells
Flow cytometry was used to evaluate the cell cycle phases in HT-29 cells exposed to girinimbine. Girinimbine appeared to have induced cell cycle changes. Quantitative analysis of the cell cycle arrest in girinimbine-treated cells was shown as a percentage of the total cell population in a time-dependent manner. As seen in Figure S1A, a significant increase in the expression of the G0/G1 phase was most obvious in girinimbine-treated HT-29 cells when compared to the untreated controls. In girinimbine-treated cells, the G1 phase was detected in an average 77.89% of the cell population, with a consequent decrease in the average percentages of cells detected at the S phase (5.7%) and G2/M phase (11.48%), while in untreated control cells, the average cell population numbers at G1, S, and G2/M phases were 63.17%, 15.03%, and 21.11%, respectively (Figure S1B).
Girinimbine induces EA through involvement of PS
Results are presented in four quadrants: necrosis (Q1), LA (Q2), viable cells (Q3), and EA (Q4) (Figure S2A). Continuous exposure of HT-29 cells to girinimbine resulted in significant increases in the number of apoptotic cells from 12 to 48 hours at the different stages of apoptosis compared to untreated cells. There was a clear elevation in the percentages of cells in EA from 4.2% to 26.4%, in LA from 5.3% to 15.9%, and in the necrotic phase from 0.1% to 0.3% after 48 hours of girinimbine treatment. In contrast, in untreated cells, the percentages of cells in EA, LA, and necrotic phases at 48 hours were 1.5%, 2.2%, and 0%, respectively (Figure S2B).
Girinimbine induces apoptosis through activation of caspases
Activation of caspases 9 and 3/7 occurred after 24 hours of treatment with girinimbine. Caspase 9, which corresponds to the involvement of the intrinsic pathway, showed a sixfold increase in luminescence units in girinimbine-treated HT-29 cells compared to untreated controls after 48 hours (Figure S3A). Further analysis of caspases 3/7 indicated that girinimbine stimulated the execution phase as seen by the fivefold increase in luminescence units after 48 hours in girinimbine-treated HT-29 cells in comparison with untreated cells (Figure S3B). Both caspases showed significant increases in luminescence units upon girinimbine treatment in a time-dependent manner (P<0.05).
Girinimbine changes the expression of apoptosis-related proteins in HT-29 cells
As shown in Figure 3A, exposure of HT-29 cells to girinimbine for 12, 24, and 48 hours increased the expression of the proapoptotic protein Bax over time. In contrast, the expression of the antiapoptotic protein, Bcl-2, decreased over the same time period. Girinimbine also appeared to upregulate the expressions of caspases 9 and 3, and cleaved caspases 9 and 3 after 48-hour treatment with girinimbine (Figure 3B). Upregulation of caspases suggested the involvement of the mitochondria in apoptosis. Two cell cycle-related proteins, p21 and p27, also showed significant increases in expression after 48 hours of treatment. Moreover, significant upregulation was seen in p53, the key protein in induction of apoptosis after 48 hours (Figure 3A). The highest levels of expression for all proteins were seen after 48-hour treatment with girinimbine except for Bcl-2, which showed its lowest expression level (Figure 3A and B).
 | Figure 3 Western blotting analysis of girinimbine-treated HT-29 cells. |
Girinimbine induced apoptosis in zebrafish embryos
Zebrafish embryos at 24 hpf were exposed to girinimbine (20 μg/mL) to determine the effects of girinimbine on apoptosis in vivo. Staining of 48 and 72 hpf embryos with AO showed that while there were dead cells detected in DMSO-treated control embryos, the girinimbine-treated embryos had significantly higher numbers of dead cells in the region of the tail (Figure 4A and B). In addition, terminal deoxynucleotidyl transferase dUTP nick end labeling (TUNEL) assay detected more apoptotic cellular death around the tails of girinimbine-exposed embryos compared to DMSO-treated embryos at 48 and 72 hpf (Figure 5A). There were significantly more apoptotic cells detected in 48 and 72 hpf embryos after treatment with girinimbine compared to the DMSO-treated embryos (Figure 5B).
 | Figure 4 Detection of cell death in zebrafish embryos using acridine orange. |
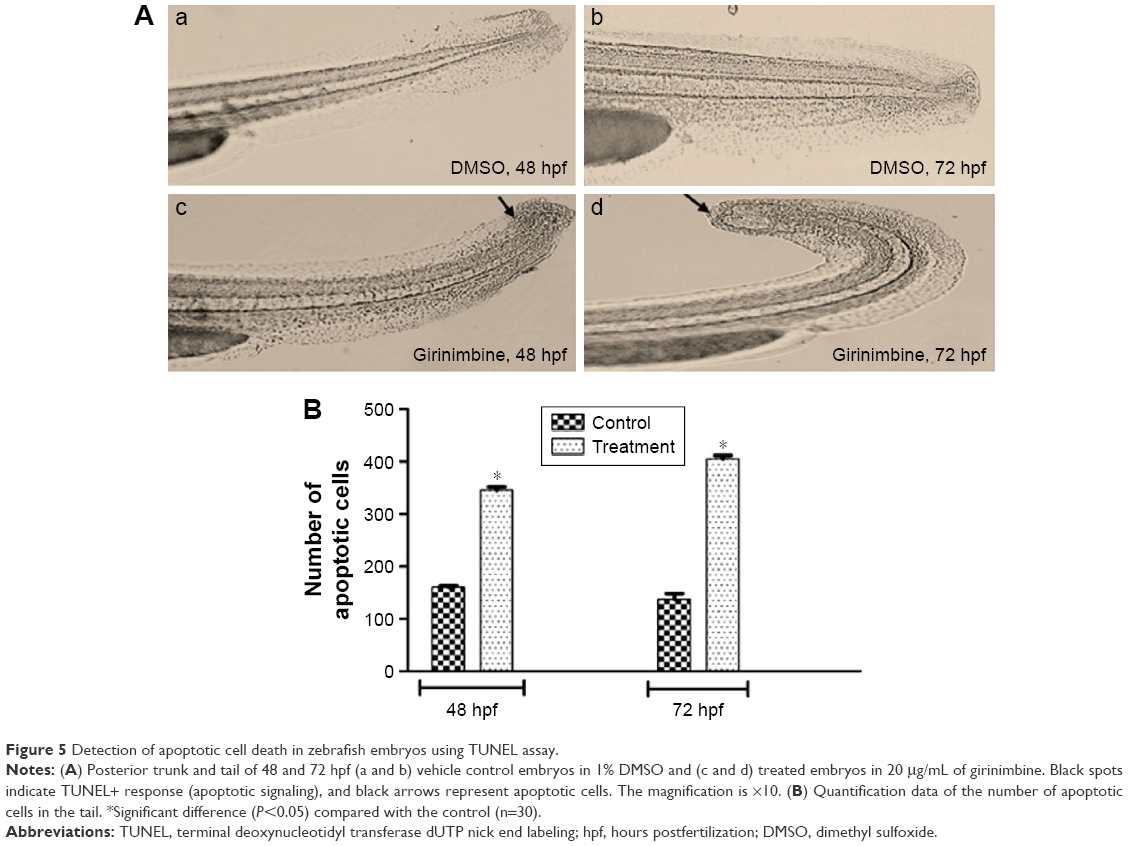 | Figure 5 Detection of apoptotic cell death in zebrafish embryos using TUNEL assay. |
Girinimbine inhibits release of NO in RAW 264.7 cells
Stimulation of RAW 264.7 cells with LPS and IFN-γ led to a 32-fold increase in the concentration of NO in the supernatant with a concentration of 36.7±1.2 μM compared to the basal level of 1.14±0.05 μM in unstimulated RAW 264.7 cells. After treatment with girinimbine at a concentration of 51±3.81 μg/mL, NO release was effectively inhibited (Figure S4). Following 20 hours of girinimbine treatment along with stimulation, a 78.9% inhibition of NO (7.74±0.85 μM) was seen, without influencing the cell viability. L-Nitroarginine methyl ester, which was a positive control and an NO synthase inhibitor, showed 87.7% NO inhibition after treatment with girinimbine.
Girinimbine inhibits NF-κB translocation in stimulated RAW 264.7 cells
This experiment was done to assess the ability of girinimbine to inhibit the translocation of transcription factor NF-κB from the cytosol to the nucleus. Treatment of RAW 264.7 cells with 10 ng/mL LPS for 30 minutes led to a 1.5-fold increase in NF-κB translocation compared to unstimulated cells. Nuclei of control cells exhibited low fluorescent intensity, representing the nonstimulated condition, while the nuclei of RAW 264.7 cells stimulated with TNF-α showed fluorescent intensity which was significantly reduced after treatment with girinimbine (Figure 6A).
 | Figure 6 Effect of girinimbine on NF-κB translocation in RAW 264.7. |
As shown in Figure 6B, when stimulated cells were pretreated with 100 μg/mL of girinim up to 32.7%, inhibition was seen in translocated NF-κB. The percentage of NF-κB translocato the nucleus was compared between untreated cells not exposed to LPS and girinimbine-pretreated cells, to cells treated with LPS alone, and a significant inhibition in NF-κB translocain girinimbine-pretreated cells was observed (P<0.05).
Girinimbine displays antioxidant activity in ORAC assay
To assess the antioxidant capacity of girinimbine, the ORAC assay was applied, and the potency of girinimbine was compared with the positive control, quercetin. The areas under the curve for girinimbine, Trolox, and quercetin were calculated. Girinimbine at 20 μg/mL was equivalent to a concentration of 82.17±1.88 μM of Trolox, while quercetin at 5 μg/mL was equivalent to a concentration of 160.32±2.75 μM of Trolox (data not shown).
Girinimbine inhibits inflammation and suppresses IL-1β and TNF-α levels in vivo
Four hours after carrageenan injection, total leukocyte and neutrophil numbers, as well as exudate volume in the peritoneal cavity, were significantly increased in the carrageenan group compared to the negative control group. Girinimbine administration by ig 1 hour before carrageenan injection resulted in remarkable suppression of the inflammatory process with decreases seen in total leukocyte migration (Figure S5A) and in the number of neutrophils (Figure S5B). Girinimbine pretreatment resulted in decreased numbers of neutrophils, with inhibitions of 72%±3% and 77%±1% at 30 and 100 mg/kg of girinimbine, respectively, compared to the negative control group. Pretreatment of mice with dexamethasone, a steroidal anti-inflammatory drug, also resulted in reduced total cell migration by 88%±2%, shown mainly by neutrophils. In addition, carrageenan-induced peritonitis occurred, with increasing abdominal vascular permeability as indicated by Evans blue dye exudation in the carrageenan-only group. We noted that only dexamethasone and girinimbine at a concentration of 100 mg/kg significantly reduced Evans blue extravasation compared to the carrageenan-only group (Figure S5C). Meanwhile, IL-1β and TNF-α levels were significantly increased in the peritoneal fluid in carrageenan-only group following carrageen injection, but these levels were suppressed in mice treated with either girinimbine (30 and 100 mg/kg, ig) or dexamethasone (0.5 mg/kg, ip) (Figure S6A and B).
Discussion
M. koenigii has long been used for centuries in the Ayurvedic system of medicine to cure various human diseases.33 Studies on pure compounds derived from M. koenigii are limited. Previously, girinimbine, a carbazole alkaloid from the roots of M. koenigii, was found to inhibit cancer cell proliferation and promote apoptosis in human cancer cell lines.24,34 In our recent study, we found that girinimbine inhibited angiogenesis both in vivo and in vitro.23 We subsequently evaluated the effects of girinimbine on the induction of apoptosis in a human colorectal adenocarcinoma cell line (HT-29) and in a zebrafish embryo model, as well as inhibition of inflammation in murine monocyte macrophage cells (RAW 264.7) and in mice.
Induction of apoptosis is a desired outcome of anticancer therapy.8 Interestingly, girinimbine was shown to selectively inhibit cell viability and proliferation in a dose-dependent manner in HT-29, while inducing no significant cytotoxic effects on RAW 264.7 and CCD-18Co cells (normal human colon cells). The condition of cells undergoing apoptosis could be observed through the morphological changes shown after administration of cytotoxic drugs which induce EA and LA phases.35 As shown in Figure 1, apoptosis occurred in HT-29 cells after being treated with girinimbine. During EA, pyknosis, the most prominent characteristic feature of apoptosis, could be seen as a result of chromatin condensation caused by the release of proapoptotic proteins from the mitochondria to the cytosol.35 The longer the duration of exposure to girinimbine, the more morphological changes there were, including plasma membrane blebbing followed by separation of cell fragments into apoptotic bodies.36
Consistent with this data, girinimbine-treated HT-29 cells in the EA phase were detected by annexin V-FITC assay using flow cytometry. The use of annexin V-FITC as a flow cytometric assay for the detection of apoptosis is common because of its strong and specific interaction with PS residues as a universal marker for EA.37 In the EA phases, the cell membrane remains intact due to PS. Once PS is translocated to the outer surface of mitochondria, cell membrane integrity changes. Translocation of PS to the extracellular membrane can be used to distinguish between apoptotic and nonapoptotic cells. The affected cell population was calculated based on the number of apoptotic cells which bonded with FITC-labeled annexin V as early as a day after treatment. The highest percentages of girinimbine-treated cells were in EA phase at 24 and 48 hours, which suggests that girinimbine had triggered EA in HT-29 cells.
Mitochondria has a major role in the induction of apoptosis, with mitochondrial proteins activating cellular apoptotic programs directly.38 Changes in MMP (Ψm) are indicative of the onset of mitochondrial membrane transition pore formation leading to cell death. Results from the multi-cytotoxicity assay suggested that girinimbine acted on the mitochondria, causing loss of Ψm and altering the regulation of proapoptosis-related proteins such as Bax and Bcl-2. The multi-cytotoxicity assay also demonstrated that girinimbine-induced cell death was initiated via the classical mitochondrial pathway (Figure 2). In mitochondria-mediated apoptosis, cytochrome c is one of the main mitochondrial electron transfer chain components that initiate and eventually lead to activation of the downstream caspases, such as caspase 3,39 as well as translocation of the proapoptotic Bax protein from the cytosol to the outer mitochondrial membrane and the change in the MMP.40 Conversely, inhibition of cytochrome c release is governed by the antiapoptotic Bcl-2 protein.40 Western blot analysis confirmed the upregulation of Bax and downregulation of Bcl-2 in girinimbine-treated cells (Figure 3A), suggesting that girinimbine induced apoptosis by altering the regulation of apoptosis-related proteins, Bax and Bcl-2, along with upregulation of caspases 9 and 3/7, reduction in Ψm, and release of cytochrome c to the cytosol. Activation of caspases 9 and 3 in the current study was the strongest indicator of the involvement of apoptosis-dependent pathways due to caspases proteolytic activity that mediates apoptosis.41 Activation of caspase through proteolytic cascade can activate other caspases, which leads to activation of the apoptotic signaling pathway.35 In addition, proteolytic activity in caspases cleaved proteins at aspartic acid residues, as shown in Figure 3B. The involvement of initiator caspase 9 in the mitochondrial pathway was inferred from the morphological changes that occurred in HT-29, as discussed earlier. Once caspases were initiated, cell death would occur.
Girinimbine treatment also resulted in significant increase in cell numbers at the G0/G1 phase, indicative of cell cycle arrest. Blocking cells at the G1 phase would stop cells from entering S phase, as indicated by the results, wherein there was a consequent decrease in the percentage of cells detected at the S phase.42 As girinimbine was shown to induce G0/G1 phase arrest, the next step was to evaluate the possible mechanism of action. Western blot analysis demonstrated the upregulation of two key cell cycle proteins, p21 and p27, which are cyclin-dependent kinase (CDK) inhibitors and play a crucial role in the suppression of cell cycle accelerators.43 Overexpression of CDK inhibitors efficaciously halts abnormal cancerous cells proliferation. The CKI proteins p21 (CIP1) and p27 (KIP1) are two protein members of the CIP/KIP family and form heterotrimeric complexes to promote cell cycle arrest via the G1/S CDKs cascade.44 Also detected in this study was the upregulation of p53, the well-known tumor suppressor protein. Cells would respond to p53 activation with apoptosis and cell cycle phase arrest.45 p53 has been shown to upregulate the cell cycle regulatory proteins such as p21.46 Taken together, the higher expression levels of p21, p27, and p53 followed by cell cycle arrest at the G1 phase in girinimbine-treated HT-29 cells revealed an irreversible commitment toward apoptosis.
Induction of apoptosis by girinimbine was investigated in vivo using the zebrafish embryo model. Zebrafish embryos have become useful animal models for providing rapid assessments for drug discovery.47 Several advantages make embryos desirable for such studies, including rapid embryonic development with the formation of most body organs within 48 hours, enabling thorough toxicological assessments within a few days. The transparent nature of the embryo’s body also allows for noninvasive evaluation of internal developments during experiments. Moreover, a high rate of apoptosis is normally occurring during development of the zebrafish embryo to form various structures.48
In this study, embryos treated with girinimbine experienced increased apoptosis in comparison with the control group. Estimation of apoptosis levels in embryonic zebrafish was done through AO staining and TUNEL assay.27,49 AO binds both necrotic and apoptotic cells; thus, TUNEL assay was done to affirm the apoptosis events. AO stained the nuclei of all cells which underwent either apoptosis or necrosis green, while TUNEL assay labeled the blunt ends of double-stranded DNA breaks indicative of apoptosis.50 Together, the results of both assays confirmed the higher rate of apoptotic cell death in girinimbine-treated embryos compared to controls.
Caspase 3 activity is essential for normal morphogenesis and particularly for apoptosis in zebrafish embryos, and overexpression of caspase 3 is known to induce apoptosis in the tail during embryogenesis.51 p53 is another protein which has been associated with apoptosis induction during embryos development.52 Based on the overexpression of these two proteins in our in vitro study, it is possible that girinimbine may have exerted a similar molecular mechanism in zebrafish embryos. Further studies on the expressions of apoptosis-related proteins in response to girinimbine treatment are needed to ascertain the precise mechanism of apoptosis induction in zebrafish embryos.
Proof of a possible link between cancer and inflammation was provided by Rudolf Virchow who reported the presence of leukocytes within tumors and suggested that tumor-infiltrating lymphocytes might contribute to cancer progression and growth.53 Inflammation impacts on tumor development, cancer progression, and therapy. Inflammatory cytokines, through the activation of various pathways such as NF-κB, STAT, AP-1, and caspases, promote tumor development and progression.53 An earlier report on the anti-inflammatory activity of M. koenigii suggested that methanolic and aqueous extracts of this plant exerted an anti-inflammatory effect in an acute inflammation rat model,54 but did not outline the mechanism of action. Findings from the current study give us insight into a possible mechanism of action behind the anti-inflammatory properties of girinimbine isolated from M. koenigii, via the inhibition of NO and NF-κB in stimulated RAW 264.7 cells. Moreover, the present study substantiates the mechanism of action of girinimbine which has been reported to inhibit COX enzymes.21
NF-κB protein controls many genes involved in inflammation and cancer, so it is not surprising that NF-κB is found to be chronically active in both conditions.55 The effect of girinimbine on NF-κB translocation was observed in LPS-treated RAW 264.7 cells (Figure 6). The inducible transcription factor NF-κB has also been implicated in the regulation of an array of inflammatory cytokine genes.6 Production of pro-inflammatory cytokines and mediators like inducible nitric oxide synthase (iNOS) is governed by NF-κB.56 Based on current findings, girinimbine was found to suppress the translocation of NF-κB in LPS-treated RAW 264.7 cells. This would suggest that girinimbine’s anti-inflammatory effect is achieved through a postreceptor signaling mechanism, as LPS, the pro-inflammatory stimulator used, is known to act on Toll-like receptor 4 (TLR4), which is a part of the TLR4 signaling pathway that culminates in the inactivation of NF-κB.57 Hence, suppression of NF-κB in LPS-stimulated RAW 264.7 cells could be associated with the downregulation of TLR4 by girinimbine.
NO has a significant role in inflammatory conditions and has been implicated in several pathophysiological conditions including cancer.58 NO is produced by the iNOS. Exposure of RAW 264.7 to LPS and IFN-γ has been shown to induce the expression of iNOS, resulting in high amounts of NO production.59 Clancy et al60 showed that in macrophages exposed to NO, enhanced production of PGE2, a by product of COX enzymes, was detected. The Griess assay result showed that girinimbine induced dose-dependent anti-inflammatory activities corresponding to its inhibition of NO in RAW 264.7 cells, without affecting cell viability. These results concur with previous reports on M. koenigii, where in Murrayanol, another alkaloid extract from fresh M. koenigii leaves, was reported to possess anti-inflammatory activity through inhibition of COX activity of prostaglandins hPGHS-1 and 2.61 Girinimbine is a carbazole alkaloid from the same plant, so a similar mechanism could be in play.
In another study, Feng-Nien et al21 reported that girinimbine showed antiplatelet activity through elevation of cyclic AMP levels. However, Chen et al62 suggested that treatment of RAW 264.7 cells with LPS increased intracellular cAMP levels through COX-2 induction and PGE2 production, resulting in activation of NF-κB, expression of iNOS, and production of NO. The researchers in these two different studies used different types of cells, namely rabbit platelets and RAW 264.7 cells, respectively. We propose that this conflict is in line with our findings, for after pretreatment with girinimbine, RAW 264.7 cells were stimulated with LPS, and the results demonstrated significant inhibition in both NF-κB translocation and NO production in comparison with untreated cells. Therefore, we postulate that girinimbine could inhibit subsequent production of iNOS, PGE2, cAMP, and COX-2 enzyme as well. However, confirmation of girinimbine inhibition of all these factors should be done, and it is suggested that future research should also utilize the RAW 264.7 cells.
The ORAC assay takes free radical action to completion and utilizes an area-under-curve calculation technique for quantitation, hence combining both inhibition percentage and the length of inhibition time of the free radical action by antioxidant compounds into a single quantity.63 Girinimbine was shown to have considerable antioxidant activity. Phytochemicals have been reported to suppress iNOS and COX-2 promoter activities and inhibit NF-κB nuclear translocation in LPS-treated cells.64 Pyrano [3,2-a] carbazoles such as girinimbine, isolated from plant species of the Rutaceae family, were reported to possess these anti-inflammatory and antioxidant activities.65 It has also been demonstrated that several natural product compounds classified under carbazole alkaloids act as potent suppressors of NF-κB activation.66 Bearing in mind that girinimbine is a carbazole alkaloid, it is not unexpected that this compound exhibits antioxidant and anti-inflammatory activity as described in this study, as well as cytotoxic effects as described previously by Wang et al.24
Girinimbine was also shown to significantly inhibit inflammatory factors in vivo when carrageenan-induced peritonitis in mice was used as a model of inflammation. There was an increase in Evans blue leakage as well as in the total number of white cells, mainly neutrophils, which migrated into the peritoneal cavity 4 hours after carrageenan injection. Neutrophils are typically the first leukocytes to be recruited to an inflammation site and are capable of eliminating pathogens by multiple mechanisms.67 However, in a cancer state, neutrophils promote tumor phenotypes, including cancer cell growth, invasion, and angiogenesis.68 Inflammatory cells may be influencing cancer development by secreting cytokines, chemokines, and growth factors that wind up stimulating cancer cell proliferation and invasiveness.4 In this study, mice pretreated with girinimbine showed a significant decrease in neutrophils compared to the carrageenan control group.
In addition to the decrease in leukocyte migration, oral gavage administration of girinimbine reduced carrageenan-induced cytokine release, namely IL-1β and TNF-α. These pro-inflammatory cytokines (IL-1β and TNF-α) function to assist in propagating systemic or local inflammatory processes by increasing vascular permeability and leukocyte migration.69 Moreover, in a cancer state, neutrophils support tumor expansion through the overexpression of pro-inflammatory cytokines such as IFN-γ, TNF-α, IL-1β, and interleukin-6. Among the many inflammatory cytokines, TNF-α is believed to be a key target, with a significant role in various inflammation-related diseases. TNF-α acts by activating macrophages and T cells, and by stimulating other inflammatory cytokines such as IL-1β.70 In relation to the involvement of IL-1β and TNF-α, girinimbine pretreatment was shown to result in significantly reduced levels of the two cytokines in mice induced with peritonitis. Therefore, the inhibitory effects of girinimbine on leukocyte migration could be attributed to the suppression of IL-1β and TNF-α release. Furthermore, it is worth noting that several cytokine inhibitor drugs are already in use for the treatment of chronic inflammatory diseases and several clinical trials (Phase I/II) are evaluating the efficacy of anti-TNF-α drugs as single agents in the treatment of various cancers.71
The correlation between inflammation and cancer has been previously described, and targeting inflammation is a viable armament in cancer therapeutics.72 By targeting various contributing factors in cancer such as apoptosis and inflammation, real gains might be made in the fight against this disease. Indeed, one of the major advantages of investigating the relationship between cancer and inflammation is that most cancers might be preventable. Achieving prevention would be an easier and economical way to beat cancer than devising treatments for advanced stages of cancer.
Conclusion
The current study adds insight into the anticancer properties of girinimbine, specifically, the induction of apoptosis and inhibition of inflammation. To the best of our knowledge, these findings represent the first line of evidence for a novel pharmacological effect of girinimbine as an inhibitor of inflammation. Further enhancement to its current structure to generate more effective and specific derivatives could also be considered for future development of girinimbine as an anticancer agent.
Acknowledgment
This work was financially supported by the University of Malaya, Kuala Lumpur, Malaysia, through a Postgraduate Research Grant awarded to VI (PG150-2012B).
Author contributions
All authors contributed toward data analysis, drafting and critically revising the paper and agree to be accountable for all aspects of the work.
Disclosure
The authors report no conflicts of interest in this work.
References
Tenesa A, Dunlop MG. New insights into the aetiology of colorectal cancer from genome-wide association studies. Nat Rev Genet. 2009;10(6):353–358. | ||
Rustgi AK. The genetics of hereditary colon cancer. Genes Dev. 2007;21(20):2525–2538. | ||
Van der Woude C, Kleibeuker J, Jansen P, Moshage H. Chronic inflammation, apoptosis and (pre-) malignant lesions in the gastro-intestinal tract. Apoptosis. 2004;9(2):123–130. | ||
Eiró N, Vizoso FJ. Inflammation and cancer. World J Gastrointest Surg. 2012;4(3):62–72. | ||
Evan GI, Vousden KH. Proliferation, cell cycle and apoptosis in cancer. Nature. 2001;411(6835):342–348. | ||
Tak PP, Firestein GS. NF-kappaB: a key role in inflammatory diseases. J Clin Invest. 2001;107(1):7–12. | ||
Terzić J, Grivennikov S, Karin E, Karin M. Inflammation and colon cancer. Gastroenterology. 2010;138(6):2101–2114.e2105. | ||
Gordaliza M. Natural products as leads to anticancer drugs. Clin Transl Oncol. 2007;9(12):767–776. | ||
Goyle S, Maraveyas A. Chemotherapy for colorectal cancer. Dig Surg. 2005;22(6):401–414. | ||
Bandgar BP, Adsul LK, Chavan HV, et al. Synthesis, biological evaluation, and docking studies of 3-(substituted)-aryl-5-(9-methyl-3-carbazole)-1H-2-pyrazolines as potent anti-inflammatory and antioxidant agents. Bioorg Med Chem Lett. 2012;22(18):5839–5844. | ||
Collins I, Workman P. New approaches to molecular cancer therapeutics. Nat Chem Biol. 2006;2(12):689–700. | ||
Newman DJ, Cragg GM. Natural products as sources of new drugs over the last 25 years. J Nat Prod. 2007;70(3):461–477. | ||
Bhandari PR. Curry leaf (Murraya koenigii) or cure leaf: review of its curative properties. J Med Nutr Neutraceut. 2012;1(2):92–97. | ||
Syam S, Abdul AB, Sukari MA, Mohan S, Abdelwahab SI, Wah TS. The growth suppressing effects of girinimbine on HepG2 involve induction of apoptosis and cell cycle arrest. Molecules. 2011;16(8):7155–7170. | ||
Mohan S, Abdelwahab SI, Cheah S-C, et al. Apoptosis effect of girinimbine isolated from Murraya koenigii on lung cancer cells in vitro. Evid Based Complement Alternat Med. 2013;2013:689865. | ||
Bakar A, Haslizawati N, Sukari MA, Rahmani M, Khalid K, Yusuf UK. Chemical constituents from stem barks and roots of Murraya koenigii (Rutaceae). Malaysian J Anal Sci. 2007;11(1):173–176. | ||
Ahmad K, Tan S-P, Sukari MA, Ali AM, Nafiah MA. Cytotoxic and anti-tumour promoting activities of carbazole alkaloids from Malayan Murraya koenigii (L.) Spreng. Am J Plant Sci. 2014;5(19):2869–2877. | ||
Asche C, Demeunynck M. Antitumor carbazoles. Anticancer Agents Med Chem. 2007;7(2):247–267. | ||
Adebajo AC, Olayiwola G, Eugen Verspohl J, et al. Evaluation of the ethnomedical claims of Murraya koenigii. Pharm Biol. 2005;42(8):610–620. | ||
Adebajo AC, Ayoola O, Iwalewa E, et al. Anti-trichomonal, biochemical and toxicological activities of methanolic extract and some carbazole alkaloids isolated from the leaves of Murraya koenigii growing in Nigeria. Phytomedicine. 2006;13(4):246–254. | ||
Feng-Nien K, Yi-San L, Tian-Shung W, Che-Ming T. Inhibition of cyclooxygenase activity and increase in platelet cyclic AMP by girinimbine, isolated from Murraya euchrestifolia. Biochem Pharmacol. 1994;48(2):353–360. | ||
Thevissen K, Marchand A, Chaltin P, Meert EM, Cammue B. Antifungal carbazoles. Curr Med Chem. 2009;16(17):2205–2211. | ||
Iman V, Karimian H, Mohan S, et al. In vitro and in vivo anti-angiogenic activity of girinimbine isolated from Murraya koenigii. Drug Des Dev Ther. 2015;9:1281. | ||
Wang S-L, Cai B, Cui C-B, Yan S-Y, Wu C-F. Study on induction of apoptosis by girinimbine in HCT-15 cell in vitro. Chin J Pharm Anal. 2008;28(2):176–181. | ||
Lövborg H, Nygren P, Larsson R. Multiparametric evaluation of apoptosis: effects of standard cytotoxic agents and the cyanoguanidine CHS 828. Mol Cancer Ther. 2004;3(5):521–526. | ||
Kurien BT, Scofield RH. Western blotting. Methods. 2006;38(4):283–293. | ||
Chan P, Cheng S. Cadmium-induced ectopic apoptosis in zebrafish embryos. Arch Toxicol. 2003;77(2):69–79. | ||
Granger DL, Taintor RR, Boockvar KS, Hibbs JB. Measurement of nitrate and nitrite in biological samples using nitrate reductase and Griess reaction. Methods Enzymol. 1996;268:142–151. | ||
Ding GJ, Fischer PA, Boltz RC, et al. Characterization and quantitation of NF-κB nuclear translocation induced by interleukin-1 and tumor necrosis factor-α development and use of a high capacity fluorescence cytometric system. J Biol Chem. 1998;273(44):28897–28905. | ||
Cao G, Alessio HM, Cutler RG. Oxygen-radical absorbance capacity assay for antioxidants. Free Radic Biol Med. 1993;14(3):303–311. | ||
Montanher AB, Zucolotto SM, Schenkel EP, Fröde TS. Evidence of anti-inflammatory effects of Passiflora edulis in an inflammation model. J Ethnopharmacol. 2007;109(2):281–288. | ||
Lucena GM, Gadotti VM, Maffi LC, Silva GS, Azevedo MS, Santos AR. Antinociceptive and anti-inflammatory properties from the bulbs of Cipura paludosa Aubl. J Ethnopharmacol. 2007;112(1):19–25. | ||
Jain V, Momin M, Laddha K. Murraya Koenigii: an updated review. Int J Ayurvedic Herb Med. 2012;2(4):607–627. | ||
Wang S-L, Cai B, Cui C-B, Yan S, Wu C. Induction of apoptosis by girinimbine in K562 cell. Chin Tradit Herb Drugs. 2007;38(11):1677. | ||
Elmore S. Apoptosis: a review of programmed cell death. Toxicol Pathol. 2007;35(4):495–516. | ||
Kasibhatla S, Tseng B. Why target apoptosis in cancer treatment? Mol Cancer Ther. 2003;2(6):573–580. | ||
Arur S, Uche UE, Rezaul K, et al. Annexin I is an endogenous ligand that mediates apoptotic cell engulfment. Dev Cell. 2003;4(4):587–598. | ||
Sun S-Y, Hail N, Lotan R. Apoptosis as a novel target for cancer chemoprevention. J Natl Cancer Inst. 2004;96(9):662–672. | ||
Wang X. The expanding role of mitochondria in apoptosis. Genes Dev. 2001;15(22):2922–2933. | ||
Youle RJ, Strasser A. The BCL-2 protein family: opposing activities that mediate cell death. Nat Rev Mol Cell Biol. 2008;9(1):47–59. | ||
Kumar S. Caspase function in programmed cell death. Cell Death Differ. 2007;14(1):32–43. | ||
Vermeulen K, Van Bockstaele DR, Berneman ZN. The cell cycle: a review of regulation, deregulation and therapeutic targets in cancer. Cell Prolif. 2003;36(3):131–149. | ||
Williams GH, Stoeber K. The cell cycle and cancer. J Pathol. 2012;226(2):352–364. | ||
Weinl C, Marquardt S, Kuijt SJ, et al. Novel functions of plant cyclin-dependent kinase inhibitors, ICK1/KRP1, can act non-cell-autonomously and inhibit entry into mitosis. Plant Cell. 2005;17(6):1704–1722. | ||
Amaral JD, Xavier JM, Steer CJ, Rodrigues CM. The role of p53 in apoptosis. Discov Med. 2010;9(45):145–152. | ||
Li T, Kon N, Jiang L, et al. Tumor suppression in the absence of p53-mediated cell-cycle arrest, apoptosis, and senescence. Cell. 2012;149(6):1269–1283. | ||
MacRae CA, Peterson RT. Zebrafish as tools for drug discovery. Nat Rev Drug Discov. 2015;14(10):721–731. | ||
Cole L, Ross L. Apoptosis in the developing zebrafish embryo. Dev Biol. 2001;240(1):123–142. | ||
Alvarez M, Villanueva Á, Acedo P, Cañete M, Stockert JC. Cell death causes relocalization of photosensitizing fluorescent probes. Acta Histochem. 2011;113(3):363–368. | ||
Kraupp BG, Ruttkay-Nedecky B, Koudelka H, Bukowska K, Bursch W, Schulte-Hermann R. In situ detection of fragmented DNA (TUNEL assay) fails to discriminate among apoptosis, necrosis, and autolytic cell death: a cautionary note. Hepatology. 1995;21(5):1465–1468. | ||
Yamashita M, Mizusawa N, Hojo M, Yabu T. Extensive apoptosis and abnormal morphogenesis in pro-caspase-3 transgenic zebrafish during development. J Exp Biol. 2008;211(12):1874–1881. | ||
Zeng C, Sun H, Xie P, et al. The role of apoptosis in MCLR-induced developmental toxicity in zebrafish embryos. Aquat Toxicol. 2014;149:25–32. | ||
Balkwill F, Mantovani A. Inflammation and cancer: back to Virchow? Lancet. 2001;357(9255):539–545. | ||
Prasad G, Dua VK, Mathur A. Anti-inflammatory activity of leaves extracts of Murraya koenigii L. Int J Pharm Biol Sci. 2011;2(1):541–544. | ||
Macarthur M, Hold GL, El-Omar EM. Inflammation and cancer II. Role of chronic inflammation and cytokine gene polymorphisms in the pathogenesis of gastrointestinal malignancy. Am J Physiol Gastrointest Liver Physiol. 2004;286(4):G515–G520. | ||
Achoui M, Appleton D, Abdulla MA, Awang K, Mohd MA, Mustafa MR. In vitro and in vivo anti-inflammatory activity of 17-O-acetylacuminolide through the inhibition of cytokines, NF-κB translocation and IKKβ activity. PLoS One. 2010;5(12):e15105. | ||
Fan H, Cook JA. Molecular mechanisms of endotoxin tolerance. J Endotoxin Res. 2004;10(2):71–84. | ||
Ambs S, Merriam WG, Bennett WP, et al. Frequent nitric oxide synthase-2 expression in human colon adenomas: implication for tumor angiogenesis and colon cancer progression. Cancer Res. 1998;58(2):334–341. | ||
Oh G-S, Pae H-O, Lee B-S, et al. Hydrogen sulfide inhibits nitric oxide production and nuclear factor-κB via heme oxygenase-1 expression in RAW264. 7 macrophages stimulated with lipopolysaccharide. Free Radic Biol Med. 2006;41(1):106–119. | ||
Clancy R, Varenika B, Huang W, et al. Nitric oxide synthase/COX cross-talk: nitric oxide activates COX-1 but inhibits COX-2-derived prostaglandin production. J Immunol. 2000;165(3):1582–1587. | ||
Ramsewak RS, Nair MG, Strasburg GM, DeWitt DL, Nitiss JL. Biologically active carbazole alkaloids from Murraya koenigii. J Agric Food Chem. 1999;47(2):444–447. | ||
Chen CC, Chiu KT, Sun YT, Chen WC. Role of the cyclic AMP-protein kinase a pathway in lipopolysaccharide-induced nitric oxide synthase expression in RAW 264.7 macrophages. J Biol Chem. 1999;274(44):31559–31564. | ||
Almeida IF, Fernandes E, Lima JL, Costa PC, Bahia MF. Walnut (Juglans regia) leaf extracts are strong scavengers of pro-oxidant reactive species. Food Chem. 2008;106(3):1014–1020. | ||
Bak M-J, Hong S-G, Lee J-W, Jeong W-S. Red ginseng marc oil inhibits iNOS and COX-2 via NFκB and p38 pathways in LPS-stimulated RAW 264.7 macrophages. Molecules. 2012;17(12):13769–13786. | ||
Sangeetha V, Prasad KR. Synthesis of 12, 13-dihydro-5-oxoquinolino [2, 3-a] carba-zoles, 3, 11-dihydro-2, 4-dioxopyrano [2, 3-a] carbazoles and quinolino [2, 3-b] carbazolo [6, 5-a] pyran-7, 8-diones. Indian J Chem Sect B. 2006;45(6):1487. | ||
Nam N-H. Naturally occurring NF-κB inhibitors. Mini Rev Med Chem. 2006;6(8):945–951. | ||
da Silva MD, Guginski G, de Paula Werner MF, Baggio CH, Marcon R, Santos ARS. Involvement of interleukin-10 in the anti-inflammatory effect of Sanyinjiao (SP6) acupuncture in a mouse model of peritonitis. Evid Based Complement Alternat Med. 2011;2011:217946. | ||
Phillipson M, Kubes P. The neutrophil in vascular inflammation. Nat Med. 2011;17(11):1381–1390. | ||
Mizgerd JP, Spieker MR, Doerschuk CM. Early response cytokines and innate immunity: essential roles for TNF receptor 1 and type I IL-1 receptor during Escherichia coli pneumonia in mice. J Immunol. 2001;166(6):4042–4048. | ||
Zhang J-M, An J. Cytokines, inflammation and pain. Int Anesthesiol Clin. 2007;45(2):27–37. | ||
Robinson SC, Coussens LM. Soluble mediators of inflammation during tumor development. Adv Cancer Res. 2005;93:159–187. | ||
Coussens LM, Werb Z. Inflammation and cancer. Nature. 2002;420(6917):860–867. |
Supplementary materials
 | Figure S1 Effect of girinimbine on cell cycle progression in HT-29 cells. |
 | Figure S2 Time-dependent inductions of EA and LA by girinimbine. |
 | Figure S3 Effect of girinimbine on activation of caspases 9 and 3/7 in HT-29 cells. |
 | Figure S4 Effect of girinimbine on NO production. |
 | Figure S5 Effect of pretreatment with girinimbine on carrageenan-induced peritonitis in mice. |
 | Figure S6 Effects of girinimbine on inflammatory cytokines in mice with carrageenan-induced peritonitis. |
 © 2016 The Author(s). This work is published and licensed by Dove Medical Press Limited. The
full terms of this license are available at https://www.dovepress.com/terms
and incorporate the Creative Commons Attribution
- Non Commercial (unported, 3.0) License.
By accessing the work you hereby accept the Terms. Non-commercial uses of the work are permitted
without any further permission from Dove Medical Press Limited, provided the work is properly
attributed. For permission for commercial use of this work, please see paragraphs 4.2 and 5 of our Terms.
© 2016 The Author(s). This work is published and licensed by Dove Medical Press Limited. The
full terms of this license are available at https://www.dovepress.com/terms
and incorporate the Creative Commons Attribution
- Non Commercial (unported, 3.0) License.
By accessing the work you hereby accept the Terms. Non-commercial uses of the work are permitted
without any further permission from Dove Medical Press Limited, provided the work is properly
attributed. For permission for commercial use of this work, please see paragraphs 4.2 and 5 of our Terms.