Back to Journals » OncoTargets and Therapy » Volume 12
Anti-PD1 up-regulates PD-L1 expression and inhibits T-cell lymphoma progression: possible involvement of an IFN-γ-associated JAK-STAT pathway
Authors Xue W ![]() , Li W, Zhang T, Li Z
, Li W, Zhang T, Li Z ![]() , Wang Y, Qiu Y, Wang Y, Chen C, Fu D, Zhang M
, Wang Y, Qiu Y, Wang Y, Chen C, Fu D, Zhang M
Received 12 September 2018
Accepted for publication 2 February 2019
Published 19 March 2019 Volume 2019:12 Pages 2079—2088
DOI https://doi.org/10.2147/OTT.S187280
Checked for plagiarism Yes
Review by Single anonymous peer review
Peer reviewer comments 4
Editor who approved publication: Dr Jianmin Xu
Weili Xue,1,* Weiming Li,1,* Tiantian Zhang,2 Zhaoming Li,1 Yingjun Wang,1 Yajuan Qiu,1 Yuanyuan Wang,1 Changying Chen,1 Dongjun Fu,3 Mingzhi Zhang1
1Oncology Department, The First Affiliated Hospital of Zhengzhou University, Erqi District, Zhengzhou, Henan Province, China; 2Toni Stephenson Lymphoma Center, City of Hope, Duarte, CA, USA; 3New Drug Research and Development Center, School of Pharmaceutical Sciences of Zhengzhou University, Zhengzhou, Henan Province, China
*These authors contributed equally to this work
Purpose: NK/T-cell neoplasms are rare, highly aggressive, and insensitive to chemotherapy. These lymphomas have a poor prognosis, with patients being vulnerable to relapse. Hence, there is a need for alternative treatments. The purpose of this study is to investigate whether anti-PD1 takes effect on NK/T cell lymphoma.
Methods: The expression of PD-L1 in NK/T cell lines was investigated by flow cytometry and by Western blot. In vivo, overall survival and median survival time of mice bearing an NK/T cell line tumor was assessed. Tumor-infiltrating T cells and monocyte-derived suppressor cells were evaluated by flow cytometry. Levels of PD-L1 and components of the JAK-STAT pathway were assessed in tumor tissues by immunohistochemistry.
Results: NK/T cell lines had greater expression of PD-L1 than normal peripheral blood human NK cells. In vivo, anti-PD1 treatment improved overall survival and median survival time of mice bearing an NK/T cell line. Furthermore, anti-PD1 treatment increased levels of PD-L1. Cultured tumor-infiltrating lymphocytes from mice treated with anti-PD1 had greater levels of IFN-γ than cultured lymphocytes from untreated animals. Further, levels of JAK2 and STAT1 were greater in mice treated with anti-PD1.
Conclusion: In vivo, anti-PD1 inhibited the progression of an NK/T-cell lymphoma and up-regulated PD-L1 expression. This up-regulation may be through the IFN-γ-associated JAK-STAT pathway.
Keywords: PD-L1, anti-PD1, NK/T-cell lymphoma, immunotherapy, JAK-STAT, IFN-γ
Introduction
Natural killer (NK)/T cell lymphomas (NKTLs) are rare, heterogeneous diseases that have an aggressive clinical course necessitating immediate treatment.1 In 2015, NKTLs accounted for approximately 15% of the estimated 71,850 cases of Non-Hodgkin Lymphoma (NHL) diagnosed in the United States, and NKTLs are differentiated into subtypes by morphology, location, immunophenotype and genetics. Patients with NKTL have a poorer outcome than those with aggressive B-cell lymphoma. National Comprehensive Cancer Network (NCCN) guidelines provide several chemotherapeutic regimens for NKTL. However, for patients with early-stage disease, the 5-year overall survival (OS) and progression-free survival (PFS) rates are 39% and 33%, respectively, even with treatment using combined chemoradiotherapy or chemotherapy alone. Hence, an urgent need exists for alternative therapies to treat this heterogeneous cancer that has poor prognosis.
Immunotherapy, especially checkpoint inhibitors that block the interaction between programmed cell death 1 (PD-1) and its ligand (PD-L1), may provide such alternative therapies.2,3 PD-L1 is expressed by various cancers, including solid tumors and lymphomas, with expression of PD-L1 reportedly being associated with a poorer prognosis.4–7 The interplay between cancer cells and the tumor microenvironment has generated interest in the PD1/PD-L1 pathway as a potential therapeutic target for personalized medicine. Further, blockade of PD1 and its ligand PD-L1 has proved effective for the treatment of B-cell lymphomas.8–10
Blood serum and tissue samples from NKTL patients have been extensively analyzed for PD-1/PD-L1. For example, high levels of soluble PD-L1 (sPD-L1) have been found in the sera of nasal NKTL patients. These levels were positively associated with PD-L1 expression by lymphoma cells.11 Additionally, PD-L1 was identified in 56% of tumor cells and in 62% of total cells (including malignant and non-malignant tissues) of 73 NKTL cases.12 Although tissue samples have been extensively investigated, few studies have assessed NKTL cell lines.
The effect of anti-PD-1 treatment has been clearly elucidated for a variety of neoplasms including ovarian cancer,13 melanoma14 and lung cancer.15 For ovarian cancer, anti-PD-1/CD134 monoclonal antibody (mAb) treatment increased CD4+ and CD8+ cells and decreased immunosuppressive CD4+FoxP3+ regulatory T (Treg) cells and myeloid-derived suppressor cells (MDSC). While the clinical efficacy of anti-PD-1 treatment for NKTLs has been extensively investigated, the mechanistic basis for its efficacy has not been fully elucidated.
Many extrinsic factors have been demonstrated to induce the expression of PD-L1 through different signaling pathways in cancer cells. In prostate cancer and colon cancer, tumor necrosis factor alpha (TNF-α) can induce the expression of PD-L1 mainly through (nuclear factor kappa light chain enhancer of activated B cells [NF-κB]) signaling. Epidermal growth factor receptor tyrosine kinase inhibitors (EGFR-TKI) down-regulate PD-L1 in epidermal growth factor receptor (EGFR) mutant non-small-cell lung cancer (NSCLC) by inhibiting NF-κB.16 IL-27 can induce PD-L1 expression in ovarian cancer through activation of signal transducer and activator of transcription 3 (STAT3).17 The anticancer agent can also induce PD-L1 transcription through janus kinase 2/signal transducer and activators of transcription 1 (JAK2/STAT1) pathway in pancreatic cancer.18 Among them, Interferon gamma (IFN-γ) is the most potent inducer via the JAK2/STAT1 pathway in multiple types of cancers. Further, IFN-γ can induce PD-L1 expression in human oral squamous carcinoma cells in a time- and dose-dependent manner via the polycystic kidney disease (PKD2) signaling pathway.19 In the process of testing the effect of anti-PD1 in T cell lymphoma models, we found PD-L1 was up-regulated after anti-PD1 treatment. This is a novel finding in T cell lymphoma after anti-PD1 experiment. Besides, no relevant mechanism has been found to be involved.
Here we further investigated the expression of PD-L1 in several NKTL cell lines and confirmed the effect of anti-PD1 on T cell lymphoma. What’s more, we found that PD-L1 was up-regulated after anti-PD1 treatment of T cell lymphoma models. Further, the mechanistic basis for this effect was evaluated.
Materials and methods
Chemicals and cell lines
Phorbol 12-myristate 13-acetate (PMA, 16561-29-8) and ionomycin (I3909) were purchased from Sigma-Aldrich (St. Louis, MO, USA). Anti-mouse PD-1 (clone RMP1-14) antibody for in vivo use was purchased from BioXCell (West Lebanon, NH, USA). YT, NKYS, NK92, KAI3, NKL and SNK-6 were obtained from ExPASy. EL4 was bought from Chinese Academy of Sciences Cell Bank (Shanghai, China). PBMCs are from human donors.
YT and EL4 cells were maintained in RPMI–1640 medium supplemented with 10% fetal bovine serum (FBS). NKL and NK92 were maintained in RPMI–1640 medium with 10% FBS and 100 IU/mL rhIL-2. KAI3 was maintained in RPMI–1640 medium supplemented with 20% FBS and 100 IU/mL rhIL-2; SNK-6 was maintained in RPMI–1640 medium supplemented with 10% Human serum and 700 IU/mL rhIL-2. All media contained 100 units/mL penicillin and 100 μg/mL streptomycin. All cell lines were maintained at 37°C in a humidified incubator containing 5% CO2.
Magnetic separation
Peripheral blood mononuclear cells (PBMCs) were isolated from human donors by density gradient centrifugation; the suspension was centrifuged at 300 × g for 10 minutes. The supernatant was aspirated completely and cell pellet was resuspended in 40 μL of buffer. Then, 10 μL of NK Cell Biotin-Antibody Cocktail was mixed well with it and incubated for 5 minutes in the refrigerator. To this, 30 μL of buffer was added again before 20 μL of the NK Cell MicroBead Cocktail was added. The mixture was incubated for an additional 10 minutes in the refrigerator. The volume was adjusted to a minimum of 500 μL and placed in the magnetic field of a miniMACS Separator and rinsed with 500 μL of buffer. Flow-through containing unlabeled cells – NK cells – were collected.
Lentivirus production and transfection
293 FT cells were seeded in a 15-cm dish in 20 mL of complete DMEM medium. Cells were incubated for 24 hours at 37°C. Full culture medium was exchanged with 8.1 mL Opti-MEM per dish. 293 FT cells were transfected with the application of polyethyleneimine (764582, Merck Life Science, Shanghai, China). The dish was mixed by rocking gently to spread the DNA. Three days after transfection, the medium containing cell debris was centrifuged and concentrate virus were collected. EL4 cells were seeded and put in 200 uL lentivirus stock. The plate was swirled to mix and incubated overnight. Three days later, GFP-positive cells were sorted and incubated at 37°C in a CO2 incubator.
CD56 expression in isolated NK cells and PD-L1 expression in cell lines by flow cytometry
A concentration of 1×10⁶ cells were centrifuged sufficiently and washed twice with staining buffer, then 10 μg/mL of PD-L1 antibody (558065) was added and incubated for 30 minutes in dark at 4°C. Cells were washed 3 times by centrifugation at 400 × g for 5 minutes and resuspended in 500 μL of ice-cold PBS. Cells were kept in the dark at 4°C in a fridge before analyzing. The PD-L1 expression were analyzed using flow cytometry as soon as possible.
PD-L1 expression in cell lines by Western blot
Cells were lysed in radioimmunoprecipitation assay (RIPA) buffer with a Protease and Phosphatase Inhibitor Single-Use Cocktail (78443; Thermo Fisher Scientific, Waltham, MA, USA). Protein was separated by SDS–PAGE gel and immunoblotted with anti-human-PD-L1 antibody (R&D Systems, Minneapolis, MN, USA) and anti-GAPDH antibody (Abcam, Cambridge, UK). Specific proteins were visualized using Western ECL substrate (170–5060; Bio-Rad Laboratories, Hercules, CA, USA).
Tumor challenge and treatment experiments
The C57BL/6 female mice were bought from Beijing Vital River Laboratory Animal Technology Co., Ltd. (Beijing, China). Twenty mice received a subcutaneous injection of 1×10⁶ EL4-GFP cells in 0.2 mL pure RPMI–1640 into the right armpit (day 0). All the mice subsequently developed obvious T-cell lymphoma in 4 days. Once the tumor appeared, mice were randomly allocated to the two groups (n=10 each); the treatment group received an intratumoral injection of anti-PD1 (300 μg) twice weekly, and the control group received an intratumoral injection of PBS twice weekly. During the period of treatment, once the length of the tumor reached 20 mm, the mice were euthanized. After 4 weeks of treatment, when the control group had two mice left and the treatment group four left, study was terminated. All tumors were harvested. Fixed tumors were embedded in paraffin, sectioned (4 μm thickness) and stained with haematoxylin and eosin for histological observation.
PD-L1 expression, tumor-infiltrating T cell amount and evaluation of tumor-infiltrating immune cells (TIIC) in two groups by flow cytometry
Mice which had been transplanted with EL4 cells were euthanized. Tumors were divided in to two groups and were minced into tiny block and grinded to cell suspension. Cells were filtered through 70-um filter and harvested and adjusted to a concentration of 1×10⁶ cells/mL in staining buffer. They were then stained with mAbs (BD Bioscience) against mouse PD-L1 (564715), CD45 (553081), CD3 (745836), CD4 (563232), CD8 (561952), CD11b (552850) and Gr-1 (561103) for 30 minutes. Tumor cells were selected by gating GFP-positive cells, and the lymphocyte population was selected by gating GFP-negative and CD45-positive cells. The data were analyzed using Flow Jo software (Ashland, OR, USA). All flow cytometry experiments were performed at least two times.
Analysis of IFN-γ production by TIIC
To obtain TIIC, washed cells were isolated by sorting with GFP-negative and CD45-positive gated cells. TIIC harvested from the two groups of mice were then stimulated with 50 ng/mL phorbol 12-myristate 13-acetate (PMA) and 1 μg/mL ionomycin for 6 hours, then the IFN-γ secretion was analyzed in culture supernatants using mouse IFN-γ Quantikine ELISA Kit according to the manual (R&D systems).
PD-L1, p-JAK2 and p-STAT1 protein expression in immunohistochemistry after treatment
PD-L1 (D5V3B), p-JAK2 (Tyr 1007) and p-STAT1 (Tyr 701) protein expression was evaluated by immunohistochemistry analysis of paraffin-embedded tissues. Sections (4 μm) were cut from the paraffin blocks, blocked with 1% BSA and incubated with antibodies (PD-L1, p-JAK2, p-STAT1) (1:100 dilution) overnight at 4°C. The sections were then incubated with conjugated donkey anti-rabbit IgG for 1 hour, followed by nuclear counterstaining with haematoxylin.
Immunohistochemistry scoring
Final immunohistochemistry score was assessed by two scoring systems. One system was based on the level of antibody staining, with cells scored as 0 for no color, 1 for yellow, 2 for brown-yellow or 3 for dark brown. The other scoring system was based on antibody reactivity among 100 cells, with data expressed as a percentage. Based on the proportion of positive cells, the samples were scored as 0 (0%–10%), 1 (11%–25%), 2 (26%–50%) or 3 (51%–100%). The scores from the above scoring systems were multiplied, and a score of 0 was considered negative (−), 1–2 as mild positive (+), 3–4 as positive (++) and >5 as strongly positive (+++). Any score >1 was considered positive. Based on the final score, scores from 0 to 2 were grouped as low expression with all other scores grouped as high expression.
Statistical analysis
All statistical analyses were performed using Prism 5.0 (Standford, CA, USA). Unpaired Student’s t-tests were used to assess significant differences between the control and treatment groups. P-values <0.05 were considered statistically significant. Protein levels assessed by Western blot were analyzed by Image Studio Lite software (Cambridge, UK).
Ethics statement
The animal protocol was approved by the Institutional Ethics Review Board of Zhengzhou University (approval number: 00014350) and compliance with the National Institutes of Health guide for the care and use of laboratory animals for the care and use of laboratory animals. The protocol of obtaining PBMCs from healthy donors has their confirmation through written informed consent and compliance with the Declaration of Helsinki. The use of the PBMCs was approved by the Institutional Ethics Review Board of the First Affiliated Hospital of Zhengzhou University (approval number: 0013856).
Results
NK/T cell lymphoma cell lines have higher PD-L1 expression than normal NK cells
NK cells were isolated and purified using magnetic separation method, with the isolation efficiency being satisfactory based on the flow cytometry confirmation using GFP-conjugated CD56 antibody (Figure 1A). NKTL cell lines, including NK92, KAI3, NKL, YT and SNK-6 cells, were compared to CD56+ normal NK cells. While 58% of normal NK cells were PD-L1 positive, the positivity of PD-L1 expression on all NKTL cell lines was almost 100% (P<0.05) (Figure 1B). As shown in Figure 1C, the protein expression of PD-L1 in NKTL cells was remarkably higher than that in normal NK cells. Following band densitometry quantification on the blot, the intensity of PD-L1 in all cell lysate samples was more than two-fold higher, compared to that in normal NK cell lysate (Figure 1D). Together, the above data clearly showed that the expression of PD-L1 is significantly enhanced in NKTL cells, in comparison to that in normal NK cells.
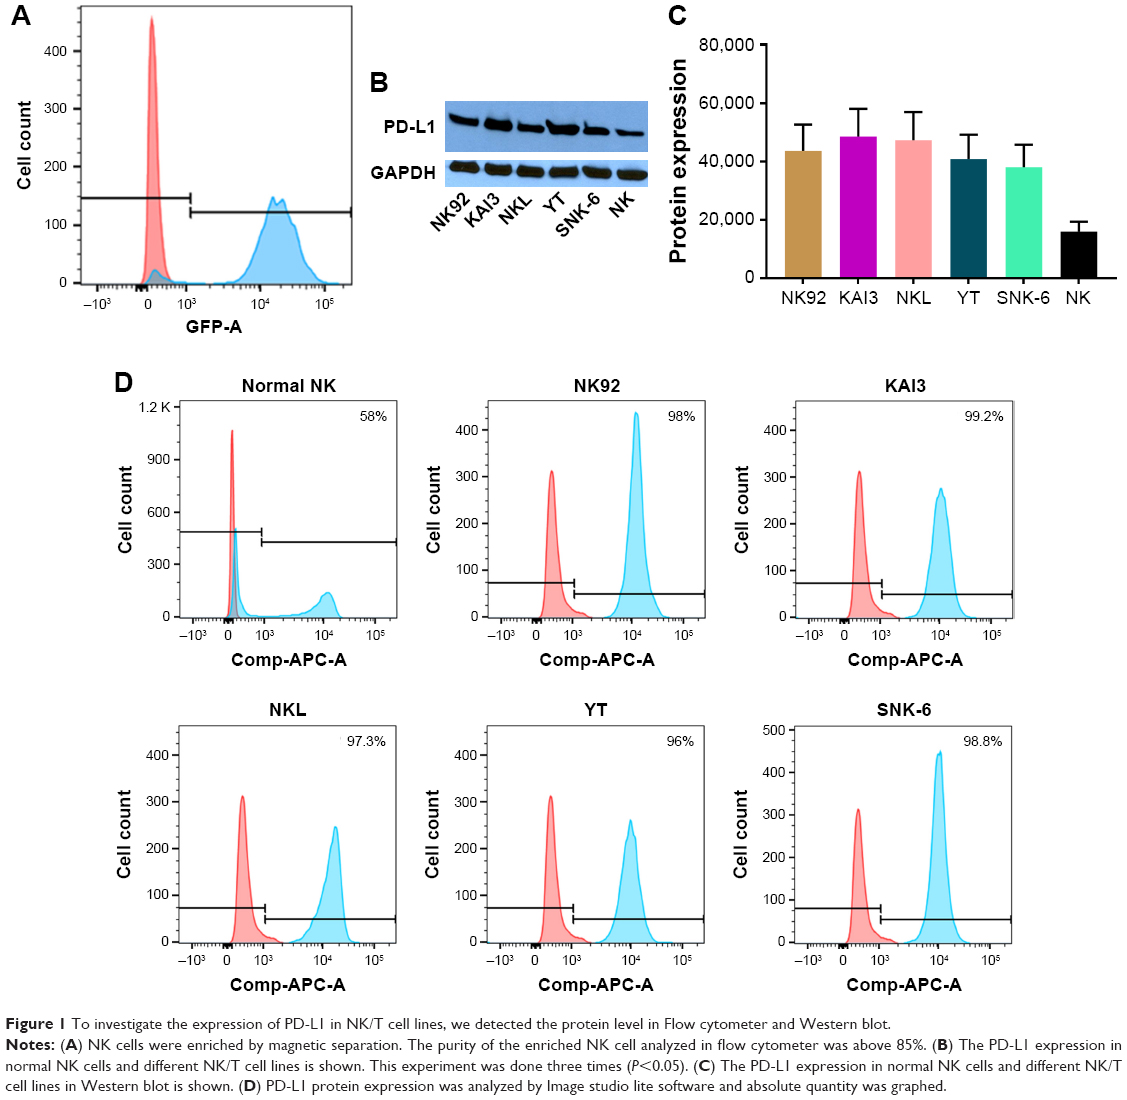 | Figure 1 To investigate the expression of PD-L1 in NK/T cell lines, we detected the protein level in Flow cytometer and Western blot. |
Anti-PD-1 treatment induces a durable antitumor effect
Since PD-L1 is expressed highly in NKTL cell lines, we evaluated the antitumor efficacy of anti-PD-1 on T cell lymphoma in vivo. Detailed treatment regimen is shown in Figure 2A. The formation of tumor volume was monitored. Overall survival curve was graphed and median survival time was calculated. Compared with control, the anti-PD1 treated group showed a modest tumor-suppressing activity, resulting in a significant increase in overall survival (1 month after tumor injection, Figure 2B). In addition, median survival time of mice in this group was longer than mice in control (Figure 2C, 28 days vs 20 days, P<0.05).
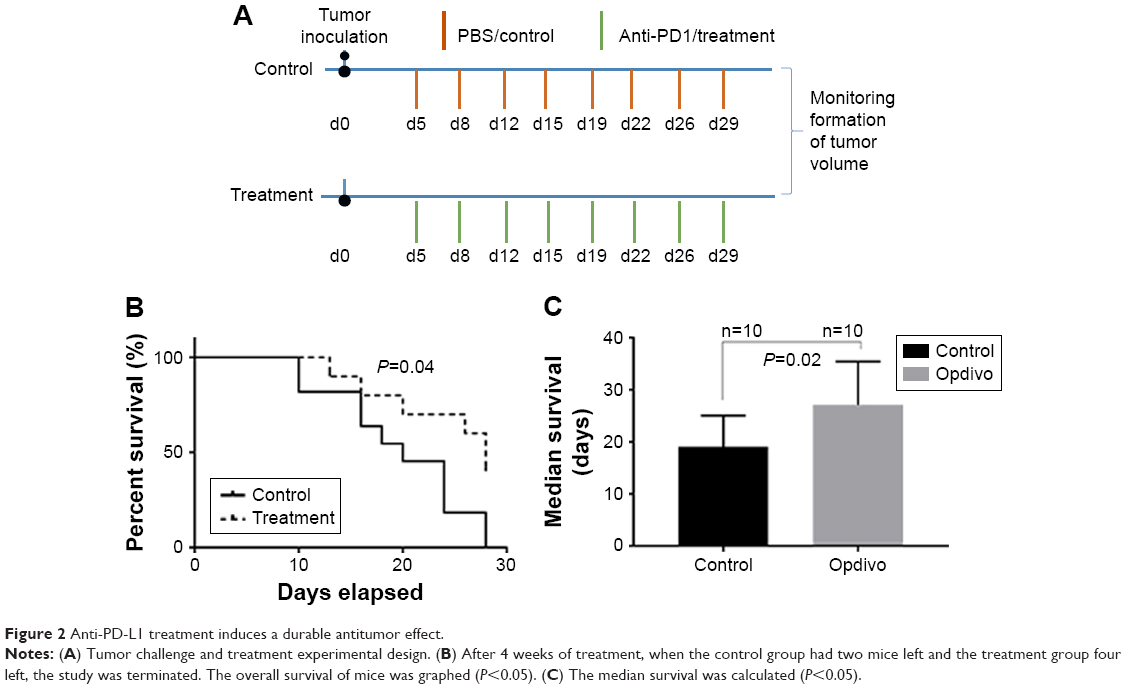 | Figure 2 Anti-PD-L1 treatment induces a durable antitumor effect. |
Anti-PD1 treatment significantly increases the amount of tumor-infiltrating T cells and ratios of both CD4 and CD8 T cells to Treg cells and MDSC
To explore the mechanisms of anti-PD-1 treatment, we analyzed the effects of anti-PD1 on tumor-infiltrating cells harvested from treated mice at the end of the experiment. Compared with control, anti-PD1 significantly increased the percentages of effector CD4+FoxP3− (12.75% vs 23.27%) and CD8+ T (8.05% vs 13.28%) cells and decreased the frequency of Treg cells, (4.73% vs 4.18%) and CD11b+GR-1+ MDSC (15.33% vs 9.03%) in tumor-infiltrating cells (Figure 3A–D) These remarkable differences in effector and immunosuppressive cells led to the significantly elevated ratios of both effector CD4+ and CD8+ T cells to Treg cells and MDSC in tumor-infiltrating cells of mice receiving anti-PD1 treatment (Figure 3E–H). The anti-PD1 treatment also increased the absolute number of total tumor-infiltrating T cell (data not shown).
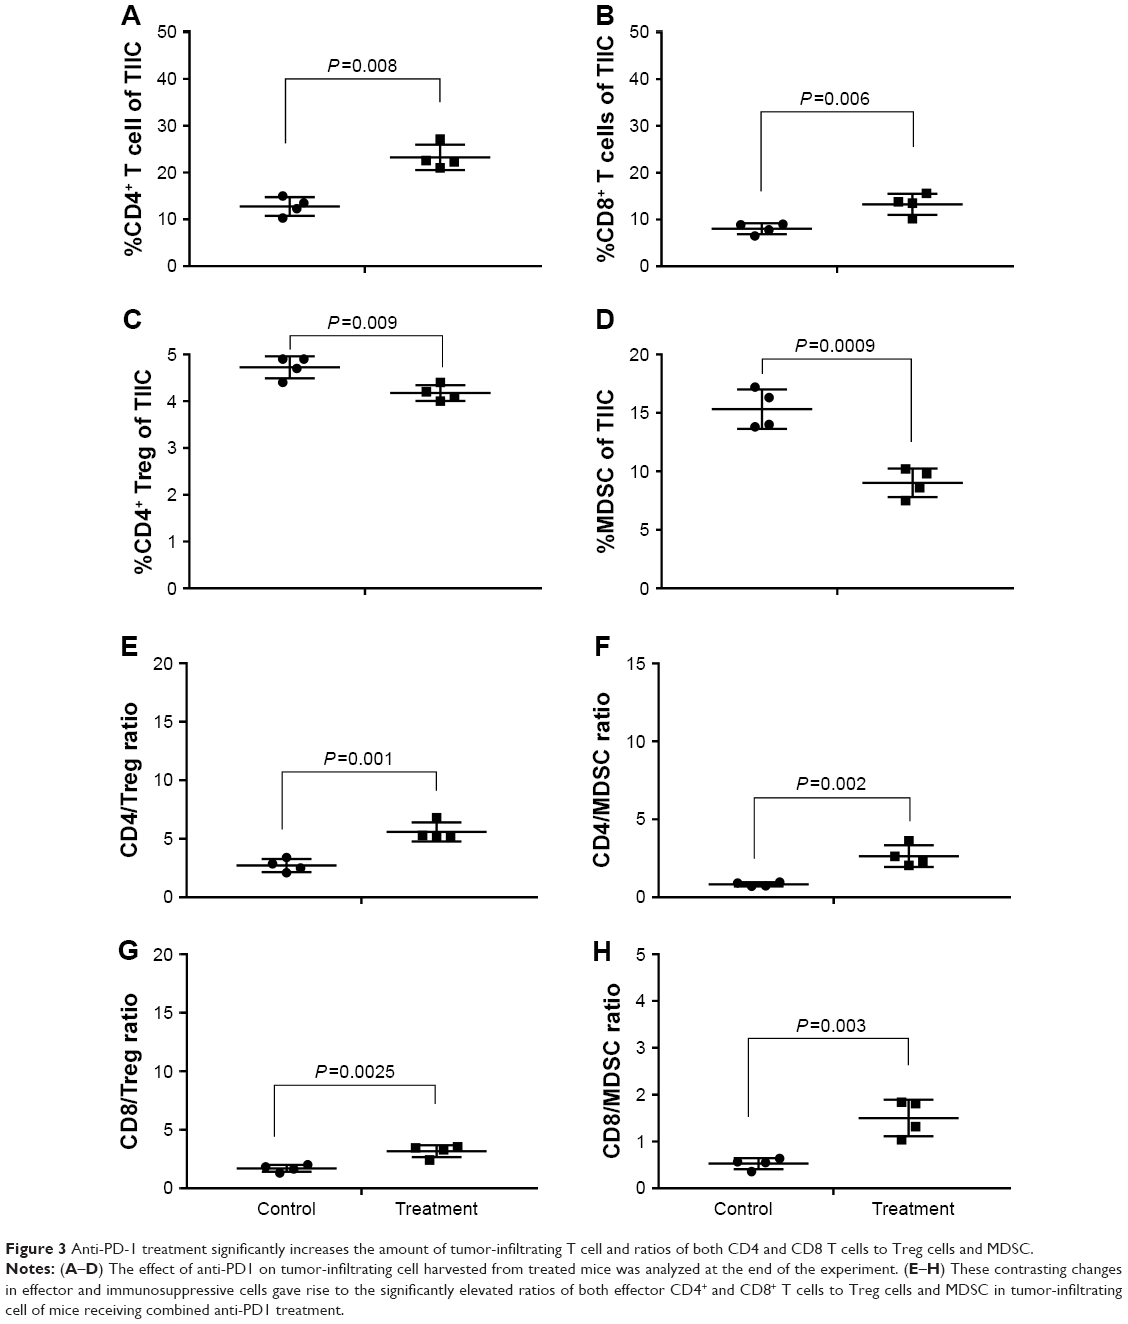 | Figure 3 Anti-PD-1 treatment significantly increases the amount of tumor-infiltrating T cell and ratios of both CD4 and CD8 T cells to Treg cells and MDSC. |
In vivo anti-PD1 treatment induced PD-L1 expression through IFN-γ associated with JAK-STAT pathway in EL4 tumors
As we observed, the PD-L1 expression was up-regulated in the treatment group (data not shown). At the end of the animal experiment, we harvested the tumor masses from mice treated with control or anti-PD1 and examined the IFN-γ level with ELISA.
The IFN-γ secretion by effector T cell in the treatment group was higher than the control group (Figure 4A; 120 vs 444.1 pg/mL; P<0.05). Herein, we sought to investigate the PD-L1, p-JAK2 and p-STAT1 protein expression using immunohistochemistry. PD-L1 and p-STAT1 were highly expressed in the treatment group and p-JAK2 was significantly expressed in treatment group (Figure 4B). Taken together, our results suggest that anti-PD1 treatment in vivo induces PD-L1 expression through IFN-γ associated with the JAK-STAT pathway in T cell lymphoma.
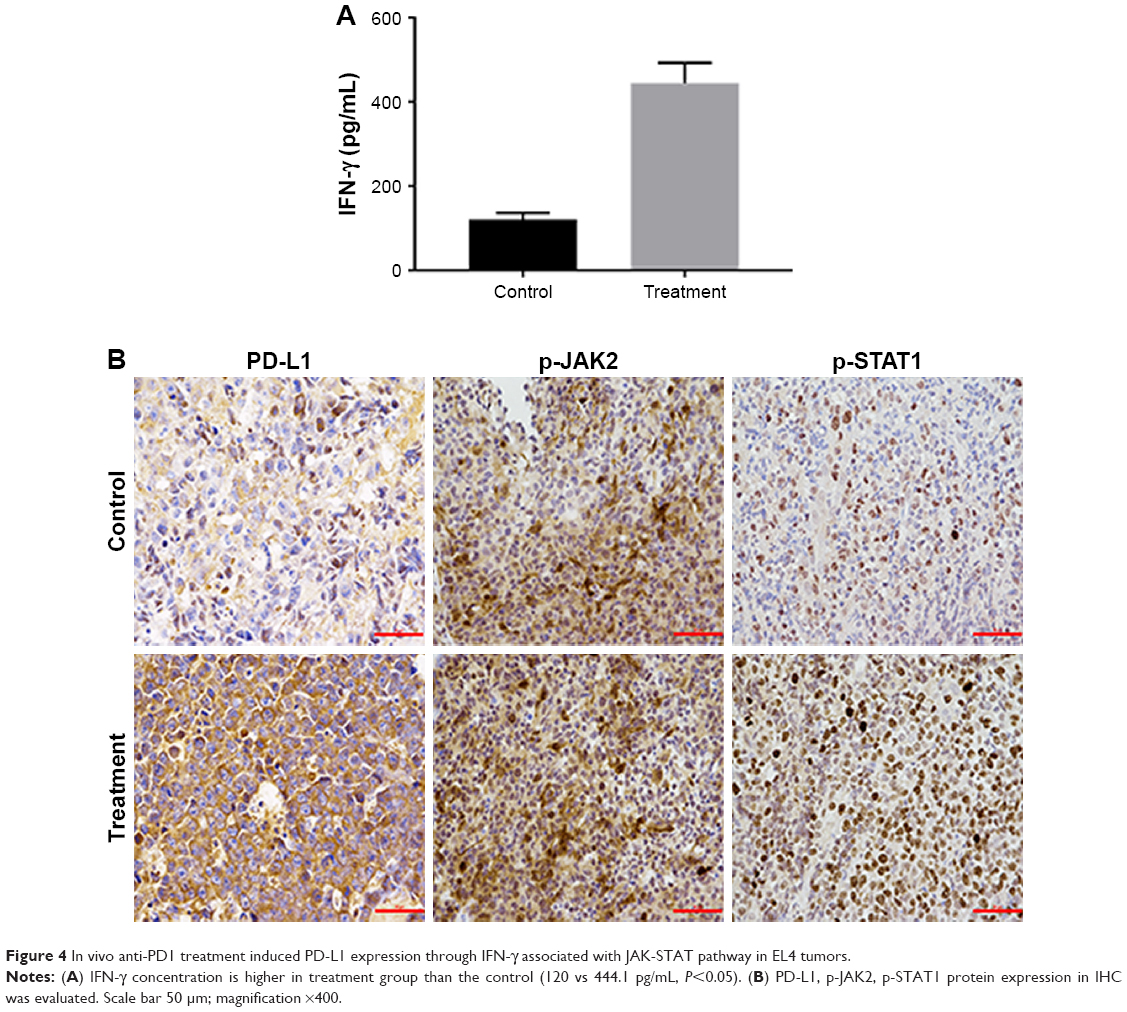 | Figure 4 In vivo anti-PD1 treatment induced PD-L1 expression through IFN-γ associated with JAK-STAT pathway in EL4 tumors. |
Discussion
Our findings suggest that anti-PD1 inhibits tumor progression in T-cell lymphoma in vivo and increases PD-L1 expression through IFN-γ associated with JAK-STAT pathway in T cell lymphoma.
Nagato et al11 evaluated the expression of PD-L1 in three NKTL cell lines and found that the PD-L1 protein was highly expressed in these lines compared with Raji cells. In this study, PD-L1 expression was detected in more NKTL cell lines compared with normal NK cell lines. In addition, in vivo study has shown that anti-PD1 inhibits tumor progression in T-cell lymphoma.
Despite the clinical efficiency of anti-PD1 or PD-L1 blockades in NKTL, fully detailed mechanisms related to the immune microenvironment has not been clarified. One research group retrospectively analyzed 128 patients and observed that the increasing number of absolute lymphocytes count (ALC) is a novel, favourable, prognostic index for NKTL.20 In ovarian cancer, IFN-γ from lymphocytes induced PD-L1 expression and promoted progression.21 In nasopharyngeal carcinoma, IFN-γ was independent of, but synergetic with, LMP1 in up-regulating PD-L1.22 We speculate that anti-PD1 treatment may induce tumor PD-L1 expression by IFN-γ release from effect or T cells in T cell lymphoma, namely by the adaptive resistance mechanism recently described.23,24
Similarly, in our study, anti-PD1 treatment increased the absolute number of total tumor-infiltrating T cells and improved the overall survival of mice with T cell lymphoma. Tumor cells can escape the supervision of the immune system, and the pathogenic mechanism of inducing Treg cells has been identified in cancer in addition to the pathogen-specific cytotoxic T cells.25
Many studies have shown the negative correlation between Treg cell level and patients’ survival. For instance, one meta-analysis has shown that higher Treg cell level was significantly associated with poor prognosis in terms of overall survival.26 Of 100 tumor specimens obtained from primary invasive breast carcinoma, higher Treg cell levels were significantly associated with poor overall survival.27 In addition, in patients with glioblastoma, increased proportion of Treg cells in tumor infiltrating lymphocytes is associated with tumor recurrence and reduced survival.
In spite of the negative correlation in most solid tumors, recent studies have shown higher level of Treg cells was associated with better survival in EBV associated malignancies, including nasopharyngeal carcinoma, EBV positive classical Hodgkin’s lymphoma and follicular lymphoma.28–30 Furthermore, a higher density of Treg cells correlated with better overall survival and longer progression-free survival (PFS) by univariate analysis.31
Interestingly, in our study, the anti-PD1 treatment group with lower ratio of Treg cells has a better survival. In a subset of patients with metastatic melanoma treated with checkpoint blockade anti-CTLA4 antibody (anti-CTLA4), the researchers found anti-CTLA4 predominantly inhibited Treg cells, thereby increasing the CD8 T-cell to Treg cell ratio.32 Our study shows that another checkpoint blockade anti-PD1 antibody may have a similar action.
PD-L1 expression has shown to be closely correlated to the tumor patients’ prognosis and possibility of relapses. It has been reported that PD-L1 expression is the only significant independent predictor for longer overall survival in patients with NKTL, and PD-L1 might be used as a novel prognostic marker.12 Another study has shown that high-sPD-L1 group of patients showed significantly poorer prognosis than the low-sPD-L1 group in NKTL and the levels of serum sPD-L1 in patients positively correlated with the expression of PD-L1 in lymphoma cells of tumor tissues.11 No matter what different opinions exist on the correlation between the PD-L1 expression and NKTL prognosis, knockdown of PD-L1 has been shown to down-regulate tumor proliferation, tumor growth and cell cycle progression, as well as tumor invasion ability. Down-regulating the expression of PD-L1 by using shRNAi-PD-L1 on tumor cells, not only prevents tumor escape from killing by activated T cells, but also inhibits the oncogenesis of lymphoma.33
In the process of detecting the infiltrating T cell number, we checked the PD-L1 expression in tumor suspension and found that the PD-L1 expression was up-regulated after anti-PD1 treatment. IFN-γ secreted by tumor-infiltrating T cells can induce PD-L1 expression by stimulating the JAK/STAT signaling pathway in myeloid leukemia cells.34 PD-L1 expression is mainly regulated by IFN-γ, which is associated with JAK-STAT pathway in gastric cancer.35 IFN-γ secreted by CD8-positive lymphocytes upregulates PD-L1 on ovarian cancer cells and promotes tumor growth.21 The in vitro study in canine hepatocellular carcinoma and myelolipoma cells showed that IFN-γ production was enhanced in the infiltrated cells after PD-L1 monoclonal antibody treatment.36
Here, we also report that PD-L1 expression is related to the activation of JAK-STAT signaling pathway, which indicates the possibility of JAK-STAT pathway inhibition in PD-L1 down-regulation. The in vitro and in vivo study in pancreatic tumors shows that the inhibition of the JAK-STAT signaling pathway decreases tumor cell PD-L1 expression and the JAK1/JAK2 inhibitor ruxolitinib can prevent systemic inflammation in the tumor microenvironment and upregulate CTL infiltration and activation to overcome pancreatic cancer resistance to anti-PD-1 immunotherapy.37 Combination of precision medicine and immunotherapy takes individual variability into account in order to design personalized treatment strategies.7 In future, more studies on JAK pathway inhibitors as well as anti-PD1 will be conducted synergistically in NKTL.
Conclusion
Anti-PD1 inhibits tumor progression in T-cell lymphoma in vivo and may up-regulate PD-L1 expression through IFN-γ associated with JAK-STAT pathway. JAK pathway inhibitors as well as anti-PD1 may work synergistically by preventing IFN-γ induced PD-L1 expression in NKTL.
Acknowledgments
This study was supported by the National Natural Science Foundation of China (Grant No 81570203) and the Project of Innovative Talents of Henan Province, China (Grant No 154200510023).
Author contributions
All authors contributed toward data analysis, drafting and revising the paper, gave final approval of the version to be published and agree to be accountable for all aspects of the work.
Disclosure
The authors report no conflicts of interest in this work.
References
Schmitz N, Trümper L, Ziepert M, et al. Treatment and prognosis of mature T-cell and NK-cell lymphoma: an analysis of patients with T-cell lymphoma treated in studies of the German high-grade non-Hodgkin lymphoma Study Group. Blood. 2010;116(18):3418–3425. | ||
Muenst S, Soysal SD, Tzankov A, Hoeller S. The PD-1/PD-L1 pathway: biological background and clinical relevance of an emerging treatment target in immunotherapy. Expert Opin Ther Targets. 2015;19(2):201–211. | ||
Jia L, Xi Q, Wang H, et al. miR-142-5p regulates tumor cell PD-L1 expression and enhances anti-tumor immunity. Biochem Biophys Res Commun. 2017;488(2):425–431. | ||
Hamada N, Yanagihara T, Suzuki K, et al. Treatment with a programmed cell death-1-specific antibody has little effect on afatinib- and naphthalene-induced acute pneumonitis in mice. Biochem Biophys Res Commun. 2017;491(3):656–661. | ||
Brahmer JR, Drake CG, Wollner I, et al. Phase I study of single-agent anti-programmed death-1 (MDX-1106) in refractory solid tumors: safety, clinical activity, pharmacodynamics, and immunologic correlates. J Clin Oncol. 2010;28(19):3167–3175. | ||
Kiyasu J, Miyoshi H, Hirata A, et al. Expression of programmed cell death ligand 1 is associated with poor overall survival in patients with diffuse large B-cell lymphoma. Blood. 2015;126(19):2193–2201. | ||
Ishiba T, Hoffmann A-C, Usher J, et al. Frequencies and expression levels of programmed death ligand 1 (PD-L1) in circulating tumor RNA (ctRNA) in various cancer types. Biochem Biophys Res Commun. 2018;500(3):621–625. | ||
Muenst S, Hoeller S, Willi N, Dirnhofera S, Tzankov A. Diagnostic and prognostic utility of PD-1 in B cell lymphomas. Dis Markers. 2010;29(1):47–53. | ||
Chen BJ, Chapuy B, Ouyang J, et al. PD-L1 expression is characteristic of a subset of aggressive B-cell Lymphomas and virus-associated malignancies. Clin Cancer Res. 2013;19(13):3462–3473. | ||
Bryan LJ, Gordon LI. Pidilizumab in the treatment of diffuse large B-cell lymphoma. Expert Opin Biol Ther. 2014;14(9):1361–1368. | ||
Nagato T, Ohkuri T, Ohara K, et al. Programmed death-ligand 1 and its soluble form are highly expressed in nasal natural killer/T-cell lymphoma: a potential rationale for immunotherapy. Cancer Immunol Immunother. 2017;66(7):877–890. | ||
Kim WY, Jung HY, Nam SJ, et al. Expression of programmed cell death ligand 1 (PD-L1) in advanced stage EBV-associated extranodal NK/T cell lymphoma is associated with better prognosis. Virchows Arch. 2016;469(5):581–590. | ||
Guo Z, Wang H, Meng F, Li J, Zhang S. Combined trabectedin and anti-PD1 antibody produces a synergistic antitumor effect in a murine model of ovarian cancer. J Transl Med. 2015;13(1):247. | ||
Min L, Hodi FS. Anti-PD1 following ipilimumab for mucosal melanoma: durable tumor response associated with severe hypothyroidism and rhabdomyolysis. Cancer Immunol Res. 2014;2(1):15–18. | ||
De Marinis F, Passaro A. [Nivolumab in second-line treatment of squamous non-small cell lung cancer.]. Recenti Prog Med. 2016;107(12):634–640. Italian. | ||
Lin K, Cheng J, Yang T, Li Y, Zhu B. EGFR-TKI down-regulates PD-L1 in EGFR mutant NSCLC through inhibiting NF-κB. Biochem Biophys Res Commun. 2015;463(1–2):95–101. | ||
Carbotti G, Barisione G, Airoldi I, et al. IL-27 induces the expression of IDO and PD-L1 in human cancer cells. Oncotarget. 2015;6(41):43267–43280. | ||
Doi T, Ishikawa T, Okayama T, et al. The JAK/STAT pathway is involved in the upregulation of PD-L1 expression in pancreatic cancer cell lines. Oncol Rep. 2017;37(3):1545–1554. | ||
Chen J, Feng Y, Lu L, et al. Interferon-γ-induced PD-L1 surface expression on human oral squamous carcinoma via PKD2 signal pathway. Immunobiology. 2012;217(4):385–393. | ||
Huang JJ, Jiang WQ, Lin TY, et al. Absolute lymphocyte count is a novel prognostic indicator in extranodal natural killer/T-cell lymphoma, nasal type. Ann Oncol. 2011;22(1):149–155. | ||
Abiko K, Matsumura N, Hamanishi J, et al. IFN-γ from lymphocytes induces PD-L1 expression and promotes progression of ovarian cancer. Br J Cancer. 2015;112(9):1501–1509. | ||
Fang W, Zhang J, Hong S, et al. EBV-driven LMP1 and IFN-γ up-regulate PD-L1 in nasopharyngeal carcinoma: implications for oncotargeted therapy. Oncotarget. 2014;5(23):12189–12202. | ||
Taube JM, Anders RA, Young GD, et al. Colocalization of inflammatory response with B7-H1 expression in human melanocytic lesions supports an adaptive resistance mechanism of immune escape. Sci Transl Med. 2012;4(127):127ra37. | ||
Zhou J, Gong Z, Jia Q, et al. Programmed death ligand 1 expression and CD8+ tumor-infiltrating lymphocyte density differences between paired primary and brain metastatic lesions in non-small cell lung cancer. Biochem Biophys Res Commun. 2018;498(4):751–757. | ||
Wang RF. Immune suppression by tumor-specific CD4+ regulatory T-cells in cancer. Semin Cancer Biol. 2006;16(1):73–79. | ||
Shou J, Zhang Z, Lai Y, Chen Z, Huang J. Worse outcome in breast cancer with higher tumor-infiltrating FOXP3+ Tregs: a systematic review and meta-analysis. BMC Cancer. 2016;16(1):687. | ||
Takenaka M, Seki N, Toh U, et al. FOXP3 expression in tumor cells and tumor-infiltrating lymphocytes is associated with breast cancer prognosis. Mol Clin Oncol. 2013;1(4):625–632. | ||
Zhang YL, Li J, Mo HY, et al. Different subsets of tumor infiltrating lymphocytes correlate with NPC progression in different ways. Mol Cancer. 2010;9(1):4. | ||
Alvaro T, Lejeune M, Salvadó MT, et al. Outcome in Hodgkin’s lymphoma can be predicted from the presence of accompanying cytotoxic and regulatory T cells. Clin Cancer Res. 2005;11(4):1467–1473. | ||
Tzankov A, Meier C, Hirschmann P, et al. Correlation of high numbers of intratumoral Foxp3+ regulatory T cells with improved survival in germinal center-like diffuse large B-cell lymphoma, follicular lymphoma and classical Hodgkin’s lymphoma. Haematologica. 2008;93(2):193–200. | ||
Peng RJ, Huang ZF, Zhang YL, et al. Circulating and tumor-infiltrating Foxp3+ regulatory T cell subset in Chinese patients with extranodal NK/T cell lymphoma. Int J Biol Sci. 2011;7(7):1027–1036. | ||
Twyman-Saint Victor C, Rech AJ, Maity A, et al. Radiation and dual checkpoint blockade activate non-redundant immune mechanisms in cancer. Nature. 2015;520(7547):373–377. | ||
Li Y, Wang J, Li C, Ke X-Y. Contribution of PD-L1 to oncogenesis of lymphoma and its RNAi-based targeting therapy. Leukemia. 2012;53(10):2015–2023. | ||
Moon JW, Kong S-K, Kim BS, et al. IFNγ induces PD-L1 overexpression by JAK2/STAT1/IRF-1 signaling in EBV-positive gastric carcinoma. Sci Rep. 2017;7(1):17810. | ||
Mimura K, Teh JL, Okayama H, et al. PD-L1 expression is mainly regulated by interferon gamma associated with JAK-STAT pathway in gastric cancer. Cancer Sci. 2018;109(1):43–53. | ||
Maekawa N, Konnai S, Ikebuchi R, et al. Expression of PD-L1 on canine tumor cells and enhancement of IFN-γ production from tumor-infiltrating cells by PD-L1 blockade. PLoS One. 2014;9(6):e98415. | ||
Lu C, Talukder A, Savage NM, Singh N, Liu K. JAK-STAT-mediated chronic inflammation impairs cytotoxic T lymphocyte activation to decrease anti-PD-1 immunotherapy efficacy in pancreatic cancer. Oncoimmunology. 2017;6(3):e1291106. |
 © 2019 The Author(s). This work is published and licensed by Dove Medical Press Limited. The
full terms of this license are available at https://www.dovepress.com/terms
and incorporate the Creative Commons Attribution
- Non Commercial (unported, 3.0) License.
By accessing the work you hereby accept the Terms. Non-commercial uses of the work are permitted
without any further permission from Dove Medical Press Limited, provided the work is properly
attributed. For permission for commercial use of this work, please see paragraphs 4.2 and 5 of our Terms.
© 2019 The Author(s). This work is published and licensed by Dove Medical Press Limited. The
full terms of this license are available at https://www.dovepress.com/terms
and incorporate the Creative Commons Attribution
- Non Commercial (unported, 3.0) License.
By accessing the work you hereby accept the Terms. Non-commercial uses of the work are permitted
without any further permission from Dove Medical Press Limited, provided the work is properly
attributed. For permission for commercial use of this work, please see paragraphs 4.2 and 5 of our Terms.