Back to Journals » International Journal of Chronic Obstructive Pulmonary Disease » Volume 12
Anti-p-benzoquinone antibody level as a prospective biomarker to identify smokers at risk for COPD
Authors Banerjee S, Bhattacharyya P ![]() , Mitra S, Kundu S, Panda S, Chatterjee IB
, Mitra S, Kundu S, Panda S, Chatterjee IB
Received 10 February 2017
Accepted for publication 8 May 2017
Published 21 June 2017 Volume 2017:12 Pages 1847—1856
DOI https://doi.org/10.2147/COPD.S134455
Checked for plagiarism Yes
Review by Single anonymous peer review
Peer reviewer comments 2
Editor who approved publication: Prof. Dr. Richard Russell
Santanu Banerjee,1 Parthasarathi Bhattacharyya,2 Subhra Mitra,3 Somenath Kundu,4 Samiran Panda,5 Indu B Chatterjee1
1Department of Biotechnology and Dr B C Guha Centre for Genetic Engineering and Biotechnology, University College of Science and Technology, University of Calcutta, 2Institute of Pulmocare and Research, 3Department of Pulmonary Medicine, Calcutta National Medical College, 4Department of Chest Medicine, Institute of Post Graduate Medical Education and Research, 5National Institute of Cholera and Enteric Diseases, Kolkata, India
Background and objective: Identification of smokers having predisposition to COPD is important for early intervention to reduce the huge global burden of the disease. Using a guinea pig model, we have shown that p-benzoquinone (p-BQ) derived from cigarette smoke (CS) in the lung is a causative factor for CS-induced emphysema. p-BQ is also derived from CS in smokers and it elicits the production of anti-p-BQ antibody in humans. We therefore hypothesized that anti-p-BQ antibody might have a protective role against COPD and could be used as a predictive biomarker for COPD in smokers. The objective of this study was to compare the serum anti-p-BQ antibody level between smokers with and without COPD for the evaluation of the hypothesis.
Methods: Serum anti-p-BQ antibody concentrations of current male smokers with (n=227) or without (n=308) COPD were measured by an indirect enzyme-linked immunoabsorbent assay (ELISA) developed in our laboratory. COPD was diagnosed by spirometry according to Global Initiative for Chronic Obstructive Lung Disease (GOLD) guidelines.
Results and discussion: A significant difference was observed in the serum anti-p-BQ antibody level between smokers with and without COPD (Mann–Whitney U-test =4,632.5, P=0.000). Receiver operating characteristic (ROC) curve analysis indicated that the ELISA had significant precision (area under the curve [AUC] =0.934, 95% confidence interval [CI]: 0.913–0.935) for identifying smokers with COPD from their low antibody level. The antibody cutoff value of 29.4 mg/dL was constructed from the ROC coordinates to estimate the risk for COPD in smokers. While 90.3% of smokers with COPD had a low antibody value (≤29.4 mg/dL), the majority (86.4%) of smokers without COPD had a high antibody value (>29.4 mg/dL); 13.6% of current smokers without COPD having an antibody level below this cutoff value (odds ratio [OR] =59.3, 95% CI: 34.15–101.99) were considered to be at risk for COPD.
Conclusion and future directions: Our results indicate that serum anti-p-BQ antibody level may be used as a biomarker to identify asymptomatic smokers at risk for COPD for early intervention of the disease.
Keywords: COPD, cigarette smoke, biomarker, anti-p-benzoquinone antibody, enzyme-linked immunosorbent assay (ELISA)
Introduction
COPD is currently the fourth leading cause of death worldwide.1 In 2015, about 3 million deaths were caused by this disease, and it was almost 5% of all deaths that globally occurred in that year.2 It is predicted that COPD will cause 7.8% of global deaths by 2030.3 Besides mortality, COPD results in morbidity and productivity loss, in addition to presenting a great burden to both individual patients and the health care system. COPD is projected to be the seventh leading cause of disability-adjusted life year (DALY) in 2030.3 Unfortunately, none of the current therapies can alter the natural history of the disease and prolong survival.4
COPD is initially insidious in most patients without any apparent symptom. The diagnosis is typically missed or delayed until the condition reaches advanced stages.5 The most important risk factor for COPD is cigarette smoking, which accounts for approximately 90% of cases.6 There are more than 1 billion smokers in the world.7 It is not known which smokers will develop COPD in the future. Although about 15%–20% of smokers are diagnosed as having COPD, far more smokers remain undiagnosed apparently due to lack of awareness and knowledge about the disease, as well as due to misdiagnosis.8,9 The quality of life of these smokers is often poor and, in many cases, the patients die of the disease or its complications. To our knowledge, there is no current method to identify asymptomatic smokers at risk for COPD. This indicates the importance of finding a biomarker for identifying the subpopulation in whom early intervention/prevention strategies could be targeted.
A large number of biomarkers in exhaled breath, induced sputum, bronchoalveolar lavage fluid (BAL), lung biopsies and blood, including plasma fibrinogen, have been evaluated in COPD.4,10–12 These biomarkers are useful for determining the stage and severity of the disease but not for identifying a smoker susceptible to COPD. In addition, specific gene(s) responsible for enhanced risk and increased susceptibility to COPD remain(s) poorly understood. The best-described genetic factor in COPD is a deficiency in α1-antitrypsin, but this abnormality accounts for only 1%–2% of all COPD cases.13
Until now, spirometry remains the only reliable, simple and noninvasive test to diagnose COPD.5,14 However, spirometry is usually used as a diagnostic test for determining the staging and status of the patients and not for smokers without any clinical symptoms.
Although smoking is a predominant cause for COPD, the molecular mechanism of the disease has remained unclear. We have shown that p-benzoquinone (p-BQ) derived from cigarette smoke (CS) is a causative factor of CS-induced emphysema in a guinea pig model.15,16 p-BQ is not present in CS. It is produced in the lung from p-benzosemiquinone (p-BSQ) of smoke, a long-lived radical, by disproportionation and oxidation by transition metal-containing proteins.15,16 The smoke of both commercial cigarettes and Kentucky research cigarettes contains substantial amounts (100–200 μg) of p-BSQ. p-BQ is also derived from CS in human smokers.17 It is therefore conceivable that p-BQ is a causative factor for COPD in smokers. Since p-BQ elicits the production of anti-p-BQ antibody in humans,18 we considered that anti-p-BQ antibody might have a pivotal role in inactivating p-BQ in smokers. We postulated that smokers with COPD would lack anti-p-BQ antibody, and conversely, that smokers without COPD would have high levels of the antibody. We hypothesized that anti-p-BQ antibody may be used as a biomarker to predict risk for COPD in asymptomatic smokers. Using an indirect enzyme-linked immunosorbent assay (ELISA) developed in our laboratory, we vindicated our hypothesis by measuring anti-p-BQ antibody in the sera of a cohort of smokers with COPD and smokers without COPD.
Methods
Study design
The study was designed to measure anti-p-BQ antibody in the sera of smokers with COPD and smokers without COPD. The participants were selected from two sources: 1) the Institute of Pulmocare and Research, Kolkata; and 2) the Department of Chest Medicine, Calcutta National Medical College, Kolkata. Informed consent was obtained from all the participants. All the participants were male, aged between 45 and 75 years. Only current smokers were included. Any person with uncontrolled diabetes, malnutrition, known HIV seropositive status, or taking immunosuppressive drugs or on systemic steroid therapy was excluded. A detailed questionnaire was completed for each individual for getting information on age, average number of cigarettes smoked daily and the number of years of smoking. COPD patients with active, or a history of, exacerbations in the preceding 6 weeks, as well as those with overt systemic disease or organ dysfunction, such as heart failure or overt kidney disease, were excluded. The body mass index (BMI) of each subject was measured. COPD was diagnosed by postbronchodilator spirometry following the American Thoracic Society (ATS) guideline. Spirometry was performed between 10 and 15 minutes after 400 μg of salbutamol was delivered via a metered-dose inhaler. Forced expiratory volume in 1 second (FEV1) and forced vital capacity (FVC), as well as their ratio (FEV1/FVC), were determined. COPD was diagnosed in subjects having a ratio of FEV1/FVC <0.7, according to the Global Initiative for Chronic Obstructive Lung Disease (GOLD) standard.14 The study was approved by, 1) the Institute of Pulmocare and Research, Kolkata, 2) the Department of Chest Medicine, Calcutta National Medical College, Kolkata, and 3) the Institutional Bioethics Committee for Human Research Studies, University of Calcutta.
Collection of blood
Blood samples were collected from current smokers with and without COPD at, 1) the Institute of Pulmocare and Research, Kolkata, and 2) the Department of Chest Medicine, Calcutta National Medical College, Kolkata, on the same day or within the week during which the lung function test was performed and BMI was measured. Sera separated from blood were transported in ice-cold condition to the Biotechnology Laboratory of the University of Calcutta on the same day and either assayed immediately or preserved at −80°C until assayed.
Preparation of p-BQ–human serum albumin (HSA) conjugate
A solution of 10 mg HSA (lipid free; Sigma Life Science; St Louis, Missouri, USA) in 500 μL of 20 mM potassium phosphate buffer, pH 7.4, was mixed with a solution of 1 mg p-BQ (Sigma-Aldrich) in 500 μL of the same buffer and incubated at 37°C for 2 hours. Then, the mixture was diluted further by adding 1,000 μL of the same buffer and dialyzed in a 10 kD cutoff dialysis tubing (SnakeSkin®; Thermo Scientific) overnight at 4°C in the same buffer. Final concentration of the conjugated protein was 5 μg/μL in the molar ratio of HSA: p-BQ of 1:60.
Measurement of serum anti-p-BQ antibody by indirect ELISA
An indirect ELISA test was implemented for the measurement of anti-p-BQ antibody in human serum. Diluted (1:1,000) human serum samples from smokers with COPD and smokers without COPD were added in triplicate to the same microtiter plate randomly. The researcher who performed the test was unaware of the clinical characteristics of the samples. Freshly prepared HSA:p-BQ (molar ratio 1:60) conjugated protein was used as the coating antigen. Cold (4°C) 1× phosphate-buffered saline (1× PBS) of pH 7.4 was used as the coating buffer, blocking buffer, serum diluent and secondary antibody diluent. For each intermediate wash step, 300 μL of washing buffer (0.1%, v/v, Tween-20 in 1× PBS, pH 7.4) was used to wash each well for 1 minute. Cold (4°C) 0.1 M citric acid buffer, pH 4.5, containing freshly dissolved 1 mg/mL o-phenylenediamine (o-PDA; Sigma Life Science) and 1 μL H2O2/mL, was used as the detection reagent.
The wells of the ELISA plates (96 well, Nunc-Immuno™ plate; Thermo Scientific, Suzhou, China) were coated with 100 ng HSA:p-BQ conjugate in coating buffer (1× PBS, pH 7.4). The coated ELISA plates were wrapped in plastic wrap and aluminum foil and incubated overnight at 4°C. After washing the wells four times with washing buffer, 300 μL of blocking buffer containing 1% (w/v) bovine serum albumin (Sigma) was added to each well and incubated for 2.5 hours at 4°C. Wells were washed six times with washing buffer, followed by the application of 100 μL diluted (1:1,000 dilution in 1× PBS, pH 7.4) human serum to the antigen-coated wells. Several wells per ELISA plate received 100 μL of 1× PBS (pH 7.4) instead of human serum at this step (reaction control wells). Subsequently, wells were incubated for 1.5 hours at 4°C. The wells were then washed six times with washing buffer, followed by addition of 100 μL horseradish peroxidase (HRP)-conjugated anti-human immunoglobulin G (IgG) secondary antibody (Promega Corporation, Fitchburg, WI, USA; raised in goat) diluted (1:5,000) with diluent buffer (1× PBS, pH 7.4). After an incubation period of 1 hour at 4°C, the wells were washed six times with washing buffer, and 100 μL of detection reagent was added to each well and incubated for 10 minutes in the dark at room temperature. The reaction was stopped by adding 100 μL stop solution (2 M orthophosphoric acid), and the absorbance was measured at 490 nm using a microplate reader (VersaMax microplate reader, equipped with Soft Max® Pro5 software; Molecular Devices). The mean of the absorbance (at 490 nm) values of each serum sample and that of the reaction controls on each plate were recorded. Actual absorbance at 490 nm (A490) of a sample assayed on a particular ELISA plate was obtained by subtracting the mean absorbance (at 490 nm) of the reaction controls of that plate from the mean absorbance (at 490 nm) of that sample. This absorbance value was used to quantify the serum anti-p-BQ antibody concentration (in milligrams per deciliter) from the standard curve equation.
Quantitative expression of ELISA absorbance values (A490) in terms of serum anti-p-BQ antibody level
Another ELISA assay was also carried out to obtain a standard curve for measuring anti-p-BQ antibody concentration in milligrams per deciliter serum from the absorbance at 490 nm (A490). The procedure was similar to the indirect ELISA method described in the ‘Measurement of serum anti-p-BQ antibody by indirect ELISA’ section. HSA-p-BQ conjugate (in the molar ratio of 1:60) was used as the antigen, and rabbit polyclonal anti-p-BQ antibody was used instead of human serum. Various concentrations of rabbit polyclonal anti-p-BQ antibody (custom made; Abexome Biosciences, Bangalore, India; raised in rabbit after immunization with p-BQ-bovine serum albumin conjugate) were added in triplicate to 100 ng HSA:p-BQ-coated wells of the microtiter plate, and the absorbance at 490 nm was measured. The mean of the absorbance values at 490 nm of each standard concentration of rabbit polyclonal anti-p-BQ antibody and that of reaction controls on each plate were recorded. The actual absorbance at 490 nm (A490) of rabbit polyclonal anti-p-BQ antibody was obtained by subtracting the mean absorbance of reaction controls from the mean absorbance of different concentrations of rabbit polyclonal anti-p-BQ antibody. The actual absorbance at 490 nm (A490) was plotted against the amount (in nanograms) of anti-p-BQ antibody. The absorbance (A490) was proportional to the amount of anti-p-BQ antibody (Figure S1). Using the equation obtained from the standard curve (A490 =0.011× amount of anti p-BQ antibody in nanograms), the absorbance values at 490 nm (A490) obtained from the serum of smokers with and without COPD were converted to milligrams of anti-p-BQ antibody per deciliter serum.
Statistical analysis
Distributions of all the variables were assessed for normality by using the Shapiro–Wilk test. Comparison of continuous variables that were not normally distributed was conducted by the Mann–Whitney U-test. Statistical significance was considered as P<0.05. Spearman’s correlation was used to examine the bivariate association of different parameters with serum anti-p-BQ antibody concentration. The receiver operating characteristic (ROC) curve was constructed, wherein the test variable was concentration of anti-p-BQ antibody and it was continuous in nature, and the state variable was dichotomized as COPD present or absent. Low value of anti-p-BQ antibody was assessed for its potential association with COPD diagnosis. In order to compare participants with respect to cutoff value of serum anti-p-BQ antibody and disease status (with or without COPD) simultaneously, we used the chi-square test. Odds ratios (OR) and corresponding 95% confidence intervals (CIs) were estimated for this comparison. Binary logistic regression was performed to obtain adjusted OR. IBM SPSS Statistics for Windows, version 20.0 (IBM Corporation, Armonk, NY, USA) was used for data analysis.
Results
Study participants
In total, 535 participants (308 smokers without COPD, and 227 smokers with COPD), aged between 45 and 75 years, were included in our study after fulfilling the inclusion criteria, as mentioned in the “Study design” under “Methods” section. The mean (± SD) age and mean (± SD) BMI of the participants were 59.4±8.1 years and 21.8±3.3 kg/m2, respectively. Diagnosis of COPD was confirmed by spirometric outcome according to GOLD guidelines, as described in the “Methods” section. Briefly, individuals with postbronchodilator FEV1/FVC ratio <0.70 were considered to have COPD and postbronchodilator FEV1/FVC ratio ≥0.70 to be without COPD.
Comparison between smokers with COPD and smokers without COPD
Distribution of attributes, such as age, BMI, pack-years of smoking, postbronchodilator FEV1 (% predicted), postbronchodilator FEV1/FVC (%) and serum anti-p-BQ antibody level (milligrams per deciliter of serum), was compared between smokers with COPD and smokers without COPD. The results are given in Table 1. Smokers with COPD had higher values for age (mean ± SD: 60.9±7.5 years) compared to smokers without COPD (mean ± SD: 58.3±8.3 years). The mean values (± SD) of BMI of smokers with COPD and smokers without COPD were 21.9±3.1 kg/m2 and 21.7±3.4 kg/m2, respectively. The mean values (± SD) of FEV1 (% predicted) in smokers with COPD and smokers without COPD were 56.27±13.60 and 90.11±10.32, respectively. The mean values (± SD) of FEV1/FVC (%) in smokers with COPD and smokers without COPD were 60.19%±7.52% and 80.58%±5.43%, respectively. Smokers with COPD had higher pack-years of smoking (mean ± SD: 39.99±16.46 pack-years) than smokers without COPD (mean ± SD: 37.43±17.15 pack-years). The Shapiro–Wilk test for normality revealed that the distribution of the attributes significantly varied from that of the normal curve. Therefore, we performed nonparametric Mann–Whitney U-test for comparison of these two independent groups. The test revealed that the previously mentioned quantitative differences of the studied parameters between smokers with COPD and smokers without COPD were statistically significant (P<0.05), except for BMI (P=0.343) (Table 1). Significant difference (P<0.05) was also found in the level of the serum anti-p-BQ antibody (milligrams per deciliter) between these two groups; the Mann–Whitney U value for this comparison was 4,632.50. Descriptive statistics of the attributes age, BMI, postbronchodilator FEV1 (% predicted) and postbronchodilator FEV1/FVC (%) in smokers without COPD and smokers with COPD are given in Table S1. Descriptive statistics of the attributes pack-years of smoking and serum anti-p-BQ antibody (milligrams per deciliter of serum) in smokers without COPD and smokers with COPD are given in Table S2.
 | Table 1 Age, BMI, pack-years of smoking, FEV1 (% predicted), FEV1/FVC (%) and serum anti-p-BQ antibody level of smokers with and without COPD |
Bivariate correlation analysis and scatter plot
Spearman’s correlation tests were performed for the following pairs of parameters: 1) pack-years of smoking and serum anti-p-BQ antibody level; 2) FEV1 (% predicted) and serum anti-p-BQ antibody level; 3) FEV1/FVC (%) and serum anti-p-BQ antibody level for smokers with COPD and smokers without COPD (Table 2). The correlation test revealed that in smokers without COPD, the following pairs of parameters, namely, 1) pack-years of smoking and serum anti-p-BQ antibody level; 2) FEV1 (% predicted) and serum anti-p-BQ antibody level, have significant (P<0.01) association, with Spearman’s rho values of 0.215 and 0.505, respectively (Table 2). Grouped scatter plots of, 1) serum anti-p-BQ antibody level against pack-years of smoking (Figure 1); 2) FEV1 (% predicted) against serum anti-p-BQ antibody level (Figure 2); and 3) FEV1/FVC (%) against serum anti-p-BQ antibody level (Figure 3) for smokers with or without COPD were also obtained.
 | Table 2 Correlation analysis of pack-years of smoking, FEV1 (% predicted) and FEV1/FVC (%) with serum anti-p-BQ antibody level in smokers with and without COPD |
 | Figure 1 Grouped scatter plot of serum anti-p-BQ antibody (mg/dL) against pack-years of smoking of smokers with or without COPD. |
 | Figure 2 Grouped scatter plot of FEV1 (% predicted) against serum anti-p-BQ antibody (mg/dL) of smokers with or without COPD. |
 | Figure 3 Grouped scatter plot of FEV1/FVC (%) against serum anti-p-BQ antibody (mg/dL) of smokers with or without COPD. |
ROC curve
An ROC curve was generated, comparing the smokers with COPD and smokers without COPD based on serum anti-p-BQ antibody levels (in milligrams per deciliter) to illustrate the performance of the ELISA test (Figure 4). The area under the curve (AUC) was 0.934 (standard error of the mean =0.011, P=0.000); 95% CI of the AUC was 0.913–0.935. Serum anti-p-BQ antibody concentration (in milligrams per deciliter) was used as the test variable and COPD status (present or absent) as the state variable for constructing this ROC curve. Smaller values of the test result variable indicate a stronger evidence for positive actual state. For this ROC curve, the positive actual state was smokers with COPD.
 | Figure 4 ROC curve for serum anti-p-BQ antibody. |
Determination of serum anti-p-BQ antibody cutoff value for COPD risk evaluation in smokers
For selecting a cutoff value having optimal balance between sensitivity and specificity, all the coordinate points on the ROC curve were critically examined. Serum anti-p-BQ antibody concentration level ≤29.4 mg/dL was found to be a suitable choice for the cutoff for COPD risk assessment in smokers, having assay sensitivity and assay specificity of 90.3% and 86.4%, respectively. Participants from among the smokers with or without COPD group were classified with respect to this cutoff value. The distribution of participants with serum anti-p-BQ antibody concentration level either ≤29.4 mg/dL or >29.4 mg/dL in smokers without COPD group and in smokers with COPD group, respectively, is presented in Table 1. Among the individuals having serum anti-p-BQ antibody concentration level ≤29.4 mg/dL, 205 (83.0%) represented the group of smokers with COPD and 42 (17%) were smokers without COPD. On the other hand, among individuals having serum anti-p-BQ antibody concentration level >29.4 mg/dL, 22 (7.6%) were smokers with COPD and 266 (92.4%) were smokers without COPD. Thus, the positive predictive value (PPV) and negative predictive value (NPV) associated with this cutoff were 83.0% and 92.4%, respectively. Chi-square test revealed that significant difference between the groups was observed in this distribution (χ2 value =309.111, P=0.000). Calculated unadjusted OR was 59.02, with 95% CI: 34.15–101.99. The model explained 64.3% (Nagelkerke R2) variance in COPD occurrence and correctly classified 88% of all participants according to their true state (with or without COPD). Binary logistic regression analysis was performed to obtain FEV1 (% predicted) adjusted OR with respect to this cutoff value of serum anti-p-BQ antibody concentration, and the adjusted OR was 33.46, with 95% CI: 6.4–174.9.
Discussion
In this cross-sectional study, we show that ~90% of smokers with COPD have a significantly low level of serum anti-p-BQ antibody. On the contrary, a majority (~86%) of smokers without COPD have a relatively high level of serum anti-p-BQ antibody. However, ~14% of smokers with as-yet-undiagnosed COPD have a significantly low level of anti-p-BQ antibody. We consider that these 14% of smokers are susceptible to the disease. Our finding indicates that anti-p-BQ antibody may be used as a prospective biomarker for screening asymptomatic smokers at risk for COPD. This prospective biomarker will help to explore new therapeutic strategies to reduce the future burden of COPD for both morbidity and mortality. The method presented in this study for measuring anti-p-BQ antibody in the sera of smokers using ELISA is reliable and reproducible, and the equipment is readily available in clinical settings.
Clinicians who would wish to interpret the “low concentration of anti-p-BQ antibody” results would want to know the probability that an individual is truly COPD prone if the concentration of antibody is below the cutoff value (PPV) and, similarly, that an individual is not COPD prone if the concentration of anti-p-BQ antibody is above the cutoff (NPV). As the PPV and NPV would depend on the prevalence of disease (COPD) in a population, as well as the sensitivity and specificity of our suggested biomarker (anti-p-BQ antibody), we consider that the clinical relevance of this marker with regard to COPD needs to be tested in the respective population groups.
COPD is primarily a smoking-related disorder. Obviously, the primary strategy for prevention of COPD is cessation of smoking. However, despite local government legislation and antismoking public campaigns, the “stop smoking” outcome has proven difficult to achieve and is unlikely to be accomplished globally. Since prevention of smoking-related diseases is of global precedence, chemoprevention would be an alternate strategy. Many studies, including those from our laboratory, have shown that oral supplementation of vitamin C (30 mg/kg body weight), a strong antagonist of p-BQ, prevents CS-induced emphysema in a guinea pig model.15,16,19,20 Since the guinea pig has anatomical and CS-induced pathophysiological similarities to humans, we consider that in addition to intensive smoking cessation efforts, intake of adequate vitamin C may prevent COPD in asymptomatic smokers having low level of anti-p-BQ antibody.21
The current investigation to explore whether low concentration of anti-p-BQ antibody could serve as a biomarker to predict development of COPD in smokers has limitations. Although our finding indicates strong statistical association of low anti-p-BQ antibody level with COPD status in smokers, subsequent longitudinal studies would be required to generate information to establish that lack of anti-p-BQ antibody in asymptomatic smokers leads to development of COPD in the future.
Conclusion
Our hypothesis that anti-p-BQ antibody may be used as a biomarker to predict risk for COPD in asymptomatic smokers would help clinicians to identify the subpopulation and provide them with intensified advice for smoking cessation. This clinical biomarker will also facilitate development of novel drugs or other effective strategies for intervention of COPD at an early stage. However, our observations and propositions warrant further research for validation and translation in clinical practice.
Acknowledgment
This work was supported by grants from the Juthika Research Foundation and the Krishna and Sukhomay Lahiri Cancer Research Foundation of Calcutta University.
Author contributions
IBC conceived the idea and the project, supervised the project and wrote the manuscript. IBC and SB designed and performed the experiments and partly carried out statistical analysis. PB supplied blood samples and reviewed the clinical data and the manuscript critically. SM supplied blood samples and reviewed the clinical data. SK was an advisor for the project and participated in the design of the experiment. SP reviewed the clinical data and carried out statistical analysis. All authors contributed toward data analysis, drafting and critically revising the paper and agree to be accountable for all aspects of the work.
Disclosure
The authors report no conflicts of interest in this work.
References
WHO [webpage on the Internet]. The Top 10 Causes of Death. 2017. [updated Jan 2017]. Available from: http://www.who.int/mediacentre/factsheets/fs310/en/. Accessed April 16, 2017. | ||
WHO [webpage on the Internet]. Chronic Obstructive Pulmonary Disease (COPD). 2017. Available from: http://www.who.int/mediacentre/factsheets/fs315/en/. Accessed April 16, 2017. | ||
Mathers CD, Loncar D. Projections of global mortality and burden of disease from 2002 to 2030. PLoS Med. 2006;3(11):e442. | ||
Sin DD, Vestbo J. Biomarkers in chronic obstructive pulmonary disease. Proc Am Thorac Soc. 2009;6:543–545. | ||
Soriano JB, Zielinski J, Price D. Screening for an early detection of chronic obstructive pulmonary disease. Lancet. 2009;374:721–732. | ||
Repine JE, Bast A, Lankhorst I. Oxidative stress in chronic obstructive pulmonary disease. Oxidative Stress Study Group. Am J Respir Crit Care Med. 1997;156:341–357. | ||
Laniado-Laborín R. Smoking and chronic obstructive pulmonary disease (COPD). Parallel Epidemics of the 21st Century. Int J Environ Res Public Health. 2009;6:209–224. | ||
Ward H, Toledano MB, Shaddick G, Davies B, Elliott P. Oxford Handbook of Epidemiology for Clinicians. Oxford: Oxford University Press; 2012:289–290. | ||
Rennard SI, Vestbo J. COPD: the dangerous underestimate of 15%. Lancet. 2006;367(9518):1216–1219. | ||
Cazzola M, Novelli G. Biomarkers in COPD. Pulm Pharmacol Ther. 2010;23(6):493–500. | ||
Shaw JG, Vaughan A, Dent AG, et al. (2014) Biomarkers of progression of chronic obstructive pulmonary disease (COPD). J Thorac Dis. 2014;6(11):1532–1547. | ||
Barnes PJ, Chowdhury B, Kharitonov SA, et al. Pulmonary biomarkers in chronic obstructive pulmonary disease. Am J Respir Crit Care Med. 2006;174(1):6–14. | ||
Berndt A, Leme AS, Shapiro SD. Emerging genetics of COPD. EMBO Mol Med. 2012;4:1144–1155. | ||
From the Global Strategy for the Diagnosis [homepage on the Internet], Management and Prevention of COPD, Global Initiative for Chronic Obstructive Lung Disease (GOLD); 2016. Available from: http://goldcopd.org/. Accessed May 31, 2017. | ||
Banerjee S, Chattopadhyay R, Ghosh A, et al. Cellular and molecular mechanisms of cigarette smoke-induced lung damage and prevention by vitamin C. J Inflamm (Lond). 2008;5:21. | ||
Ghosh A, Ganguly S, Dey N, et al. Causation of cigarette smoke–induced emphysema by p-benzoquinone and its prevention by vitamin C. Am J Respir Cell Mol Biol. 2015;52(3):315–322. | ||
Ghosh A, Choudhury A, Das A, et al. Cigarette smoke induces p-benzoquinone–albumin adduct in blood serum: implications on structure and ligand binding properties. Toxicology. 2012;292(2–3):78–89. | ||
Dimitrova ND, Kostadinova RY, Marinova SN, Popov TA, Panev TI. Specific immune responses in workers exposed to benzene. Int Immunopharmacol. 2005;5(10):1554–1559. | ||
Koike K, Ishigami A, Sato Y, et al. Vitamin C prevents cigarette smoke-induced pulmonary emphysema in mice and provides pulmonary restoration. Am J Respir Cell Mol Biol. 2014;50(2):347–357. | ||
Gupta I, Ganguly S, Rozanas R, Stuehr DJ, Panda K. Ascorbate attenuates pulmonary emphysema by inhibiting tobacco smoke and Rtp801-triggered lung protein modification and proteolysis. Proc Natl Acad Sci U S A. 2016;113(29):E4208–E4217. | ||
Wright JL, Churg A. A model of tobacco smoke-induced airflow obstruction in the guinea pig. Chest. 2002;121:188S–191S. |
Supplementary materials
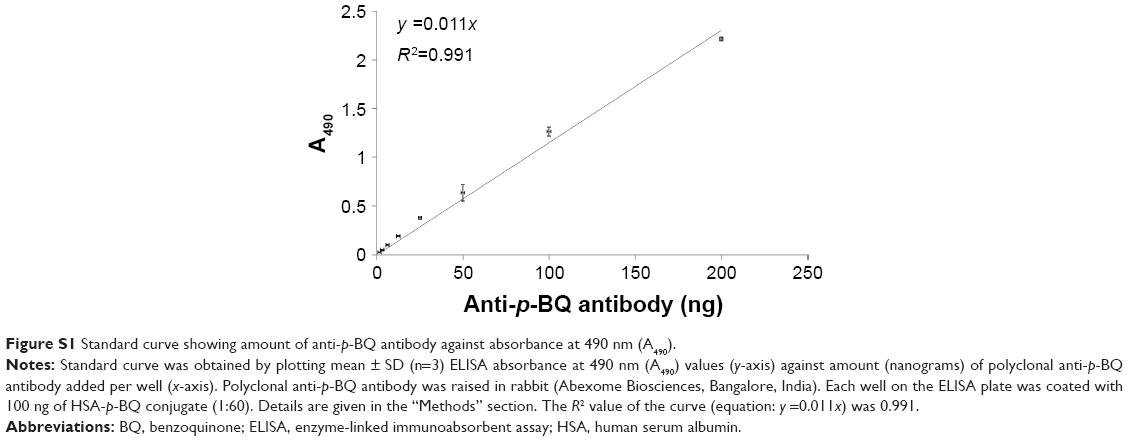 | Figure S1 Standard curve showing amount of anti-p-BQ antibody against absorbance at 490 nm (A490). |
 | Table S1 Descriptive statistics of attributes age, BMI, postbronchodilator FEV1 (% predicted), postbronchodilator FEV1/FVC (%) in smokers without and with COPD |
 | Table S2 Descriptive statistics of attributes pack-years of smoking and serum anti-p-BQ antibody (mg/dL of serum) in smokers without COPD and smokers with COPD |
 © 2017 The Author(s). This work is published and licensed by Dove Medical Press Limited. The
full terms of this license are available at https://www.dovepress.com/terms
and incorporate the Creative Commons Attribution
- Non Commercial (unported, 3.0) License.
By accessing the work you hereby accept the Terms. Non-commercial uses of the work are permitted
without any further permission from Dove Medical Press Limited, provided the work is properly
attributed. For permission for commercial use of this work, please see paragraphs 4.2 and 5 of our Terms.
© 2017 The Author(s). This work is published and licensed by Dove Medical Press Limited. The
full terms of this license are available at https://www.dovepress.com/terms
and incorporate the Creative Commons Attribution
- Non Commercial (unported, 3.0) License.
By accessing the work you hereby accept the Terms. Non-commercial uses of the work are permitted
without any further permission from Dove Medical Press Limited, provided the work is properly
attributed. For permission for commercial use of this work, please see paragraphs 4.2 and 5 of our Terms.