Back to Archived Journals » Open Access Journal of Sports Medicine » Volume 6
Anthropometric factors related to sprint and agility performance in young male soccer players
Authors Mathisen G, Pettersen SA
Received 3 July 2015
Accepted for publication 1 October 2015
Published 5 November 2015 Volume 2015:6 Pages 337—342
DOI https://doi.org/10.2147/OAJSM.S91689
Checked for plagiarism Yes
Review by Single anonymous peer review
Peer reviewer comments 2
Editor who approved publication: Prof. Dr. Andreas Imhoff
Gunnar Mathisen, Svein Arne Pettersen
School of Sport Sciences, UiT The Arctic University of Norway, Tromsø, Norway
Objective: To investigate the relationship between anthropometrics and sprint and agility performance and describe the development of sprint (acceleration) and agility performance in 10- to 16-year-old male soccer players.
Methods: One hundred and thirty-two participants were divided into three age groups, 10–12 years (mean 10.8±0.50), 13–14 years (mean 13.9±0.50), and 15–16 years (mean 15.5±0.24), with assessment of 20 m sprint with 10 m split time and agility performance related to body height and body mass within groups.
Results: In the 10- to 12-year-olds, there were no significant correlations between height, weight, and the performance variables, except for body mass, which was correlated to 10–20 m sprint (r=0.30). In the 13- to 14-year-olds, body height was significantly correlated with 10 m sprint (r=0.50) and 20 m sprint (r=0.52), as well as 10–20 m sprint (r=0.50) and agility performance (r=0.28). In the 15- to 16-year-old group, body height was correlated to 20 m (r=0.38) and 10–20 m (r=0.45) sprint. Body mass was significantly correlated to 10 m spring (r=0.35) in the 13- to 14-year-olds, as well as 20 m (r=0.33) and 10–20 m (r=0.35) sprint in the 15- to 16-year-olds.
Conclusion: Height and body mass were significantly correlated with sprint performance in 13- to 16-year-old male soccer players. However, the 10- to 12-year-olds showed no significant relationship between sprint performance and anthropometrics, except for a small correlation in 10–20 m sprint. This may be attributed to maturation, with large differences in body height and body mass due to different patterns in the growth spurt. The agility performance related to anthropometrics was insignificant apart from a moderate correlation in the 13- to 14-year-olds.
Keywords: youth soccer, running speed, development, football, puberty, skills
Introduction
Body height and body mass are associated with physical performance in children and youths1,2 and have been found to be determinants of sprint performance.3,4 Sprint, acceleration, and agility are among the most important performance variables in youth soccer.5,6 During all stages of adolescence, older and more mature boys are taller than the average of late-maturing males,1,7 and have thereby an advantage compared to younger and less mature players.8,9 At the growth spurt, around peak height velocity (PHV), there is a huge within-group difference in body height, ranging from 8.2 to 10.3 cm per year. PHV for male soccer players is estimated at 13.8 (±0.8) years, and 14.2 years for samples of European boys.1,10 During PHV, the levels of testosterone are increased, and maturation of the neuromuscular system is improved.1 Strength and power development alters 1.5 years before PHV, and peaks 0.5–1.0 years after PHV.11,12
Youth soccer players who are advanced in age and/or maturation have shown better performance in field tests in 10 m and 40 m sprint.13,14 However, there are limited data about sprint and agility performances, and there is a lack of results for distances shorter than 30 m.15 Knowledge about performance is important because older, taller, and more mature players tend to be selected, and this may affect the identification of, and early dropouts among, talented young soccer players.7,16,17
The aim of the present study was to gain more insight regarding anthropometrics and sprint and agility performance among young male soccer players. Furthermore, straight-line sprint and agility have been identified as independent qualities in adults with no strong relationship.18 Reports of children and youths have shown a stronger correlation between these abilities.19,20 However, the data are sparse, and thus a second aim was to investigate the relationship between straight-line sprint and agility.
Methods
Participants
The sample consisted of a total of 132 young regional male soccer players aged 10–16 years. The participants were grouped on the basis of chronological age into 2-year age categories: the 10- to 12-year-old group, ranging from 10.1 to 11.8 (pre-PHV); the 13- to 14-year-old group, ranging from 13.1 to 14.9 years (mid-PHV); and the 15- to 16-year-old group, ranging from 15.0 to 16.0 years (post-PHV). In general, the participants started organized football training at the age of 6 years with one training session per week. In addition, they played one match per week in a 3-month match season. From the age of 9 years, the training volume was doubled, and when turning 12 years, they conducted three sessions per week. Written informed consent was obtained from the participants and their guardians. The study was given institutional ethical approval by UiT the Artic University of Tromsoe, School of Sport Sciences, and meets the ethical standards in sport and exercise science research.21
Test procedures
Anthropometrics were collected with the participants wearing shorts, t-shirts, and socks to the nearest 0.5 kg (weight) (Seca 750; Seca, Hamburg, Germany), with height (Seca 222) to the nearest 0.5 cm.
The tests were executed in February 2012 and 2013 in the afternoon on a weekday, in an indoor gym and on a parquet floor, with a temperature of 20°C. Performance testing started after 15 minutes of supervised warm-up, consisting of jogging, sideways skipping, and submaximal sprints, and finishing with two sprints in the test-course at approximately 95% of maximum speed, followed by stretching. The participants were encouraged to conduct the tests with maximal effort. Electronic timing gates, wirelessly connected with a timer, were used to record split and completion times (Brower Timing Systems, Salt Lake City, UT, USA). The sprint test consisted of a 20 m straight-line track with 10 m split-time recording. The photocells were placed at 20 cm height at the starting position, with a marker for the front foot placed 20 cm behind this position, and at 100 cm height at 10 m, 20 m, and the finish line in the straight-line test. The agility test was executed with the same starting procedure as the straight-line test, and with the photocells placed at 20 cm height at the start and at 100 cm height at the finish line. The agility test was a 20 m standardized course,19 starting with a 5 m straight sprint followed by a 90° turn, a 2.5 m sprint followed by a 180° turn, a 5 m slightly curved sprint followed by a 180° turn, a 2.5 m straight sprint followed by a 90° turn, and a 5 m straight sprint (Figure 1). Three 120 cm-high coaching sticks, which were not allowed to be touched, were used to ensure correct passage in the turns.19 Participants began in a stationary position and performed two maximal sprints, with a minimum 3-minute break between trials at each test, with the best time recorded for each sprint.
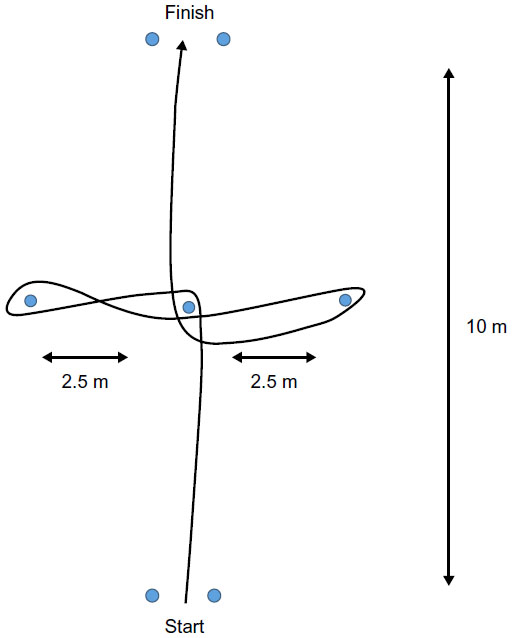 | Figure 1 Diagram of the course used in the agility test, consisting of two 5 m straight sprints, one 5 m slightly curved sprint, and two 2.5 m straight sprints with two 90° and two 180° turns. |
Statistical analyses
One-way analysis of variance (ANOVA) was used to examine the difference in performance between the three age groups. Pairwise comparisons were made using the Bonferroni test. (When F ratios were significant, post hoc comparisons of means were performed with Tukey’s multiple comparison tests). Descriptive statistics are mean ± standard deviations.
Multiple linear regression models and stepwise backward elimination procedure, with height, body mass, and body mass index (BMI) as the dependent variables, were used to determine the most influential factors contributing to sprint/agility performances. The relationship between height and body mass and the results of sprint/agility performances were determined using Pearson partial correlation (r) analyses, adjusted for chronological age within the groups (Table 1). The 0–20 m sprint with 10 m split time (initial acceleration), 10–20 m sprint (intermediate phase), and agility test were selected for evaluation. The following corresponding criteria were adopted for interpreting the magnitude of the correlation (r) between the measures: ≤0.1, trivial; <0.1–0.3, small; <0.3–0.5, moderate; <0.5–0.7, large; <0.7–0.9, very large; and <0.9–1.0, almost perfect.22 The reliability of sprint and agility tests has been assessed by intraclass correlation, using ANOVA, and shows highly repeatable results, with the correlation value calculated at 0.91 and 0.92 in the straight-line sprint tests and 0.87 in the agility test, all significant at P<0.05.19 The analyses were calculated using SPSS version 19.0 (IBM Corporation, Armonk, NY, USA).
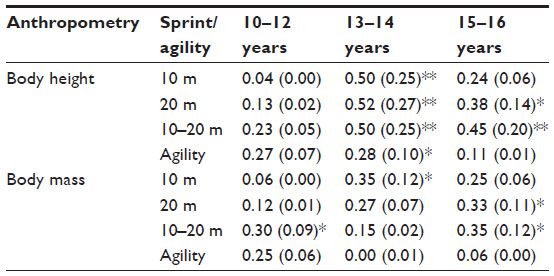 | Table 1 Within-group correlation between anthropometrics and sprint/agility performance in 10- to 12-, 13- to 14-, and 15- to 16-year-old male soccer players (Pearson’s r [R2]) |
Results
Descriptive statistics (mean ± standard derivation) in sprint and agility performance and of anthropometry (body height and body mass) of participants grouped by age are summarized in Tables 2 and 3. Correlations between anthropometrics and sprint and agility performances are presented in Table 1, and correlation between sprint and agility in Table 4.
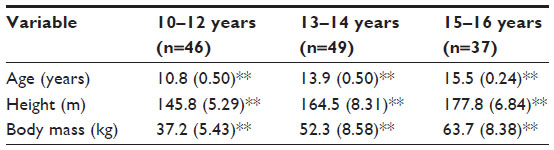 | Table 2 Physical characteristics of 10- to 12-, 13- to 14-, and 15- to 16-year-old male soccer players (mean ± standard deviation) |
 | Table 3 Sprint and agility performance in 10- to 12-, 13- to 14-, and 15- to 16-year-old male soccer players |
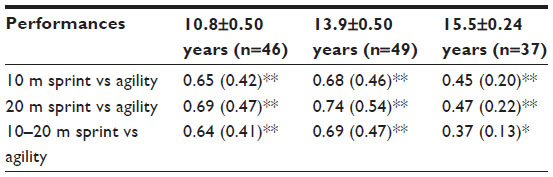 | Table 4 Pearson’s correlation (r [R2]) between speed and agility for 10- to 16-year-old male soccer players (mean ± standard deviation) |
In the 10- to 12-year-olds, there was no correlation between height, weight, and the performance variables, except a small correlation between body mass and 10–20 m sprint (r=0.30). Body mass was significantly correlated with 10 m sprint (r=0.35) in the 13- to 14-year-olds, and with 20 m (r=0.33) and 10–20 m (r=0.35) sprint in the 15- to 16-year-old group. Height was significantly correlated to 10 m sprint (r=0.50), with 20 m sprint (r=0.52), with 10–20 m sprint (r=0.50), and with agility performance (r=0.28) in the 13- to 14-year-olds, and with 20 m sprint (r=0.38) and 10–20 m sprint (r=0.45) in the 15- to 16-year-olds. BMI did not show any significant correlation to performances in sprint and agility. Correlation between sprint and agility showed r-values between 0.64 and 0.69 in the 10- to 12-year-olds, 0.68 and 0.74 in the 13- to 14-year-olds, and 0.37 and 0.47 in the 15- to 16-year-olds.
Discussion
In the present study, straight-line sprint and agility performances were compared to body height and body mass in young male soccer players aged 10–16 years. The participants (n=132) were grouped into three different chronological age groups: pre-, mid-, and post-PHV (Table 2). As anticipated, sprint and agility performance improved in relation to chronological age (Table 3). This is in agreement with a previous report, and is likely to be related to the differences in body height and body mass.23 Stride length increases with body height, and strength and power with muscle development, thereby influencing the sprint performance.15 The age span 12–15 years is characterized as the second phase of running speed development.24,25 The improvement in sprint performance is related to the maturation of the neural system and improved muscle/neural coordination, in addition to the increase in muscle mass.1
In the 13- to 14-year-olds, there was a large relationship between body height and 10 m sprint (r=0.50), 20 m sprint (r=0.52), and 10–20 m sprint (r=0.50) (Table 1). In the 15- to 16-year-olds, the correlation between body height and 20 m sprint was significant, although moderate (r=0.38), as was the correlation between body height and 10–20 m sprint (r=0.45) (Table 1). According to previous reports, the largest difference in sprint is related to variation in body height in the ages between 13 and 15 years, and sprint performance has shown the largest improvement around the PHV.9,10
The relationship between body mass and sprint performance was moderate in the 13- to 14-year-olds in 10 m sprint (r=0.35) (Table 1). In the 15- to 16-year-olds, the correlation was moderate in 20 m sprint (r=0.33) and in 10–20 m sprint (r=0.35) (Table 1). In a study among young soccer players, Wong et al16 found that taller players performed better in 10 m and 30 m sprint among 14-year-old males. In the growth spurt, the variations in maturation for the same chronological age have been shown be as much as 2 or 3 years, or even more, and Malina et al8,10 suggest that body mass and maturity account for 50% of variance in short sprint in 13- to 15-year-old soccer players. In this age period, a small difference in maturation may imply a substantial difference in body height and weight, associated with a huge difference in sprint performance.5 BMI did not correlate significantly to any performance variables in this study; however, BMI measurements have shown to be related to body fat among adolescent soccer players.26 Furthermore, Moreno et al27 found body fat to be significantly lower in 9- to 14-year-old soccer players than in a control group and, as a consequence, BMI should be connected to body fat measurement.
The relationship between anthropometrics and sprint performances in the 10- to 12- year-old group was insignificant, except for a weak correlation in 10–20 m sprint (Table 1). This finding is supported by the fact that in the pre-puberty age, before the growth spurt, there are relatively small within-group differences in anthropometrics.24 This is in line with previous reports of 10- to 12-year-old boys.2,19,28 However, another study, with 12-year-old boys, found a significant correlation between the 50 m sprint and height.29
Agility is a key requirement for optimal performance in many sports and one of the most discriminating factors among young soccer players.30,31 Comparisons between age groups found significantly enhanced performance in agility (Table 3). The peak rate of development of agility performance occurs at approximately the age of 13–14 years in male youths, which is at the time of PHV.32 In the present study, agility was significantly correlated with body height at the age of 13–14 years, but not in the pre- and post-PHV groups (Table 1). At the age period of PHV, performance improvements relate to maturation, attained by enhanced levels of testosterone and growth hormone, followed by a more pronounced difference in body height and force development.1 Furthermore, it is likely that development of the nervous system and intermuscular and intramuscular coordination, as well as enhanced motor control, explain the improvement in agility performance.30,33
The present study shows a strong correlation between straight-line sprint and agility (r-values between 0.64 and 0.74) in the two youngest age groups (Table 4). These results are supported by previous reports among young males aged 10–14 years.19,20,28 Jones et al34 suggest that, at early stages of athlete development, a basic improvement in sprint may lead to an improvement in agility performance. However, in the 15- to 16-year-olds, the correlation was weaker, with r-values from 0.37 to 0.47 (Table 4). These results are more in accordance with 15- to 16-year-old national team players35,36 and are more in line with results from adult male athletes,18 where straight-line sprint and agility have been found to be independent abilities that are specific and produce limited transfer to each other.37 However, the results of the present study are different from those of Köklü et al,38 who found correlations of r=0.56 and r=0.74 between 10 m and 30 m straight sprint and a zigzag agility test in 16-year-old soccer players.
A limitation in the present study is the lack of maturation status of the players. Another aspect is the use of a cross-sectional study design, testing different subjects within each age group, which may confound the outcome of the study. Nevertheless, the results provide insights into the relationship between chronological age before, around, and after PHV, which is a critical phase in the young male athlete’s development.
Conclusion
The main aim of this study was to investigate the relationship between anthropometrics and sprint and agility performance and describe the development of sprint (acceleration) and agility performance of 10- to 16-year-old male soccer players. The results show that, in the 13- to 16-year-olds, taller and heavier players performed better in sprint performance; however, in 10- to 12-year-olds, there were no significant relationships between sprint and anthropometrics, except for a small correlation in 10–20 m sprint. This may be attributed to maturation, with large differences in body height and body mass following the growth spurt. The agility performance related to height and body mass was insignificant within the groups, except for a moderate correlation in the 13- to 14-year-old group.
Practical application
The present study shows that height and body mass influence sprint up to 20 m, and this is of interest in soccer because most sprints last 2–4 seconds,39 thus giving taller players an advantage, because sprints often influence the success of the game.
Practitioners should be aware of the impact of body height and body mass on sprint and agility performances around the age of PHV in male soccer players, and thereby minimize the role of growth-related variables in talent identification. Physically advanced players tend to be favored because they perform better in physical tasks, and practitioners and coaches should recognize that changes in growth and performance are highly individualized.
Disclosure
The authors report no conflicts of interest in this work.
References
Malina RM, Bouchard C, Bar-Or O. Growth, Maturation, and Physical Activity. Champaign: Human Kinetics; 2004:66,222. | |
Butterfield SA, Lehnhard R, Lee J, Coladarci T. Growth rates in running speed and vertical jumping by boys and girls ages 11–13. Percept Mot Skills. 2004;99:225–234. | |
Mendez-Villanueva A, Buchheit M, Kuitunen S, Douglas A, Peltola E, Bourdon P. Age-related differences in acceleration, maximum running speed, and repeated-sprint performance in young soccer players. J Sports Sci. 2011;29(5):477–484. | |
Malina RM, Cumming SP, Kontos AP, Eisenmann JC, Ribeiro B, Aroso J. Maturity-associated variation in sport-specific skills of the youth soccer players aged 13–15 years. J Sports Sci. 2005;23(5):515–522. | |
Gil S, Ruiz F, Irazusta A, Gil J, Irazusta J. Selection of young soccer players in terms of anthropometric and physiological factors. J Sports Med Phys Fitness. 2007;47:25–32. | |
Castagna JB, D’Ottavio S, Abt G. Activity profile of young soccer players during actual match play. J Strength Cond Res. 2003;17:775–780. | |
Helsen WF, van Winckel J, Williams AM. The relative age effect in youth soccer across Europe. J Sports Sci. 2005;23:629–636. | |
Malina RM, Ribeiro B, Aroso J, Cumming SP. Characteristics of youth soccer players aged 13–15 years classified by skill level. Br J Sports Med. 2007;41:290–295. | |
Philippaerts RM, Vaeyens R, Janssens M, et al. The relationship between peak height velocity and physical performance in youth soccer players. J Sports Sci. 2006;24(3):221–230. | |
Malina RM, Eisenmann JC, Cumming SP, Ribeiro B, Aroso J. Maturity-associated variation in the growth and functional capacites of youth football (soccer) players 13–15 years. Eur J Appl Physiol. 2004;91: 555–562. | |
Beunen G, Malina RM. Growth and physical performance relative to the timing of the adolescent spurt. Exerc Sport Sci Rev. 1988;16: 503–540. | |
Ford P, De Ste Croix M, Lloyd R, et al. The long-term athlete development model: physiological evidence and application. J Sports Sci. 2011; 29(4):389–402. | |
Buchheit M, Mendez-Villanueva A. Effects of age, maturity and body dimensions on match running performance in highly trained under-15 soccer players. J Sports Sci. 2014;32(13):1271–1278. | |
le Gall F, Carling C, Williams M, Reilly T. Anthropometric and fitness characteristics of international, professional and amateur male graduate soccer players from an elite youth academy. J Sci Med Sports. 2010;13: 90–95. | |
Papaiakovou G, Giannakos A, Michailidis C, et al. The effect of chronological age and gender on the development of sprint performance during childhood and puberty. J Strength Cond Res. 2009;23:2568–2573. | |
Wong PL, Chamari K, Dellal A, Wisløff U. Relationship between anthropometric and physiological characteristics in youth soccer players. J Strength Cond Res. 2009;23(4):1204–1210. | |
Malina RM, Peña Reyes ME, Eisenmann JC, Horta L, Rodrigues J, Miller R. Height, mass and skeletal maturity of elite Portuguese soccer players aged 11–16 years. J Sports Sci. 2000;18:685–693. | |
Young WB, McDowell MH, Scarlett BJ. Specificity of sprint and agility training methods. J Strength Cond Res. 2001;15:315–319. | |
Pettersen SA, Mathisen GE. Effect of short burst activities on sprint and agility performance in 11- to 12-year-old boys. J Strength Cond Res. 2012;26:1033–1038. | |
Jakovljevic ST, Karalejic MS, Pajic ZB, Macura MM, Erculj FF. Speed and agility of 12- and 14-year-old elite male basketball players. J Strength Cond Res. 2012;26:2453–2459. | |
Harriss DJ, Atkinson G. Update – ethical standards in sport and exercise science research. Int J Sports Med. 2011;32:819–821. | |
Hopkins WG, Marshall SW, Batterham AM, Hanin J. Progressive statistics for studies in sport medicine and exercise science. Med Sci Sports Exerc. 2009;41:3–13. | |
Mujika I, Spencer M, Santisteban J, Goiriena JJ, Bishop D. Age-related differences in repeated-sprint ability in highly trained youth football players. J Sports Sci. 2009;27(14):1581–1590. | |
Rowland TW. Children’s Exercise Physiology. Champaign: Human Kinetics; 2005:51,176. | |
Reilly T, Bangsbo J, Franks A. Anthropometric and physiological predispotions for elite soccer. J Sports Sci. 2000;18:669–683. | |
Nikolaidis PT. Prevalence of overwight, and association between body mass index, body fat percent and physical fitness in male soccer players aged 14–16 years. Sci Sports. 2013;28:125–132. | |
Moreno LA, León JF, Seron R, Mesana MI, Fleta J. Body composition in young male football (soccer) players. Nutr Res. 2004;24:235–242. | |
Mathisen G, Pettersen SA. Effect of high-intensity training on speed and agility performance in 10-year-old soccer players. J Sports Med Phys Fitness. 2015;55(1–2):25–29. | |
Almuzaini KS. Optimal peak and mean power on the Wingate test: realtionship with sprint ability, vertical jump, and standing long jump in boys. Pediatr Exerc Sci. 2000;12:349–359. | |
Oliver JL, Lloyd RS, Rumpf MC. Developing speed throughout childhood and adolecence: the role of growth, maturation and training. Strength Cond J. 2013;35(3):42–48. | |
Reilly T, Williams AM, Nevill A, Franks A. A multidisciplinary approach to talent identification in soccer. J Sports Sci. 2000;18:695–702. | |
Vänttinen T, Blomqvist M, Nyman K, Häkkinen K. Changes in body composition, hormonal status, and physical fitness in 11-, 13-, and 15-year-old Finnish regional youth soccer players during a two-year follow up. J Strength Cond Res. 2011;25:3342–3351. | |
Viru A, Loko J, Harro M, Volver A, Laaneots, Viru M. Critical periods in the development of performance capacity during childhood and adolescence. European Journal of Physical Education. 1999;4: 75–119. | |
Jones P, Bampouras TM, Marrin K. An investigation into the physical determinants of change of direction speed. J Sports Med Phys Fitness. 2009;49:97–104. | |
Tomáš M, František Z, Lucia M, Jaroslav T. Profile, correlation and structure of speed in elite youth soccer players. J Hum Kinet. 2014;40: 149–159. | |
Sporiš G, Milanovic Z, Trajkovic N, Joksimovic A. Correlation between speed, agility and quickness (SAQ) in elite young soccer players. Acta Kinesiologica. 2011;5:36–41. | |
Little T, Williams AG. Specificity of acceleration, maximum speed, and agility in professional soccer players. J Strength Cond Res. 2005;19: 76–78. | |
Köklü Y, Alemdaroğlu U, Özkan A, Koz M, Ersöz G. The relationship between sprint ability, agility and vertical jump performance in young soccer players. Sci Sports. 2015;30(1):e1–e5. | |
Mohr M, Krustrup P, Bangsbo J. Match performance of high-standard soccer players with special reference to development of fatigue. J Sports Sci. 2003;21:519–528. |
 © 2015 The Author(s). This work is published and licensed by Dove Medical Press Limited. The
full terms of this license are available at https://www.dovepress.com/terms
and incorporate the Creative Commons Attribution
- Non Commercial (unported, 3.0) License.
By accessing the work you hereby accept the Terms. Non-commercial uses of the work are permitted
without any further permission from Dove Medical Press Limited, provided the work is properly
attributed. For permission for commercial use of this work, please see paragraphs 4.2 and 5 of our Terms.
© 2015 The Author(s). This work is published and licensed by Dove Medical Press Limited. The
full terms of this license are available at https://www.dovepress.com/terms
and incorporate the Creative Commons Attribution
- Non Commercial (unported, 3.0) License.
By accessing the work you hereby accept the Terms. Non-commercial uses of the work are permitted
without any further permission from Dove Medical Press Limited, provided the work is properly
attributed. For permission for commercial use of this work, please see paragraphs 4.2 and 5 of our Terms.