Back to Journals » Vascular Health and Risk Management » Volume 13
Annual deterioration of renal function in hypertensive patients with and without diabetes
Authors Polonia J ![]() , Azevedo A, Monte M, Silva JA, Bertoquini S
, Azevedo A, Monte M, Silva JA, Bertoquini S
Received 21 February 2017
Accepted for publication 23 March 2017
Published 26 June 2017 Volume 2017:13 Pages 231—237
DOI https://doi.org/10.2147/VHRM.S135253
Checked for plagiarism Yes
Review by Single anonymous peer review
Peer reviewer comments 2
Editor who approved publication: Prof. Dr. Pietro Scicchitano
Jorge Polonia,1,2 André Azevedo,1 Miguel Monte,1 José A Silva,2 Susana Bertoquini1,2
1Department of Medicine, CINTESIS, Faculty of Medicine of Porto, University of Porto, Porto, Portugal; 2Blood Pressure Unit, Hospital Pedro Hispano, Matosinhos, Portugal
Background: Chronic kidney disease (CKD) complicates hypertension and diabetes. Knowledge of the deterioration rate of CKD may anticipate adjustment of therapies with renal elimination. This study evaluates the rate of annual deterioration of renal function in hypertensive patients either with type 2 diabetes (DM2) or without it (non-DM) followed for 5 years and relates it with blood pressure (BP) and glycemic control.
Materials and methods: Out of a total of 1924 patients, 1023 patients (594 non-DM and 429 DM2, 53% female, aged 62.1±10.2 years) were evaluated over 5 years for the annual evolution of renal function (estimated glomerular filtration rate [eGFR], Modification of Diet in Renal Disease) ambulatory 24-hour blood pressure and metabolic parameters, corresponding to the analysis of 2378 patient-years.
Results: DM2 and non-DM did not differ for age, mean 24-hour BP levels, nighttime BP, albuminuria, and body mass index. DM2 versus non-DM showed a higher (p<0.02) prevalence of stage 3 CKD (24.0% vs 18.0%, eGFR 30–59), stage 4 (5.4% vs 2.7%, eGFR 15–29), and stage 5 (0.8% vs 0.5%, eGFR <15). Average annual decline of eGFR was 3.3±8.2 in DM2 versus 2.4±7.7 in non-DM (p=0.12, nonsignificant). Annual changes of eGFR and of albuminuria correlated (r=0.578, p<0.001). In multivariate analysis, age, nighttime BP, double inhibition of renin angiotensin system, albuminuria, and HbA1c >8.0% in DM2 predicted the decline in eGFR. On average, 16.2% of DM2 and 13.1% of non-DM moved each year toward a more severe stage of CKD. For initial eGFR <90 mL/min/1.73 m2, 26.4% of DM2 and 18.1% of non-DM patients showed a reduction per year >10% from the previous eGFR value (p=0.042).
Conclusion: Progressive deterioration of renal function each year is frequent in hypertensive diabetic and non-diabetic patients. Beyond aging, this is particularly dependent on BP control particularly at nighttime, on drug therapy, and on highly abnormal glucose control.
Keywords: renal function, annual deterioration, hypertension, diabetes, chronic kidney disease, diabetes type 2, caucasians, adults
Introduction
Hypertension is a highly prevalent disease that is strongly associated with an increased risk of cardiovascular and renal events.1 Also diabetes mellitus, particularly type 2 (DM2), is also a major health problem representing >8% of the world adult population.2 Hypertension and DM2 are important causes of chronic kidney disease (CKD).3–6 In DM2, the main characteristics of CKD, that is, reduction of glomerular filtration rate (GFR) and albuminuria, are important predictors of cardiovascular complications both in general population7 and in patients with DM2.8,9 However, the natural history of CKD in DM2 and hypertension seems to be heterogeneous since the rate of progression of albuminuria and the rate of decrease of GFR do not always occur in parallel10,11 as well as on its relation with cardiovascular risk. It is well known that renal function and creatinine clearance declines after 30 years of age.12–15 The relationship of deterioration of renal function with hypertension16,17 and diabetes8,18 has been established. However, it has been shown19 that a decline in renal function is more associated with a difference in the systolic blood pressure (SBP) but not with the diastolic BP. Knowledge of the deterioration rate of CKD in both hypertensive patients with and without diabetes may have several clinical implications. For example, in overtreated patients it may be important to anticipate adjustment of therapies with predominant renal elimination or otherwise to select drugs where the pharmacokinetics is not dependent on renal function. Since hypertensive and diabetic patients are commonly highly medicated, this study aimed to evaluate the rate of annual deterioration of renal function in a large cohort of hypertensive patients either with DM2 or without it (non-DM2) followed for 5 years in a reference outpatient hospital clinic of hypertension and to relate it with BP and glycemic control. Since ambulatory BP (ABP) and particularly nighttime BP20 is an important marker of cardiovascular prognosis, it was also intended to investigate how ABP associates with the decline of renal function in both diabetic and non-diabetic patients with hypertension.
Methods
Participants and measurements
This retrospective observational study included 1924 diabetic and non-diabetic hypertensive patients who were observed in the Hypertension Unit Hospital Pedro Hispano, Matosinhos, Portugal, between 2000 and 2014. Only patients with 4 or 5 valid determinations of plasma creatinine in the last 5 years were included. Excluding criteria were the presence of arm circumferences >41 cm, atrial fibrillation or other arrhythmias that could interfere with ABP recordings, and previous cardiovascular events.
Blood pressure measurement
At the first year of study, BP was measured in office (casual BP) before ABP monitoring with validated semiautomatic devices after 5 minutes of rest in a sitting position. Office BP value was considered the average of three readings taken 2 minutes apart. ABP monitoring studies were carried out for 24–25 hours on a working weekday with a Spacelabs 90207 (Redmond, WA, USA). Appropriate cuff sizes were used. The patients were instructed to engage in normal activities, but to avoid strenuous exercise, keep the arm immobile, and stop moving and talking at the time of cuff inflation. BP readings were obtained automatically at 20-minute intervals during the awake (daytime) period and at 30-minute intervals during sleep (nighttime) periods. At least 85% of valid recordings were required. The absolute and the percentage of the decrease of nighttime SBP versus daytime SBP were calculated in all subjects. Patients were instructed to undertake their usual daily activities. These periods were considered as representatives of the awake and sleep blood pressures, respectively. The nocturnal SBP fall (%) was calculated as 100 × (1 − sleep SBP/awake SBP ratio). All individual data such as age, gender, body mass index (BMI), and details of antihypertensive treatment were collected at the time of ABP monitoring. All individual ABP monitoring recordings, as well as subjects’ anthropometric data and ongoing therapeutics, were exported with a macro to a spreadsheet from which all calculations were done.
The BMI was calculated by dividing the weight in kilograms by the square of the height in meters, and obesity was defined as BMI ≥ 25.0 kg/m2 for both men and women. Subjects were identified as having diabetes if they had at any moment fasting plasma glucose concentrations ≥126 mg/dL, glycated hemoglobin (HbA1c) values ≥6.5%, or if they were on antidiabetic medications. Triglyceride and low-density lipoprotein cholesterol concentrations were measured by using enzymatic methods, and high-density lipoprotein cholesterol concentrations were measured directly. Twenty-four-hour urine collection was obtained during the first year of the study and during at least two of the next years to measure urinary albumin levels. Completeness of 24-hour sampling was assured as described previously.21 Serum creatinine was measured by using an enzymatic method, and the estimated GFR (eGFR, expressed as mL/min/1.73 m2) was calculated using the chronic kidney disease epidemiology collaboration equation22 and by the Modification of Diet in Renal Disease (MDRD) variable equation. Because important differences between these two equations were not found, this study opted to use MDRD as the elected method to evaluate eGFR. Stages of CKD were defined concerning eGFR level (mL/min/1.73 m2) as stage 1 (>90), stage 2 (>60 to 90), stage 3a (>45 to 60), stage 3b (>30 to 45), stage 4 (>15 to 30), and stage 5 (≤15). The Ethics Committee of Hospital Pedro Hispano approved the protocol of the study that incorporated both the inclusion and analysis of that data. Considering the nature of the study, patient consent to review the medical records was not required and patient data confidentiality was fully assured.
Statistical analysis
Data are shown as mean ± SD if normally distributed or otherwise as a percentage. Continuous variables in patient groups were compared by analysis of variance. Categorical variables were compared by χ2 test. Student’s t-test was used for continuous variables and Pearson’s test for linear correlations. Multivariate model for the annual reduction of eGFR >10% was undertaken using covariates selected for entry into each linear regression model if crude p value was <0.10. A p<0.05 was accepted as statistically significant. Statistical analysis was performed by using Statistical Package for the Social Sciences version 22.0 (SPSS Inc., Chicago, IL, USA).
Results
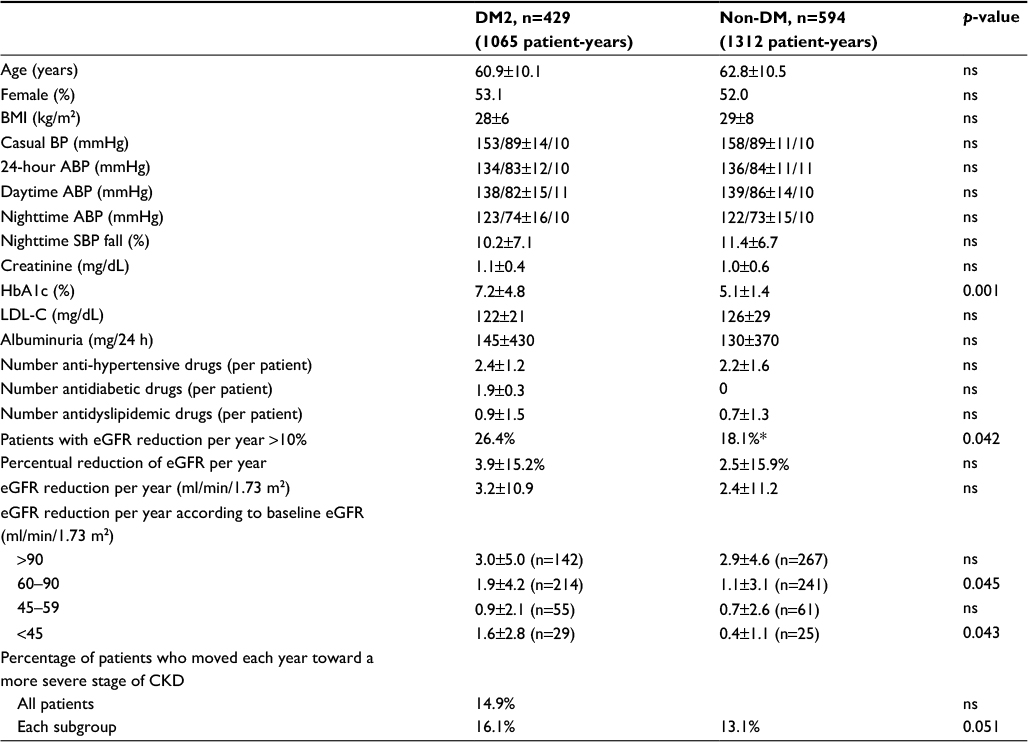
Out of a total of 1924 patients, 1023 patients (594 non-DM and 429 DM2, 53% female, aged 62.1 ± 10.2 years) were evaluated over 5 years for the annual evolution of renal function (eGFR) corresponding to the analysis of 2378 patient-years. As shown in Table 1, DM2 did not differ from non-DM for the general anthropometric values as well as for casual and ABP mean net values; nighttime BP fall; plasma creatinine, lipids, uric acid, and albuminuria; and the number of antihypertensive and antidyslipidemic drugs. DM2 versus non-DM showed a significantly higher HbA1c value, and only diabetic patients received antidiabetic drugs. Table 1 also shows the annual deterioration of renal function in DM2 and non-DM hypertensive patients. Each year, eGFR was reduced in percentage and in net average values by 3.2 in DM2 versus 2.4 mL/min/1.73 m2 in non-DM (p=0.056, ns [non-significant]), being slightly higher (p=0.051) in DM2 female versus DM2 male (3.5±11.2 vs 2.9±10.4 mL/min/1.73 m2, p=0.051), and in non-DM female than in non-DM male (2.7±10.2 vs 2.2±10.7 mL/min/1.73 m2, p=0.10). Table 1 shows that the annual reduction of eGFR was generally greater in subjects with higher baseline eGFR and lower in subjects with the lowest baseline eGFR. In the subgroups of baseline eGFR particularly in the subgroup with eGFR between 60 and 90 mL/min/1.73 m2 and in the subgroup with eGFR <45 mL/min/1.73 m2, the annual reduction of eGFR was higher in patients with DM2 than in non-DM patients. Table 1 shows that on average 14.9% of all DM2 and non-DM patients moved each year toward a more severe stage of CKD (within the stages 1, 2, 3a, 3b, 4, and 5) with no statistical significance between groups of DM2 versus non-DM. Also for initial eGFR <90 mL/min/1.73 m2, 26.4% of DM2 and 18.1% of non-DM patients showed a reduction per year of >10% of the previous GFR value (Χ2, p=0.042). As shown in Figure 1, DM2 versus non-DM disclosed a higher prevalence of stage 3 CKD (GFR 30–59 mL/min/1.73 m2), that is, 24.0% versus 18.0% (p<0.02) and higher prevalence of stage 4 and 5 CKD. Figure 2 shows that the reduction per year of eGFR correlated significantly with the annual increase of 24-hour urinary albumin excretion (after transformation to logarithm values). Also the annual decline of renal function was higher in subjects with albuminuria ≥30 mg/24 hours (n=353) than in subjects with albuminuria <30 mg/24 hours (an eGFR decline of 3.10±5.92 vs 1.41±4.13 mL/min//1.73 m2 per year, p<0.01). Table 2 shows the result of multivariate analysis in which age, nighttime BP, the use of double inhibition of renin angiotensin system, baseline values of HbA1c >8.0%, and baseline 24-hour urinary albumin excretion (converted to logarithm values) were independent factors associated with the deterioration of GFR (>10% per year). BMI had no significant effect on the annual decline of eGFR in our patients. Baseline levels of albuminuria (after transformation to logarithm values) correlated significantly with the baseline ABP values particularly with nighttime systolic BP (r=0.278, p<0.001), with HbA1c (r=0.180, p<0.004) and with eGFR (r=0.443, p<0.001) but not with age, BMI, and gender. However, the annual increase of 24-hour urinary albumin excretion (after transformation to logarithm values) correlated only with the decline of GFR but not with baseline values of age, ABP levels, HbA1c, and BMI.
 | Table 1 Clinical and demographic characteristics of study participants Note: Data presented as mean ± standard deviation unless stated otherwise. Abbreviations: ABP, ambulatory blood pressure; BMI, body mass index; BP, blood pressure; CKD, chronic kidney disease; DM2, type 2 diabetes; eGFR, estimated glomerular filtration rate; HbA1c, glycosilated hemoglobin; LDL-C, low-density lipoprotein cholesterol; ns, nonsignificant; SBP, systolic blood pressure. |
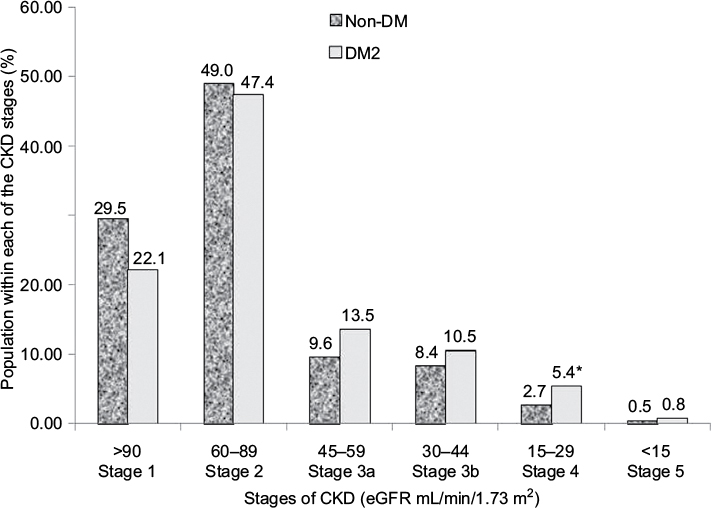 | Figure 1 Prevalence of stages of CKD in hypertensive patients with DM2 and non-DM. Note: *P<0.05 DM2 vs non-DM. Abbreviations: DM2, type 2 diabetes; CKD, chronic kidney disease; eGFR, estimated glomerular filtration rate. |
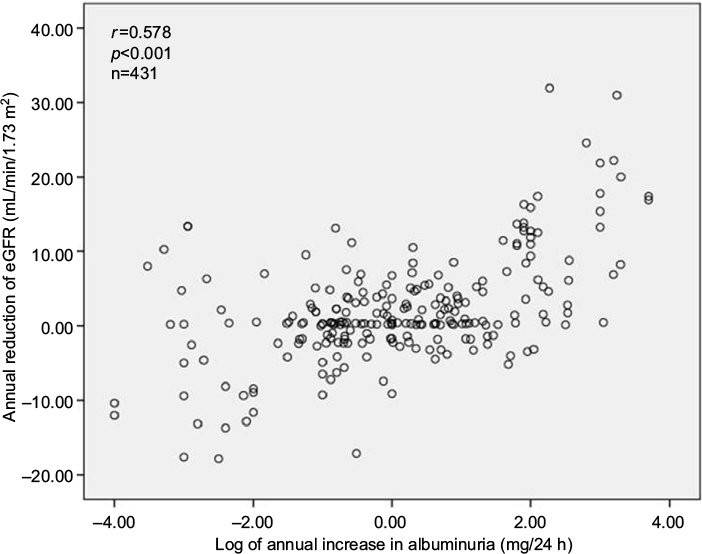 | Figure 2 Annual reduction plot of eGFR versus annual increase in albuminuria. Abbreviation: eGFR, estimated glomerular filtration rate. |
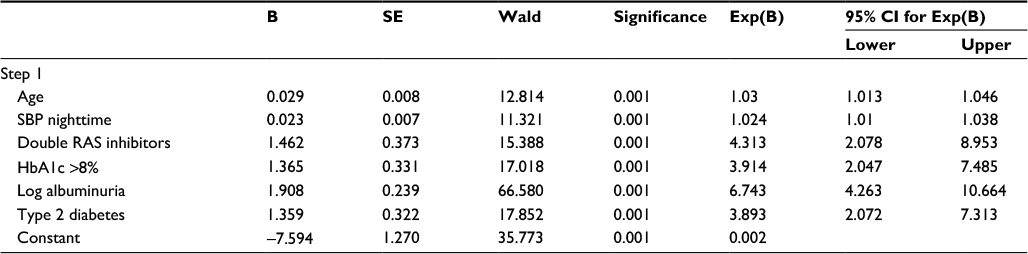 | Table 2 Multivariate analysis assessing independent factors associated with the reduction per year of the eGFR >10% in all the population Abbreviation: CI, confidence interval; eGFR, estimated glomerular filtration rate; HbA1c, glycosilated hemoglobin; RAS, renin angiotensin system; SBP, systolic blood pressure; SE, standard error. |
Discussion
CKD complicates hypertension and diabetes. Knowledge of the deterioration rate of CKD may anticipate adjustment of therapies with predominant renal elimination. This study aimed to evaluate the rate of annual deterioration of renal function in a large cohort of hypertensive patients either with (DM2) or without (non-DM) diabetes followed for 5 years in a reference outpatient hospital clinic of hypertension and to relate it with BP and glycemic control. We also assessed some clinical and biochemical factors associated with the annual eGFR loss. It was found that a progressive deterioration of renal function each year is frequent in diabetic and nondiabetic hypertensive patients and is between 2.4 and 3.2 mL/min /1.73 m2 per year. Particularly in diabetic patients, such data are in line with results from others5,10,23–25 with similar ages and baseline renal function. In addition to these findings, it was found that 26% of diabetic and 18% of non-diabetic patients present each year with deterioration of the renal function that is expressed by the decline per year of eGFR >10%. As expected, the net value of annual decline of eGFR was more pronounced in subjects with baseline eGFR >60 mL/min/1.73 m2 than in subjects with a more deteriorated renal function at baseline. This study cannot exclude that it may represent a possible normalization of hyperfiltration or the beginning of the decline related to CKD. Also it was observed that ~15% of patients move each year toward a more severe stage of CKD. These data may have several clinical implications. Such a predictable annual decline in renal function strongly recommends the need for a frequent analytical control (at least twice a year) of the renal function in these patients, especially when they are treated with many medications (such as several antidiabetic and antihypertensive drugs) that are predominantly excreted by kidneys, thus requiring important dose adjustments as soon as renal function deteriorates. Otherwise, whenever possible, the preference in these stages for drugs that are not excreted predominantly by kidneys may be advisable. This study observed that several factors seem to contribute independently to the annual deterioration of renal function such as age and diabetes condition, baseline values of nighttime BP and albuminuria, and the simultaneous use of two or more drugs from the family of renin–angiotensin–aldosterone modulators. Confirming other data,13–15 age was an important determinant of the annual eGFR loss. However, annual rate of decline of eGFR in this study was much higher compared to that found13 in healthy subjects (0.85 mL/min/1.73 m2 per year) and in hypertensive populations (1.18 mL/min/1.73 m2 per year) with the same age. The reduction of GFR and albuminuria are considered important markers of progression toward CKD and cardiovascular events in the general population7 and in patients with DM2.8,9 However, the cause of CKD in DM2 and hypertension seems to be heterogeneous because not always do the rate of progression of albuminuria and the rate of decrease of GFR occur in parallel.10,11 It was found that the annual decline of eGFR correlated with the annual increase in albuminuria. Also in both DM2 and non-DM patients, the presence of albuminuria ≥30 mg/day was associated with double the rate of decline of eGFR. It has been suggested19 that particularly in patients with proteinuria the increase in BP strongly accelerates kidney damage. This study showed that high ABP and proteinuria were independently related with greater decline of eGFR. This may agree with data from others19,26 who showed that subjects with higher grades of proteinuria had faster eGFR decline when higher casual BP was present. This may indicate that BP particularly during 24 hours must be rigorously controlled in subjects with proteinuria as has been recommended.1 Also, at baseline, albuminuria and eGFR shared common risk factors, such as ABP values and HbA1c levels. Although this may suggest some interdependence between these variables, as described by others10,23–25,27 a distinct set of variables was found, which predicted one but not the other. In fact whereas the annual decline of eGFR was predicted by age, diabetes condition, baseline values of nighttime BP and albuminuria, and the simultaneous use of two or more drugs from the family of renin–angiotensin–aldosterone modulators, the only variable that predicted the annual increase of albuminuria was the annual decline of eGFR. Concerning the role of glycometabolic control, as previously described by others,10,28 it was found that HbA1c was related to baseline albuminuria but not with baseline or annual decline of eGFR. However, this study found that in DM2 patients the worst glycometabolic control as indicated by values of HbA1c ≥8% at baseline predicted the annual decline of eGFR. Thus, the high variation of glycometabolic control may explain some controversy10,23,25 and contradictory results on the relation between diabetes control and evolution of renal function. In this study, annual decline in renal function was predicted by the simultaneous use of two or more drugs from the family of renin–angiotensin–aldosterone modulators. This is in accordance with the guidelines1 recommendation of avoidance of that practice to avoid the demonstrated29,30 increased risk of hyperkalemia and deterioration of renal function. One striking finding in this study was related to the observation that in both DM2 and non-DM hypertensives, nighttime systolic blood pressure predicted the annual decline of eGFR. The relation between hypertension and diabetes with CKD is well demonstrated.3–6 It is well known1 that ABP performs better than clinical BP in predicting cardiovascular outcome. The impacts of BP load on target organ damage in patients with CKD are largely unclear. It has been recently shown20,31 that, among the different methods of BP evaluation, nighttime systolic BP had the strongest relationship with cardiovascular events. A few studies32–34 have found an association of nighttime BP with the levels of renal function in CKD. The observation that nighttime systolic BP is an independent predictor of annual decline of eGFR in hypertensive subjects with and without diabetes was added to the above-mentioned findings. As observed by others,13,35 this study found that the annual rate of decline in eGFR was not affected by BMI. This study has some limitations, such as the absence of information on the longitudinal variation of ABP, lipid profile including triglycerides, changes of medications, food and smoking habits, and anthropometric parameters; that is, several factors that could influence the annual eGFR evolution.
Conclusion
In conclusion, this study examined the annual eGFR decline and some predictors of it during a 5-year follow-up in a cohort of diabetic and nondiabetic hypertensive patients. It found that a progressive deterioration of renal function for each additional year is frequent in these patients. A high percentage of hypertensive patients with and without diabetes move each year toward more severe stages of CKD that may have consequences on the choice of antidiabetic and antihypertensive medications. Beyond aging, annual renal deterioration may be particularly dependent on BP control particularly at nighttime, on therapy, on albuminuria at baseline and its modification with time, and on highly abnormal glucose levels.
Acknowledgment
Part of the data of the present manuscript was presented during the 50th EASD annual Meeting, September 15–19, 2014, Vienna, Austria.
Disclosure
The authors report no conflicts of interest in this work.
References
Mancia G, Fagard R, Narkiewicz K, et al. 2013 ESH/ESC guidelines for the management of arterial hypertension: the Task Force for the Management of Arterial Hypertension of the European Society of Hypertension (ESH) and of the European Society of Cardiology (ESC). Eur Heart J. 2013;34(28):2159–2219. | ||
Global Report on Diabetes. Geneva: World Health Organization; 2016. | ||
Appleby C, Foley RN. Hypertension in end-stage renal disease. Minerva Urol Nefrol. 2002;54(1):37–43. | ||
Authors/Task Force Members, Ryden L, Grant PJ, et al. ESC Guidelines on diabetes, pre-diabetes, and cardiovascular diseases developed in collaboration with the EASD: the Task Force on diabetes, pre-diabetes, and cardiovascular diseases of the European Society of Cardiology (ESC) and developed in collaboration with the European Association for the Study of Diabetes (EASD). Eur Heart J. 2013;34(39):3035–3087. | ||
de Boer IH, Rue TC, Hall YN, Heagerty PJ, Weiss NS, Himmelfarb J. Temporal trends in the prevalence of diabetic kidney disease in the United States. JAMA. 2011;305(24):2532–2539. | ||
National Kidney Foundation. KDOQI Clinical Practice Guideline for Diabetes and CKD: 2012 update. Am J Kidney Dis. 2012;60(5):850–886. | ||
Matsushita K, Coresh J, Sang Y, et al. Estimated glomerular filtration rate and albuminuria for prediction of cardiovascular outcomes: a collaborative meta-analysis of individual participant data. Lancet Diabetes Endocrinol. 2015;3(7):514–525. | ||
James MT, Grams ME, Woodward M, et al. A meta-analysis of the association of estimated GFR, albuminuria, diabetes mellitus, and hypertension with acute kidney injury. American J Kidney Dis. 2015; 66(4):602–612. | ||
Fox CS, Matsushita K, Woodward M, et al. Associations of kidney disease measures with mortality and end-stage renal disease in individuals with and without diabetes: a meta-analysis. Lancet. 2012; 380(9854):1662–1673. | ||
De Cosmo S, Rossi MC, Pellegrini F, et al. Kidney dysfunction and related cardiovascular risk factors among patients with type 2 diabetes. Nephrol Dial Transplant. 2014;29(3):657–662. | ||
Thomas MC, Macisaac RJ, Jerums G, et al. Nonalbuminuric renal impairment in type 2 diabetic patients and in the general population (National Evaluation of the Frequency of Renal impairment cO-existing with NIDDM [NEFRON] 11). Diabetes Care. 2009;32(8):1497–1502. | ||
Berg UB. Differences in decline in GFR with age between males and females. Reference data on clearances of inulin and PAH in potential kidney donors. Nephrol Dial Transplant. 2006;21(9):2577–2582. | ||
Cohen E, Nardi Y, Krause I, et al. A longitudinal assessment of the natural rate of decline in renal function with age. J Nephrol. 2014;27(6):635–641. | ||
Lindeman RD, Tobin J, Shock NW. Longitudinal studies on the rate of decline in renal function with age. J Am Geriatr Soc. 1985;33(4):278–285. | ||
Rowe JW, Andres R, Tobin JD, Norris AH, Shock NW. The effect of age on creatinine clearance in men: a cross-sectional and longitudinal study. J Gerontol. 1976;31(2):155–163. | ||
Sarnak MJ, Greene T, Wang X, et al. The effect of a lower target blood pressure on the progression of kidney disease: long-term follow-up of the modification of diet in renal disease study. Ann Intern Med. 2005;142(5):342–351. | ||
Wright JT Jr, Bakris G, Greene T, et al. Effect of blood pressure lowering and antihypertensive drug class on progression of hypertensive kidney disease: results from the AASK trial. JAMA. 2002;288(19):2421–2431. | ||
Jerums G, Premaratne E, Panagiotopoulos S, MacIsaac RJ. The clinical significance of hyperfiltration in diabetes. Diabetologia. 2010;53(10):2093–2104. | ||
Hirayama A, Konta T, Kamei K, et al. Blood pressure, proteinuria, and renal function decline: associations in a large community-based population. Am J Hypertens. 2015;28(9):1150–1156. | ||
Salles GF, Reboldi G, Fagard RH, et al. Prognostic effect of the nocturnal blood pressure fall in hypertensive patients: the ambulatory blood pressure collaboration in patients with hypertension (ABC-H) meta-analysis. Hypertension. 2016;67(4):693–700. | ||
Polonia J, Lobo MF, Martins L, Pinto F, Nazare J. Estimation of populational 24-h urinary sodium and potassium excretion from spot urine samples: evaluation of four formulas in a large national representative population. J Hypertens. 2017;35(3):477–486. | ||
Levey AS, Stevens LA, Schmid CH, et al. A new equation to estimate glomerular filtration rate. Ann Intern Med. 2009;150(9):604–612. | ||
Adler AI, Stevens RJ, Manley SE, et al. Development and progression of nephropathy in type 2 diabetes: the United Kingdom Prospective Diabetes Study (UKPDS 64). Kidney Int. 2003;63(1):225–232. | ||
Bruno G, Merletti F, Biggeri A, et al. Progression to overt nephropathy in type 2 diabetes: the Casale Monferrato Study. Diabetes Care. 2003;26(7):2150–2155. | ||
Rossing K, Christensen PK, Hovind P, Tarnow L, Rossing P, Parving HH. Progression of nephropathy in type 2 diabetic patients. Kidney Int. 2004;66(4):1596–1605. | ||
Peterson JC, Adler S, Burkart JM, et al. Blood pressure control, proteinuria, and the progression of renal disease. The Modification of Diet in Renal Disease Study. Ann Intern Med. 1995;123(10):754–762. | ||
Parving HH, Lewis JB, Ravid M, Remuzzi G, Hunsicker LG; DEMAND investigators. Prevalence and risk factors for microalbuminuria in a referred cohort of type II diabetic patients: a global perspective. Kidney Int. 2006;69(11):2057–2063. | ||
Takagi M, Babazono T, Uchigata Y. Differences in risk factors for the onset of albuminuria and decrease in glomerular filtration rate in people with type 2 diabetes mellitus: implications for the pathogenesis of diabetic kidney disease. Diabet Med. 2015;32(10):1354–1360. | ||
Parving HH, Brenner BM, McMurray JJ, et al. Baseline characteristics in the Aliskiren Trial in Type 2 Diabetes Using Cardio-Renal Endpoints (ALTITUDE). J Renin Angiotensin Aldosterone Syst. 2012; 13(3):387–393. | ||
ONTARGET Investigators, Yusuf S, Teo KK, et al. Telmisartan, ramipril, or both in patients at high risk for vascular events. N Engl J Med. 2008; 358(15):1547–1559. | ||
ABC-H Investigators, Roush GC, Fagard RH, et al. Prognostic impact from clinic, daytime, and night-time systolic blood pressure in nine cohorts of 13,844 patients with hypertension. J Hypertens. 2014; 32(12):2332–2340; discussion 2340. | ||
Drawz PE, Alper AB, Anderson AH, et al. Masked hypertension and elevated nighttime blood pressure in CKD: prevalence and association with target organ damage. Clin J Am Soc Nephrol. 2016;11(4):642–652. | ||
Wang C, Zhang J, Deng W, et al. Nighttime systolic blood-pressure load is correlated with target-organ damage independent of ambulatory blood-pressure level in patients with non-diabetic chronic kidney disease. PloS One. 2015;10(7):e0131546. | ||
Wu Z, Wu X, Xing F, Zhou S, Luo B, Wang L. Blood pressure characteristics in moderate to severe renal insufficiency. Kidney Blood Press Res. 2015;40(5):478–489. | ||
Mohsen A, Brown R, Hoefield R, et al. Body mass index has no effect on rate of progression of chronic kidney disease in subjects with type 2 diabetes mellitus. J Nephrol. 2012;25(3):384–393. |
 © 2017 The Author(s). This work is published and licensed by Dove Medical Press Limited. The
full terms of this license are available at https://www.dovepress.com/terms
and incorporate the Creative Commons Attribution
- Non Commercial (unported, 3.0) License.
By accessing the work you hereby accept the Terms. Non-commercial uses of the work are permitted
without any further permission from Dove Medical Press Limited, provided the work is properly
attributed. For permission for commercial use of this work, please see paragraphs 4.2 and 5 of our Terms.
© 2017 The Author(s). This work is published and licensed by Dove Medical Press Limited. The
full terms of this license are available at https://www.dovepress.com/terms
and incorporate the Creative Commons Attribution
- Non Commercial (unported, 3.0) License.
By accessing the work you hereby accept the Terms. Non-commercial uses of the work are permitted
without any further permission from Dove Medical Press Limited, provided the work is properly
attributed. For permission for commercial use of this work, please see paragraphs 4.2 and 5 of our Terms.