Back to Journals » Patient Related Outcome Measures » Volume 10
Analytical approaches and estimands to take account of missing patient-reported data in longitudinal studies
Authors Bell ML ![]() , Floden L
, Floden L ![]() , Rabe BA
, Rabe BA ![]() , Hudgens S, Dhillon HM
, Hudgens S, Dhillon HM ![]() , Bray VJ, Vardy JL
, Bray VJ, Vardy JL ![]()
Received 5 February 2019
Accepted for publication 14 March 2019
Published 16 April 2019 Volume 2019:10 Pages 129—140
DOI https://doi.org/10.2147/PROM.S178963
Checked for plagiarism Yes
Review by Single anonymous peer review
Peer reviewer comments 2
Editor who approved publication: Professor Lynne Nemeth
Melanie L Bell,1,2 Lysbeth Floden,1,3 Brooke A Rabe,1 Stacie Hudgens,3 Haryana M Dhillon,2,4 Victoria J Bray,5 Janette L Vardy6
1Department of Epidemiology and Biostatistics, Mel and Enid Zuckerman College of Public Health, University of Arizona, Tucson, AZ 85724, USA; 2Psycho-Oncology Co-operative Research Group, School of Psychology, University of Sydney, Sydney, NSW, Australia; 3Clinical Outcomes Solutions, Tucson, AZ 85718, USA; 4Centre for Medical Psychology & Evidence-Based Decision-Making, School of Psychology, University of Sydney, Sydney, NSW, Australia; 5Department of Medical Oncology, Liverpool Hospital and University of Sydney, Sydney, NSW, Australia; 6Concord Cancer Centre and Sydney Medical School, University of Sydney, Sydney, NSW, Australia
Abstract: Patient-reported outcomes, such as quality of life, functioning, and symptoms, are used widely in therapeutic and behavioral trials and are increasingly used in drug development to represent the patient voice. Missing patient reported data is common and can undermine the validity of results reporting by reducing power, biasing estimates, and ultimately reducing confidence in the results. In this paper, we review statistically principled approaches for handling missing patient-reported outcome data and introduce the idea of estimands in the context of behavioral trials. Specifically, we outline a plan that considers missing data at each stage of research: design, data collection, analysis, and reporting. The design stage includes processes to prevent missing data, define the estimand, and specify primary and sensitivity analyses. The analytic strategy considering missing data depends on the estimand. Reviewed approaches include maximum likelihood-based models, multiple imputation, generalized estimating equations, and responder analysis. We outline sensitivity analyses to assess the robustness of the primary analysis results when data are missing. We also describe ad-hoc methods, including approaches to avoid. Last, we demonstrate methods using data from a behavioral intervention, where the primary outcome was self-reported cognition.
Keywords: estimands, sensitivity analysis, missing data, imputation, patient-reported outcomes
Plain language summary
Clinical trials investigate the effectiveness of new treatments such as drugs or behavioral interventions. Sometimes, analysts use a patient’s own assessment of their quality of life, symptoms, or functioning, to gauge success of the new treatment. These assessments, called patient-reported outcomes, or PROs, are often collected repeatedly over the course of a trial, and may involve collection of multiple items from lengthy questionnaires. Hence, due to the potential burden of data collection, it is common for PRO data to have missing values. Data with many missing values can compromise the validity of a trial and reduce confidence in any conclusion of treatment success.
This paper presents approaches for dealing with missing data in PROs. First, the number of missing values can be minimized with good planning at the initial stages of the trial design. Next, if the data have some missing values after the completion of a trial, sophisticated statistical models can mitigate the effects of missing values and help to ensure the conclusions with not be biased. Finally, researchers can further strengthen confidence in their results by conducting sensitivity analyses which examine alternative plausible scenarios for the missing PROs. This paper demonstrates the analytic methods described with an example from a trial that explored the effects of brain-training exercises on self-reported cognition.
Introduction
Patient-reported outcomes (PROs) represent the patient’s unique articulation of symptoms, function, tolerability, and health-related quality-of-life as these outcomes are collected “directly from the patient without interpretation of the patient’s response by a clinician or anyone else”.1 When collected simultaneous to clinical and physiological endpoints, information on the overall impact on a patient’s health is more completely reflected in clinical trials and observational studies.
PROs have become increasingly important in behavioral trials as well as drug development, in part because of the 21st Century Cures Act (2017), the most recent mandate in the United States, requiring patient experience data as part of new drug development applications.2 Considerations for the implementation of PROs in clinical trials are multifaceted as patient engagement in the data collection process is mandatory. More specifically, collection of PRO assessments requires patients to report their health status at multiple time intervals (eg, daily diary, weekly, monthly) either in clinic or outside the clinic environment, which introduces potential for missing data.3
Recent developments in the missing data and clinical trials literature include the definition of estimands, or in other words, what is to be estimated. The components of an estimand are the population of interest, the outcome of interest, and the data to be used in estimation. The latter is directly related to the handling of missing data.
Missing data are common
Assessment of PROs is important, but missing data can undermine the validity of research results. In research settings where patients are measured repeatedly over time, it is nearly impossible to avoid some missing data. Bell et al show that 95% of randomized controlled trials (RCTs) reported in the top medical journals have missing data, with a median missingness rate of 9%.4 Cluster randomized and noninferiority trials also have high rates of missing data.5,6
Missing data definitions
The missing data pattern refers to the timing of missed observations. Missing data may be intermittent, where a patient returns following a missed assessment, or monotonic, where no more assessments are taken after a missed assessment. The latter is also known as dropout and may result from loss to follow-up or patient withdrawal due to illness or death. Data may also be missing if a patient discontinues the study intervention, and no further measurements are taken. It is recommended that despite treatment discontinuation, assessments should be continued.7
The underlying reason data are missing is called the missingness mechanism. Rubin defined a hierarchy of mechanisms: missing completely at random (MCAR), missing at random (MAR), and missing not at random (MNAR).8 Data are termed MCAR if the probability of missingness is unrelated to observed data. Data are MAR if, conditional upon the covariates and previously observed outcome data, the probability of missingness is not associated with unobserved outcome data. MNAR data are those where the missingness depends on the missing data itself, even after taking observed data into account. This is also sometimes referred to as informative, or nonignorable, missing data. One can determine whether data are not MCAR by testing associations of observed data with missingness, using, for example, logistic regression or Chi-squared tests. However, one cannot conclusively state that data are MCAR, as unobserved data could still be associated with missingness. There is no way to distinguish MAR from MNAR, because, by definition, the salient data are missing.
Although data are often referred to as MCAR, MAR, or MNAR, in fact, one cannot separate the mechanism from the analysis.9 For example, suppose that baseline (T0) quality of life (QoL) is predictive of dropout in an RCT where there are 3 postintervention assessments of QoL, with worse QoL associated with higher likelihood of dropout. Further, suppose that the difference between arms at the third postintervention (T3) assessment is the primary endpoint. Atwo samplet-test at T3 would likely yield biased results since the T0 assessment is not used. This is an example of analysis with an implicit MCAR assumption on MAR data. A likelihood-based mixed model that included all QoL assessments, with the T0 QoL assessment used either as a covariate (as in ANCOVA) or as part of the outcome vector, would yield unbiased estimates of the difference at T3.10 This is an example of an MAR analysis assumption (because data predictive of missingness is incorporated into the analysis) on MAR data.
Implications of missing data
Missing data, at best, might only affect power by reducing sample size. However, even if all the data are MCAR, confidence in results is lessened when there is a high dropout rate: an intervention with high dropout and noncompliance rates is not a good candidate for translation into clinical or community practice. More serious than reducing power is the potential for missing data to cause bias, as alluded to in the previous example. If data are not MCAR and inappropriate analyses are undertaken, both within- and between-arm estimates can be biased in unpredictable ways.
Despite the near inevitability of missing data in longitudinal studies, most researchers perform primary analyses that make the strong assumption that data are MCAR or use simple and bias-prone methods11 such as last observation (or baseline) carried forward.4–6 Furthermore, few researchers undertake sensitivity analyses to assess the robustness of their results to the missing data assumptions of their primary analyses.4–6 The suboptimal handling of missing data may be a result of a long-time lack of guidance from regulatory agencies, including the Food and Drug Administration (FDA), the European Medicines Agency (EMA), and the International Conference on Harmonisation (ICH). This led to an FDA commissioned report by the National Research Council (NRC) on the treatment and prevention of missing data in clinical trials.7,12 Despite this 2010 guidance document, translation into applied research has been slow, as evidenced by the previously referenced reviews.
Specific aims
The aim of this paper is to review statistically principled approaches for handling missing PRO data, and to introduce the idea of estimands in the context of behavioral trials. We focus primarily on monotonically missing continuous outcome data in longitudinal RCTs, where outcomes are measured repeatedly through time, but many of the concepts can be applied to other designs, settings, outcome types, and covariate data. We demonstrate methods using data from a behavioral intervention, where a PRO endpoint was the primary outcome. While discussing several approaches, we demonstrate methods that are implemented using standard statistical software.
Planning for missing data
Researchers should create a plan that considers missing data at each stage of the research: design, data collection, analysis, and reporting.7 The plan should minimally include or prespecify the following: 1) prevention; 2) definition of estimands; 3) primary analysis; and 4) sensitivity analysis. Additionally, auxiliary data should be collected. These are collected data that may be correlated with the primary outcome and/or missingness, and which can be used in modeling.
Prevention
While there are various analytical techniques for handling missing data, prevention is always preferred, as statistical approaches for handling missing data all have strong, often unverifiable assumptions. The NRC report has emphasized the importance of prevention, as is evidenced by its inclusion in the report’s title.7,13 During the design stage, researchers need to consider how to prevent and minimize missing data.12,14 In studies with PROs, participant burden, questionnaire length, timing, and length of follow-up should be considered, as these are factors associated with missing data. When measuring efficacy or effectiveness, a run-in period, where patients may be monitored for compliance (and possibly further screened for eligibility), may be used to ensure randomized patients are less likely to drop out and more likely to adhere to the intervention. Adequate resources and training for study personnel are also key, with quality control and quality assurance focusing on prevention of missing data. Even if a patient withdraws from the intervention, assessments should continue, as these observations may be used in the estimands of interest.12
Defining the estimands
Emphasized by the 2010 NRC report, the underpinning idea of estimands is to align the trial objectives, target population of interest, outcomes, and analyses. The handling of missing data plays a key role in defining estimands.7,9,13,15–17 The ICH-E9-R1 addendum on estimands and sensitivity analyses states that estimands are defined by the target population; the outcome of interest; the specification of how post-randomization events (eg, dropout, treatment withdrawal, noncompliance, rescue medication) are reflected in the research question; and the summary measure (such as difference in means or odds ratio) for the endpoint.18 Estimands can be classified into two categories based on adherence to the protocol.17 Efficacy, sometimes called de jure (by the rules, per protocol), is the effect of the intervention under full compliance with the treatment protocol. This may be a hypothetical estimand if there are missing outcome data, and the estimate of the intervention effect is based on the assumption that all patients adhered to the protocol. (This is particularly so if the subsample of protocol adherers is used to impute values for patients who did not adhere or who dropped out.) Effectiveness, sometimes called de facto (as taken, intention to treat [ITT]) is the intervention effect without consideration of adherence or effects of rescue medication. In the context of PRO scores in behavioral studies, nonadherence might include seeing a therapist outside of the study, or having to start a hypertension drug when a physical activity intervention to lower blood pressure fails. Since it is rare that all patients in a study have complete follow-up, assumptions about patients with incomplete data must be made. These assumptions are, in general, untestable, but can often be reasonably justified with the aid of expert knowledge.
The emphasis on estimands is a shift away from the terminology of the ITT principle, which states that all individuals should be analyzed in the arm to which they were randomized. ITT preserves the balancing of confounders that is achieved by randomization and evaluates a treatment policy (the ITT). However, the term ITT is used inconsistently, particularly when researchers define a “modified ITT”.17,19 This led to the 2010 update of the CONSORT statement to recommend not using the term, but instead be explicit about who was included in the analyses and why. There are similar concerns about the term “per-protocol”; see Carpenter et al for a more complete discussion of confusion in terminology.17 Beyond issues with inconsistent use of terminology, the emphasis on estimands is an acknowledgment that in some research situations, the ITT analysis set may not be possible or may not address the research objective.15,18 For example, the trial’s objective may be to determine efficacy (causal effect of the intervention), rather than effectiveness (treatment policy), which the ITT set may not be appropriate for.15,18,20 Thoughtful ITT analyses have been proposed. White et al have proposed a careful 4-point ITT analysis strategy that includes recommendations for patient follow-up after withdrawal, primary and sensitivity analytic approaches, their assumptions, and plausibility.21
Much of the literature on estimands focuses on drug trials, which may have different analytical issues regarding missing data than behavioral trials. For example, drug trials often have shorter postintervention follow-up times than behavioral trials. This may limit the amount of missing assessments, or have implications for the effect of intervention, which may wain after discontinuation. Postrandomization events also differ between drug and behavioral trials. In drug trials, the use of rescue medication, treatment switching, dose modification, and the subsequent analysis is an important factor in defining the estimand. Analogous situations in behavioral trials are not likely to be as common. A critical consideration when defining estimands is whether the intervention is for a chronic condition, such as physical activity to reduce fatigue in lung cancer patients,22 or a potentially “curable” condition, such as a psychoeducational intervention to reduce fear of cancer recurrence as the patient experience is quite variable between the two:23 the study setting and context matter; there is no one universal estimand appropriate for all trials,15 just as there is no one universal analysis that should be used. More information on estimands can be found in elsewhere.7,13,15,17,18,24
Analytical approaches to handling missing data
Preliminary and descriptive statistics
The first table in a research paper is often a table of baseline characteristics such as demographic and clinical variables, stratified by intervention arm (for RCTs) or exposure (for observational studies). Each of these variables should have missing data rates indicated within the table. These variables should also be compared between subjects who drop out and subjects with complete data, in order to better understand who drops out and to whom the study results can be generalized.25 See this latter table in Appendix 1. Knowing which variables are associated with missingness can also be helpful for modeling, as they can be included in multiple imputation (MI) models and the weight model for inverse probability-weighted generalized estimating equations (GEEs).26 Missing primary outcome data rates at each time point, by intervention arm, should be shown in the CONSORT participant flow diagram. 27
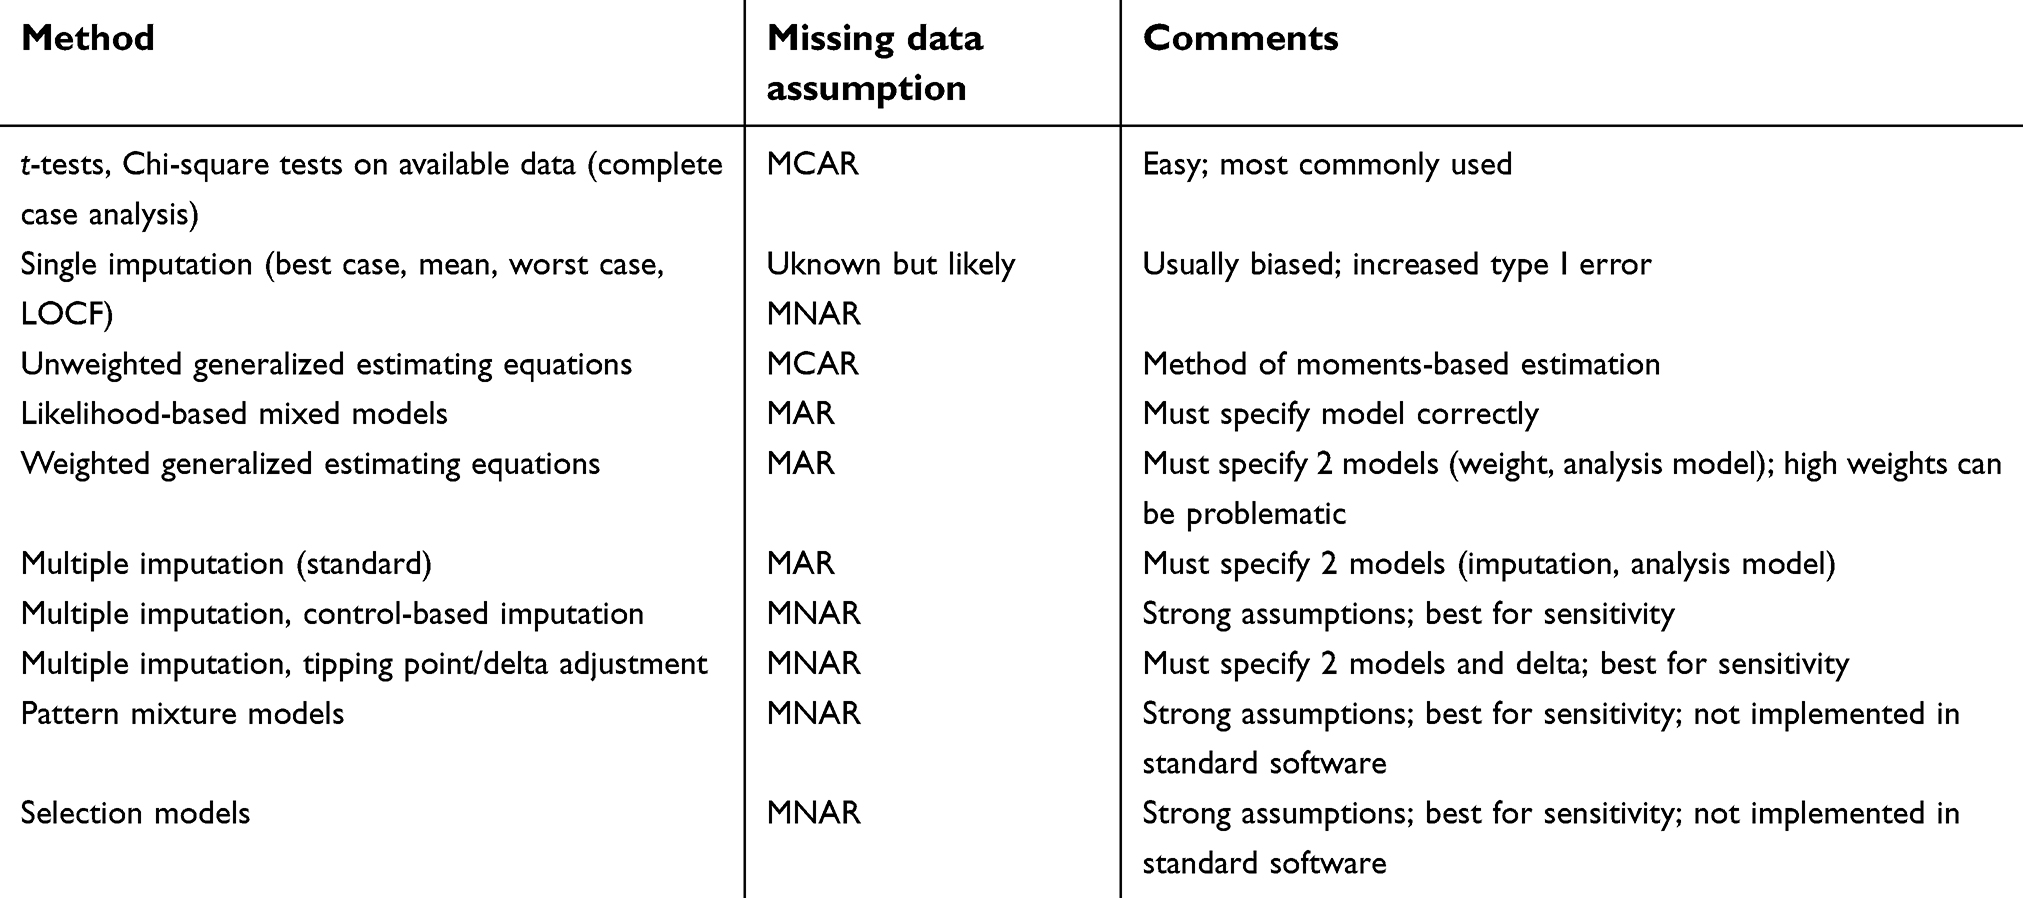 | Table 1 Statistical method, missing data assumption, and comments use or implementation |
Ad-hoc methods, including approaches to avoid
The most common method for handling missing data in RCTs is to ignore them by undertaking a complete or an available case analysis.4 These terms are sometimes used interchangeably; we will use the term complete case analysis to mean that at a given time point, those with available data at that point will be analyzed. Sometimes the term “completers” is used to refer to subjects who complete the intervention, but not necessarily all the assessments; however, we will use the term for those with complete data at all assessments (both during the intervention and follow-up). The missingness assumption of complete case analysis is MCAR for most analytical approaches for repeated measures. An important exception for complete case analysis is maximum likelihood (ML)-based mixed models. If a complete case analysis is undertaken and data are not MCAR, selection bias will most likely be introduced, as dropouts will be different from participants with complete data. It is often not clear what the estimand is when ad-hoc methods are used. There are no theoretically based rules for how much missing data one can have and still use a complete case analysis, but very low missing outcome rates are unlikely to seriously affect estimates.
Single imputation approaches are often used, but are advised against by missing data methodologists.7,10,28,29 Approaches include imputing missing values with the subject’s mean (or the mean of the subject’s arm), the baseline or last observation carried forward (LOCF), or the worst case. Single imputation can result in biased estimates and does not take into account the uncertainty associated with imputed values, and can incorrectly reduce variance, thereby inflating type I error.
ML-based models
ML-based models, including mixed models, accommodate nonindependent data, such as longitudinal or clustered data.30 While technically a complete case analysis, mixed models do an implicit imputation, “imputing” missing observations for subjects by combining the subject’s data with the subjects who have fully observed data (an MAR assumption), by weighting a function of within-subject variance and the subject’s proportion of missing data. Mixed models can include fixed and random effects, where the latter are assumed to be draws from some distribution, usually normal. The random effects account for within-subject correlation. Another popular ML approach, particularly within the pharmaceutical industry, is the mixed model for repeated measures (MMRM), where an unstructured time and covariance are used. Using time categorically (unstructured) instead of linearly allows for arbitrary response profiles over time,31 reducing the possibility of model misspecification. Models that include the baseline outcome as a covariate and treat subsequent outcomes as dependent variables are often used as well, as they increase efficiency (power). A drawback to this approach, known as ANCOVA, is that if a patient’s baseline is missing, that patient will not be included in the analysis; if the baseline value had been used in the outcome vector the patient’s data would be included. Two readable texts that give more detail on MLlikelihood models and the use of ANCOVA in the longitudinal context are Mallinckrodt et al and Fitzmaurice et al.9,32
Multiple imputation
Unlike single imputation, MI accounts for uncertainty in the imputation and does not underestimate variance. The idea behind MI is to use observed data to impute missing values for patients with missing data. (This is an MAR assumption; MI with a MNAR assumption will be discussed in the context of sensitivity analysis.) The imputation model, which is often based on regression, is used to create m complete sets of data. The m complete data sets are then analyzed using the analysis model, and estimates of interest are obtained (eg, the difference between arms at a certain timepoint or the difference between arms in the area under the curve33) and combined using special rules that correctly specify the standard errors. Most statistical software packages have implementations of MI. A full review of MI is beyond the scope of this paper; however, we give some practical advice.
The imputation model should include all variables from the analysis model, and their structure (eg, nonlinearity, interactions) should be the same, in order for MI to give valid inference.34 One should also include variables associated with missingness and the outcome, which can be assessed using correlation. Variables that have an absolute value of correlation, ρ, <0.1, with either missingness or the outcome, are not likely to improve the imputation.29 Researchers should have a predefined set of candidate variables based on their subject matter knowledge, experience, and literature. If the imputation model does not include different variables than the analytic model, similar results in a mixed model will be obtained, although the standard errors will be slightly larger.9,29 Although early literature states that 3–5 imputations should be enough, with the increasing availability of computing power and research investigating number of imputations, the recommendation has increased. One rule of thumb is to use at least the percentage of missing cases (30% missing data =>30 imputations).35 Imputation of longitudinal data should be done in “wide form”, where there is one row per subject, so that within-subject correlation is maintained. The outcome should be included in this model, especially if it is measured repeatedly over time. Imputation should be performed by treatment, or at least with a treatment indicator variable to avoid attenuating the treatment effect.36 Restricting the range, for example, when imputing a PRO scale with a possible range of 0–100, may seem desirable, but can bias results—it is generally best to keep the imputed values, even if they fall outside the possible range, such as >100 in the example.37 In the case of imputing binary outcome variables which will subsequently be used for logistic regression, and therefore requiring values of 0 or 1, one recommended option is to use imputation with chained equations (also known as fully conditional specification).38 For more details on MI, see references 32–35.38–42
Generalized estimating equations (GEEs)
GEEs are models that can handle nonindependence, such as data from longitudinal or cluster randomized trials. While primarily used for noncontinuous data, such as binary and count outcomes, these models can also be used for continuous outcomes. For noncontinuous outcomes, many researchers prefer to use GEE over their ML-based counterpart, generalized linear mixed models because the estimates are population-averaged (marginal), rather than subject-specific (conditional).32 The estimation is moment based (as opposed to ML or Bayesian), which results in bias when data are not MCAR. For researchers who prefer the population-averaged interpretation over the subject-specific interpretation, there are extensions to GEE that can give unbiased estimates for MAR data, as long as models are specified correctly: inverse probability weighted (IPW) GEE and GEE with MI. The idea behind IPW-GEE is to develop a weight model for the probability of missingness, and to use the inverse of this probability as a weight in the analysis model. For the weight model, the probability of being observed can be modeled using logistic regression, giving a predicted probability for each patient. The weight model should include variables associated with missingness and the outcome. Patients with lower likelihood of having complete data, as determined by their weights, will be weighted higher in the subsequent GEE. Weights can be subject specific or observation specific, if data are longitudinal, and these approaches are implemented in the software SAS.43,44 The NRC report recommends greater use of estimating equations,7 but their use has been limited in RCTs.4 For more information on these extensions to GEE for PROs, see Bell et al.26
Responder analysis
A responder analysis reduces a continuous outcome to a binary outcome by classifying patients as responders if they change by some predefined amount (or more). Patients who do not achieve this amount (sometimes referred to as the meaningful change threshold, MCT), or who drop out are called nonresponders. Although nonresponse imputation is recommended by regulatory agencies such as the FDA and others, it relies on the strong assumption that patients who drop out have not responded, similar to the last or baseline observation carried forward assumption, that patients who drop out remain unchanged. As with LOCF, the nonresponse imputation may be reasonable in some cases, particularly when a response is the favorable outcome. If the response is unfavorable, such as an increase in pain or cognitive deterioration, nonresponse imputation for those who drop out may be less plausible. Even in settings where the worst case assumption seems reasonable, such as imputing dropouts in a smoking cessation trial as nonresponse (return to smoking), closer examination has revealed this can be a poor strategy, resulting in false negatives.45,46 Some have suggested that response (ie, treatment success) can be defined as the composite outcome of reaching the MCT and completion of the treatment course, thereby creating a situation with no missing data, and consequently, no need to assess sensitivity. However, concerns have been raised about composite outcomes; for example, components of the composite may have treatment effects that go in opposite directions, thereby canceling each other out so that neither effect is detected.47 Other concerns include the choice of MCT, the reduction in power that comes from dichotomizing a continuous outcome, and considering a single value for interpreting change.48
Sensitivity analyses
Primary and sensitivity analyses
Ideally, a statistical analysis plan is prespecified and incorporates the objectives and estimands by stating the primary outcome and giving details about the primary and sensitivity analyses. Some methodologists recommend that the primary analysis should be based on an MAR assumption, followed by a sensitivity analysis, possibly assuming an MNAR mechanism.49 However, the objective of the study must always be foremost in the analyst’s mind, and the primary analysis may be centered on an estimand that aligns with an MNAR mechanism.
Sensitivity analyses are an investigation into how robust results are to the assumptions made in the primary analysis. A sensible sensitivity analysis (with respect to missing data) is one which relaxes the missing data assumption in a plausible way and is statistically principled. The LOCF is actually an MNAR mechanism,11 but the assumption that a subject’s outcome remains the same after they have dropped out is often not plausible (nor is it statistically principled).10,11,28 Although some researchers have asserted confidence that subjects in symptom trials drop out because the drug is ineffective,50 in behavioral trials subjects are likely to drop out for a variety of reasons. For example, in a trial to reduce fear of cancer recurrence, some subjects may drop out because they have responded well to the intervention and their fear has declined to the point that it no longer affects their life. Others may drop out because so much focus on cancer has increased their anxiety levels and exacerbated their fear.
MNAR models for sensitivity analysis
If the primary analysis includes an MAR model for missing values, investigators may conduct sensitivity analyses under plausible MNAR assumptions. While MNAR models have been discussed widely in the statistics literature, they are rarely used in applied health research. This lack of translation is likely due to their complexity, the need for specialized programming (for most MNAR models), and their strong untestable assumptions. Furthermore, lack of fit of any particular MNAR model does not provide evidence that the data are MAR or MCAR, as there are infinitely many MNAR scenarios. MNAR models include selection models, pattern mixture models, joint models, and MNAR MI, such as tipping point/delta adjustment MI and control (or reference)-based imputation.28,29 The exceptions to the lack of software implementations are the latter two MNAR-MI methods. These two MNAR-MI methods fall within a pattern-mixture framework41 and may be implemented to represent assumptions about postrandomization events appropriate for either de facto or de jure estimands.
Importantly, sensitivity analyses with respect to missing data assumptions should target the same parameters and be consistent with the estimand from the primary analysis. In particular, the handling of postrandomization events, including the inclusion or exclusion of specific protocol violations among subjects in the sample, should remain unchanged in sensitivity analysis. For example, if the primary estimand is de jure, the primary analysis under MAR might impute missing values as though subjects continued to be adherent. A corresponding sensitivity analysis would explore departures from the MAR assumption via different MNAR scenarios (eg, missingness associated with worse outcomes, better outcomes, with treatment arm interaction, etc.) while preserving the goal of estimation for the target population of protocol adherers. A study whose primary analysis focuses on a de jure estimand may include secondary or post-hoc analyses for de facto estimands and vice versa. There are benefits to including multiple estimands in a single trial as together they provide evidence for both efficacy and generalizability of an intervention.24
Given the interplay between estimands, design, and analysis, we note that inferences intimately depend on the missing data assumptions of the estimation procedure. Analyses with an MAR assumption might model the response distribution for dropouts in the same manner as complete cases (conditional upon their response history). Such an analysis implicitly assumes a continued treatment response after dropout, estimating the efficacy of the intervention and linking to the de jure estimand. Furthermore, longitudinal MNAR data cannot be predicted from observed responses; hence, MNAR analyses can reflect real-life scenarios of treatment discontinuation and worsening outcomes amenable to de facto estimands. Primary analyses and imputation models that include information on protocol violations may be more flexible in targeting relevant estimands.
MNAR-MI: control-based imputation
Control-based MI is an imputation approach that can be used for patients going off treatment or lacking follow-up, and is sometimes referred to as placebo or reference-based MI.51–53 These patients have their values imputed as in the control arm, which may be a reasonable assumption if the control arm is placebo, or in some behavioral trials, usual care, or attention control. Depending on the implementation, the intervention effect could dissipate, or could decrease over time.17 The estimate from this type of sensitivity analysis could be considered a conservative lower bound of the true efficacy value. The idea is similar to the worst-case single imputation but is more plausible and statistically principled. There are other implementations as well, outlined in Carpenter et al, including approaches that carry out statistically principled (via MI) versions of LOCF.17
Plausible departures from MAR for sensitivity analyses are study dependent. For example, in a placebo-controlled drug trial, participants who deteriorate on placebo may be given rescue medication or crossed over to the active arm. This scenario argues for imputing their missing data with the active arm’s data for the ITT/de facto estimand.17 In a behavioral trial, this would not be as likely a scenario, and an MNAR-MI with a gradual lessening of the effect of usual care or a maintaining (LOCF) may be more plausible. Regardless, this type of protocol deviation should be defined as part of the estimand.
MNAR-MI: delta adjustment/tipping point
Another useful and relatively easy-to-understand sensitivity analysis using MI is the tipping point/delta adjustment method. The idea is to undertake an MI using the MAR assumption, ie, assume that subjects who drop out are similar to subjects who complete the trial, and then add multiples of some quantity delta to the imputed outcome values (−kδ, …−2δ, −δ, δ, 2δ, … kδ). These new datasets are then analyzed and the point at which statistical significance “tips” is noted. If the additions to the imputed values are unlikely at the tipping point, then a researcher can have confidence in the results. Alternatively, one can add only plausible values of delta to the imputed values to get a range of estimates that represent worst to best cases. Leacy et al demonstrate these types of sensitivity analyses using binary outcomes.54 New research on MNAR-MI continues to emerge, eg, see Tompsett et al55.
Table 1 gives a summary of methods, their missing data assumptions, and comments about their usage.
Example
We demonstrate several statistical methods using an example from a real trial. Estimates of the difference in a PRO between treatment arms for different methods and estimands are given.
Trial description
An RCT conducted across 18 Australian sites evaluated an intervention designed to improve self-reported cognitive functioning and QoL in 242 cancer survivors who had completed at least three cycles of adjuvant chemotherapy 6–60 months prior. Participants included adults aged 18 years or older with any solid primary tumor (excluding malignancies of the central nervous system), who reported problems with cognition.56 The intervention was 15 weeks and consisted of a recommended 40 hrs of a home-based, web cognitive training program “Insight” versus usual care.57 The primary outcome was self-reported cognition at 6 months, as assessed by the Functional Assessment of Cancer Therapy-Cognition (FACT-Cog), a 33-item reliable and valid scale, where higher values indicate better self-reported functioning.48 The possible range is 0–132. Participants were measured at baseline (T1), postintervention (T2), and 6 months postintervention (T3). Protocol deviations, in this context, are considered to be dropout or poor adherence to the intervention. There was no “rescue medication” analog in this trial. The primary results are available elsewhere.56 Consent and ethical approval were obtained for the original study.
Statistical methods
We define de facto (primary) and de jure (secondary) estimands for the difference in self-reported cognition between arms at 6 months. The target population for the de facto estimands includes all randomized participants, without regard for adherence. We exclude 7 participants with intermittent data, so as not to become mired in details, so that the full analysis set consists of n=235 participants. The target population for the de jure estimands are the n=179 adherers (defined in the results section).
The de facto estimands include an MMRM, an MMRM with MI, GEE with MI, IPW-GEE, all which assume data are MAR. Two MI-MNAR models were also used to estimate de facto estimands in sensitivity analyses. The first included the same variables as other MI models, but imputed missing cognition data from the control arm (MNAR-MI1). The second also included the same variables as other MI models, but imputed missing cognition data from the control arm plus all nonadherers (MNAR-MI2). The de jure estimands for this example were considered secondary estimands and included the same models as above except for MNAR-MI2, as nonadherers were not part of the target population for this estimand.
All GEEs used terms for time, treatment arm, and their interaction to allow for different patterns of change and robust sandwich variance estimates assuming an independent covariance structure. All mixed models also used terms for time, treatment arm, and their interaction. The MMRM used an unstructured time and covariance structure. MI was carried out using imputation with chained equations as implemented in SAS Proc MI with 50 imputations, using variables that were associated with missingness, self-reported cognition or both, as assessed by Kendall’s tau correlation. IPW-GEE used similar variables for the weight model. For comparison purposes, we also used two MCAR approaches, a t-test, and unweighted GEE. Neither of these estimators corresponds to well-defined de jure or de facto estimands.
Results
Of the 235 participants in the full analysis set, cognition was missing at T2 for 19.0% and 17.6% of the participants in the interventional and control arm, respectively, and 26.8% and 22.4% at T3. No variables were strongly associated with dropout; however, age (ρ=−0.11), baseline-perceived stress (ρ =0.12), and baseline fatigue (ρ=−0.11) had correlation >0.1. Three variables were also associated with self-reported cognition (ρ=0.11, ρ=−0.35, ρ=0.33, respectively) and were included in the MI and weight models for the IPW-GEE. The mean number of training hours for the intervention arm was 25.5, with a range of 0.2–55.8, resulting in 50% of the participants in the intervention arm being classified as adherent to getting at least 20 hrs of training.
Estimates of the difference between arms in self-reported cognition ranged from 10.6 to 19.6, with larger values resulting from the de jure estimands, as shown in Table 2. This, along with the smaller values from the de facto MNAR analyses, suggests that people with worse cognition may have been more likely to have missing data or be less adherent. These results also suggest that while many participants were not adherent to the training program, those who were had very good cognitive outcomes. The sensitivity control-based imputation estimate (MNAR-MI1) was the lowest, and may be a reasonable lower bound for the true de facto effect.
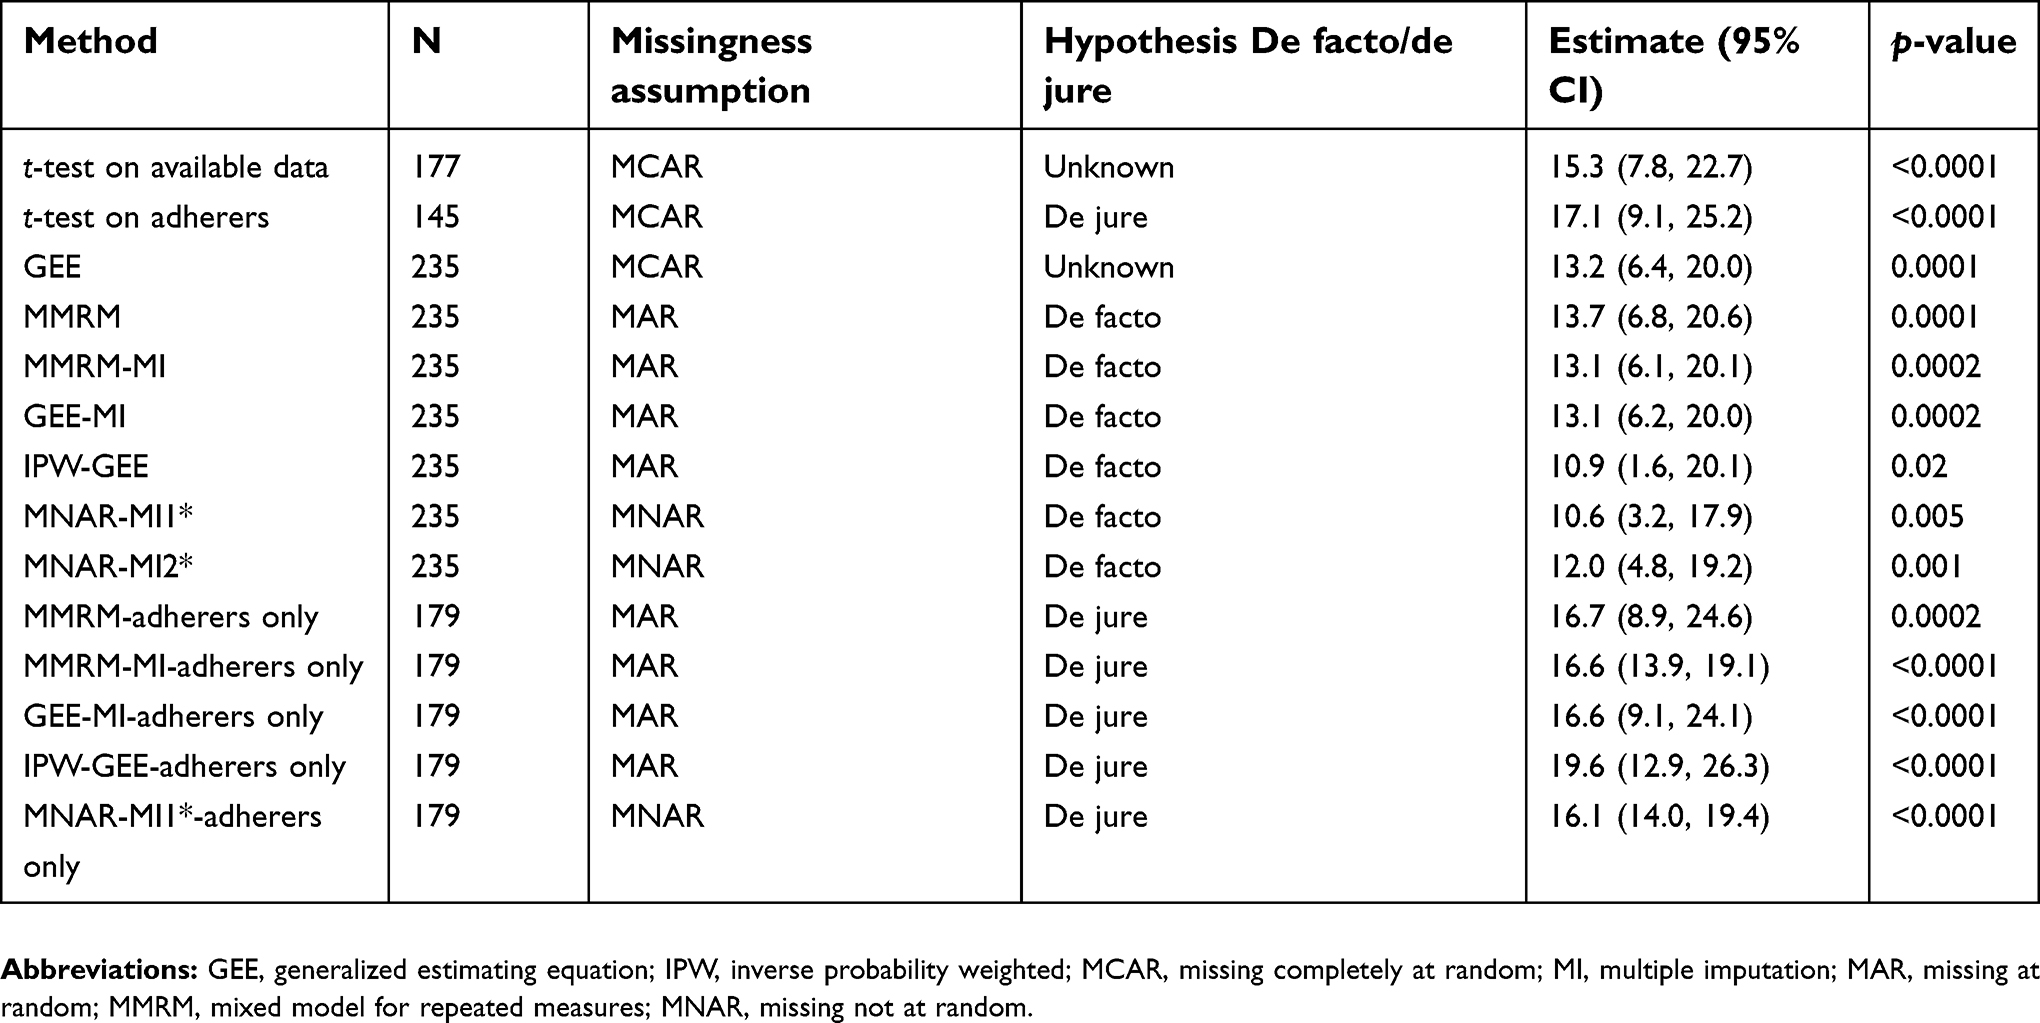 | Table 2 De jure and de facto estimands |
Discussion
We have given an overview of statistical approaches for handling missing PRO data and have introduced the concept of estimands in the PRO context. The handling of missing data and, more generally, protocol deviations should be part of defining the estimand, along with careful consideration of the research question, what is being estimated, and on whom.
We demonstrated several analyses on an example dataset and showed that the results can change based on the assumptions made in the analysis. All estimates, both de facto and de jure, were highly statistically significant, lending confidence that the intervention was effective. In this demonstration, the de facto analysis was considered primary, but this will not always be the case; we stress that there is no universal approach to defining appropriate estimands or analysis. Furthermore, we undertook several analyses. In the primary reporting of a trial, one would not use several different analyses but would prespecify primary, secondary, and sensitivity analyses. Because we used a single example for demonstration, we cannot generalize to the results of other RCTs. In our example dataset, all analyses showed statistically significant differences between intervention arms. In an example given by Bell et al, however, MCAR analyses yielded small, nonsignificant differences, whereas analyses with MAR and MNAR assumptions had larger statistically significant estimates.10
We have advocated for model-based methods and careful definitions of estimands in order to handle missing data in a statistically principled and rigorous way. Each of these methods, however, can be used incorrectly. Model assumptions must be checked and the analyst must take care that models are not misspecified.
The de-emphasis on ITT analysis in favor of estimands may be trading one set of problems for another. The inconsistency of the definition and usage of ITT points toward a lack of understanding of the concept of ITT. In our view, the concepts around estimands including the subtlety in the language, and the relationship to ITT may result in more confusion than ever. Nevertheless, the language of estimands is now in use in some settings, particularly in the pharmaceutical industry and biopharmaceutical statistical literature, and PRO researchers may need some familiarity with the terminology. Despite what analyses and analysis sets are called, we endorse the idea behind estimands. Trialists should consider the trial objectives and carefully define their analyses, analysis set(s), and how missing data and postrandomization events will be handled. Part of this procedure is to be explicit about assumptions and to assess how results change when assumptions are changed, ie, to perform sensitivity analyses that are plausible, statistically principled, and consistent with the primary estimand.
Conclusion
Missing data must be considered at each step of the study: in the funding application, design, conduct, analysis, and reporting. Prevention of missing data is paramount and possible with good design and study procedures. In addition to carefully thought-out primary analyses that align the estimands with the objectives, well-considered sensitivity analyses with explicit, accessible assumptions are essential for confidence in results. As stated in the ICH-E9-R1: “The construction of the estimand(s) in any given clinical trial is a multi-disciplinary undertaking including clinicians, statisticians and other disciplines involved in clinical trial design and conduct.”
Abbreviation list
ICH, International Conference on Harmonisation; ITT, intention to treat; IPW, inverse probability weighting; GEE, generalized estimating equation; LOCF, last observation carried forward; MI, multiple imputation; MCAR, missing complete at random; MAR, missing at random; MNAR, missing not at random; MMRM mixed model for repeated measures; PP, per protocol; RCT, randomized controlled trial.
Ethics approval and informed consent
The original study received ethical approval, and all participants consented to participate.
Availability of data and materials
These data are proprietary and are unable to be shared.
Acknowledgments
The original study was supported by the Cancer Council New South Wales and The Friends of the Mater Foundation grants.
Disclosure
Dr Vardy is supported by the National Breast Cancer Foundation, Australia. Dr Bell is supported by the University of Arizona Cancer Center, through NCI grant P30CA023074. Dr Dhillon reports grants from Cancer Council NSW, during the conduct of the study; received honoraria from MSD, outside the submitted work. The authors report no other conflicts of interest in this work.
References
1. Food and Drug Administration. Guidance for industry on patient reported outcome measures: use in medical product development to support labeling claims. Fed Regist. 2009;74:65132–65133.
2. Avorn J, Kesselheim AS. The 21st Century Cures Act–will it take us back in time? N Engl J Med. 2015;372(26):2473–2475. doi:10.1056/NEJMp1506964
3. Chan EK, Jamieson C, Metin H, Hudgens S. Missing data in patient-reported outcomes: regulatory, statistical, and operational perspectives. Value Health. 2018;21:S227. doi:10.1016/j.jval.2018.04.1539
4. Bell ML, Fiero M, Horton NJ, Hsu CH. Handling missing data in RCTs; a review of the top medical journals. BMC Med Res Methodol. 2014;14(1):118. doi:10.1186/1471-2288-14-118
5. Fiero MH, Huang S, Oren E, Bell ML. Statistical analysis and handling of missing data in cluster randomized trials: a systematic review. Trials. 2016;17(1):1–10. doi:10.1186/s13063-015-1128-9
6. Rabe BA, Day S, Fiero MH, Bell ML. Missing data handling in non-inferiority and equivalence trials: a systematic review. Pharm Stat. 2018. doi:10.1002/pst.1867
7.
8. Rubin DB. Inference and missing data. Biometrika. 1976;63:581–592.
9. Mallinckrodt C, Lipkovich I. Analyzing Longitudinal Clinical Trial Data: A Practical Guide. Boca Raton, FL: Chapman and Hall/CRC; 2016.
10. Bell ML, Fairclough DL. Practical and statistical issues in missing data for longitudinal patient-reported outcomes. Stat Methods Med Res. 2014;23(5):440–459. doi:10.1177/0962280213476378
11. Kenward MG, Molenberghs G. Last observation carried forward: a crystal ball? J Biopharm Stat. 2009;19:872–888. doi:10.1080/10543400903105406
12. Little RJ, D’Agostino R, Cohen ML, et al. The prevention and treatment of missing data in clinical trials. N Engl J Med. 2012;367(14):1355–1360. doi:10.1056/NEJMsr1203730
13. LaVange LM, Permutt T. A regulatory perspective on missing data in the aftermath of the NRC report. Stat Med. 2015:2853–2864.
14. Little RJ, Cohen ML, Dickersin K, et al. The design and conduct of clinical trials to limit missing data. Stat Med. 2012;31(28):3433–3443. doi:10.1002/sim.5519
15. Mallinckrodt CH, Lin Q, Lipkovich I, Molenberghs G. A structured approach to choosing estimands and estimators in longitudinal clinical trials. Pharm Stat. 2012;11(6):456–461. doi:10.1002/pst.1536
16. Permutt T. Sensitivity analysis for missing data in regulatory submissions. Stat Med. 2015;35(17):2876–2879. doi:10.1002/sim.6753
17. Carpenter J, Roger J, Kenward M. Analysis of longitudinal trials with protocol deviations: a framework for relevant, accessible assumptions and inference via multiple imputation. J Biopharm Stat. 2013;23(6):1352–1371. doi:10.1080/10543406.2013.834911
18.
19. Alshurafa M, Briel M, Akl EA, et al. Inconsistent definitions for intention-to-treat in relation to missing outcome data: systematic review of the methods literature. PLoS One. 2012;7(11):e49163. doi:10.1371/journal.pone.0049163
20. Hernan MA, Robins JM. Per-protocol analyses of pragmatic trials. N Engl J Med. 2017;377(14):1391–1398. doi:10.1056/NEJMsm1605385
21. White IR, Carpenter J, Horton NJ. Including all individuals is not enough: lessons for intention-to-treat analysis. Clin Trials. 2012;9:396–407. doi:10.1177/1740774512450098
22. Dhillon HM, van der Ploeg HP, Bell ML, Boyer M, Clarke S, Vardy J. The impact of physical activity on fatigue and quality of life in lung cancer patients: a randomised controlled trial protocol. BMC Cancer. 2012;12(1):572. doi:10.1186/1471-2407-12-572
23. Butow PN, Bell ML, Smith AB, et al. Conquer fear: protocol of a randomised controlled trial of a psychological intervention to reduce fear of cancer recurrence. BMC Cancer. 2013;13(1):201. doi:10.1186/1471-2407-13-201
24. Mallinckrodt C, Molenberghs G, Rathmann S. Choosing estimands in clinical trials with missing data. Pharm Stat. 2017;16(1):29–36. doi:10.1002/pst.1765
25. Groenwold RHH, Moons KGM, Vandenbroucke JP. Randomized trials with missing outcome data: how to analyze and what to report. CMAJ. 2014;186(15):1153–1157. doi:10.1503/cmaj.131353
26. Bell ML, Horton NJ, Dhillon HM, Bray VJ, Vardy J. Using generalized estimating equations and extensions in randomized trials with missing longitudinal patient reported outcome data. Psychooncology. 2018;27(9):2125–2131. doi:10.1002/pon.4777
27. Moher D, Hopewell S, Schulz KF, et al. CONSORT 2010 explanation and elaboration: updated guidelines for reporting parallel group randomised trials. BMJ. 2010;340:c869.
28. Carpenter J, Kenward M. Missing Data in Randomised Controlled Trials - a Practical Guide. Vol Publication RM03/JH17/MK. Birmingham: National Institute for Health Research; 2008. Available from:
29. Fairclough DL. Design and Analysis of Quality of Life Studies in Clincial Trials.
30. Bell ML, McKenzie JE. Designing psycho‐oncology randomised trials and cluster randomised trials: variance components and intra‐cluster correlation of commonly used psychosocial measures. Psycho‐Oncol. 2013;22(8):1738–1747. doi:10.1002/pon.3205
31. Mallinckrodt CH, Lane PW, Schnell D, Peng Y, Mancuso JP. Recommendations for the primary analysis of continuous endpoints in longitudinal clinical trials. Drug Inf J. 2008;42(4):303–319. doi:10.1177/009286150804200402
32. Fitzmaurice GM, Laird NM, Ware JH. Applied Longitudinal Analysis.
33. Bell ML, King MT, Fairclough DL. Bias in area under the curve for longitudinal clinical trials with missing patient reported outcome data summary measures versus summary statistics. SAGE Open. 2014;4(2):2158244014534858. doi:10.1177/2158244014534858
34. Tilling K, Williamson EJ, Spratt M, Sterne JA, Carpenter JR. Appropriate inclusion of interactions was needed to avoid bias in multiple imputation. J Clin Epidemiol. 2016;80:107–115. doi:10.1016/j.jclinepi.2016.07.004
35. Graham JW, Olchowski AE, Gilreath TD. How many imputations are really needed? Some practical clarifications of multiple imputation theory. Prev Sci. 2007;8(3):206–213. doi:10.1007/s11121-007-0070-9
36. Sullivan TR, White IR, Salter AB, Ryan P, Lee KJ. Should multiple imputation be the method of choice for handling missing data in randomized trials? Stat Methods Med Res. 2018;27(9):2610–2626. doi:10.1177/0962280216683570
37. Rodwell L, Lee KJ, Romaniuk H, Carlin JB. Comparison of methods for imputing limited-range variables: a simulation study. BMC Med Res Methodol. 2014;14:57. doi:10.1186/1471-2288-14-57
38. Azur MJ, Stuart EA, Frangakis C, Leaf PJ. Multiple imputation by chained equations: what is it and how does it work? Int J Methods Psychiatr Res. 2011;20(1):40–49. doi:10.1002/mpr.329
39. Van Buuren S. Multiple imputation of discrete and continuous data by fully conditional specification. Stat Methods Med Res. 2007;16:219–242. doi:10.1177/0962280206074463
40. Van Buuren S. Multiple imputation of multilevel data. In: Handbook of Advanced Multilevel Analysis. 2011:173–196.
41. Carpenter J, Kenward M. Multiple Imputation and Its Application. New York: John Wiley & Sons; 2013.
42. Van Buuren S. Flexible Imputation of Missing Data.
43. Preisser JS, Lohman KK, Rathouz PJ. Performance of weighted estimating equations for longitudinal binary data with drop-outs missing at random. Stat Med. 2002;21(20):3035–3054. doi:10.1002/sim.1241
44. Lin G, Rodriguez RN. Weighted methods for analyzing missing data with the GEE procedure. Paper SAS166-2015. 2015.
45. Hedeker D, Mermelstein RJ, Demirtas H. Analysis of binary outcomes with missing data: missing= smoking, last observation carried forward, and a little multiple imputation. Addiction. 2007;102(10):1564–1573. doi:10.1111/j.1360-0443.2007.01946.x
46. Nelson DB, Partin MR, Fu SS, Joseph AM, An LC. Why assigning ongoing tobacco use is not necessarily a conservative approach to handling missing tobacco cessation outcomes. Nicotine Tob Res. 2009;11(1):77–83. doi:10.1093/ntr/ntn013
47. Freemantle N, Calvert M, Wood J, Eastaugh J, Griffin C. Composite outcomes in randomized trials: greater precision but with greater uncertainty? JAMA. 2003;289(19):2554–2559. doi:10.1001/jama.289.19.2554
48. Bell ML, Dhillon HM, Bray VJ, Vardy JL. Important differences and meaningful changes for the Functional Assessment of Cancer Therapy-Cognitive Function (FACT-Cog). JPRO. 2018;2:48. doi:10.1186/s41687-018-0071-4
49. Mallinckrodt C, Roger J, Chuang-Stein C, et al. Missing data: turning guidance into action. Stat Biopharm Res. 2013;5(4):369–382. doi:10.1080/19466315.2013.848822
50. Permutt T, Li F. Trimmed means for symptom trials with dropouts. Pharm Stat. 2017;16(1):20–28. doi:10.1002/pst.1768
51. Ayele BT, Lipkovich I, Molenberghs G, Mallinckrodt CH. A multiple-imputation-based approach to sensitivity analyses and effectiveness assessments in longitudinal clinical trials. J Biopharm Stat. 2014;24(2):211–228. doi:10.1080/10543406.2013.859148
52. Liu GF, Pang L. On analysis of longitudinal clinical trials with missing data using reference-based imputation. J Biopharm Stat. 2016;26(5):924–936. doi:10.1080/10543406.2015.1094810
53. Yuan Y. Sensitivity Analysis in Multiple Imputation for Missing Data. Cary, NC: SAS Intitute Inc; 2014.
54. Leacy FP, Floyd S, Yates TA, White IR. Analyses of sensitivity to the missing-at-random assumption using multiple imputation with delta adjustment: application to a tuberculosis/HIV prevalence survey with incomplete HIV-status data. Am J Epidemiol. 2017;185(4):304–315. doi:10.1093/aje/kww107
55. Tompsett DM, Leacy F, Moreno-Betancur M, Heron J, White IR. On the use of the not-at-random fully conditional specification (NARFCS) procedure in practice. Stat Med. 2018;37(15):2338–2353. doi:10.1002/sim.7643
56. Bray VJ, Dhillon HM, Bell ML, et al. Evaluation of a web-based cognitive rehabilitation program in cancer survivors reporting cognitive symptoms after chemotherapy. J Clin Oncol. 2017;35(2):217–225. doi:10.1200/JCO.2016.67.8201
57. Science P. Brain training that works. Available from:
 © 2019 The Author(s). This work is published and licensed by Dove Medical Press Limited. The
full terms of this license are available at https://www.dovepress.com/terms
and incorporate the Creative Commons Attribution
- Non Commercial (unported, 3.0) License.
By accessing the work you hereby accept the Terms. Non-commercial uses of the work are permitted
without any further permission from Dove Medical Press Limited, provided the work is properly
attributed. For permission for commercial use of this work, please see paragraphs 4.2 and 5 of our Terms.
© 2019 The Author(s). This work is published and licensed by Dove Medical Press Limited. The
full terms of this license are available at https://www.dovepress.com/terms
and incorporate the Creative Commons Attribution
- Non Commercial (unported, 3.0) License.
By accessing the work you hereby accept the Terms. Non-commercial uses of the work are permitted
without any further permission from Dove Medical Press Limited, provided the work is properly
attributed. For permission for commercial use of this work, please see paragraphs 4.2 and 5 of our Terms.