Back to Journals » Clinical Ophthalmology » Volume 16
Analysis of the Reliability and Repeatability of Distance Visual Acuity Measurement with EyeSpy 20/20
Authors Vasudevan B, Baker J, Miller C, Feis A
Received 2 December 2021
Accepted for publication 14 February 2022
Published 8 April 2022 Volume 2022:16 Pages 1099—1108
DOI https://doi.org/10.2147/OPTH.S352164
Checked for plagiarism Yes
Review by Single anonymous peer review
Peer reviewer comments 4
Editor who approved publication: Dr Scott Fraser
Balamurali Vasudevan, Joshua Baker, Caitlin Miller, Alicia Feis
Arizona College of Optometry, Midwestern University, Glendale, AZ, USA
Correspondence: Balamurali Vasudevan, Tel +623-572-3905, Email [email protected]
Background: Visual acuity is a critical component of visual function assessment for all ages. Standardized vision testing protocols may help prevent testing inconsistencies resulting from variations in test administration and interpretation of different examiners. However, most vision assessments outside of research settings, including in doctor’s offices, rarely employ standardized protocols. Validated protocols such as the Early Treatment for Diabetic Retinopathy Study (ETDRS) are frequently employed by vision researchers to ensure accurate and repeatable visual acuity measurements.
Methods: This study evaluates a desktop-based standardized vision testing algorithm (EyeSpy 20/20) specifically designed for use on mobile electronic platforms. Subjects were tested on a desktop version of the EyeSpy software for both the accuracy and duration of measurement of visual acuity and compared to a e-ETDRS chart in a randomized sequence. Children were recruited for this study and tested between two different visual acuity measurement systems. Bland–Altman analysis and correlation tests were done.
Results: Hundred and ten children were recruited for the study. The EyeSpy 20/20 visual acuity testing algorithm as tested with the desktop version was non-inferior to the gold standard e-ETDRS testing algorithm on a desktop platform, but statistically faster to implement when administered on the same electronic testing platform.
Conclusion: EyeSpy 20/20 is a promising tool for vision screening and visual acuity evaluation in children.
Keywords: EyeSpy 20/20, visual acuity, vision screening, smartphone screening, mobile vision
Introduction
Assessment of visual acuity is an important component of any comprehensive eye examination or vision screening. This typically involves a subjective assessment using a standard chart like Snellen, which has been replaced by LogMAR charts in most parts of the world. However, visual acuity screenings at schools, community settings, primary care offices, home testing, and even at eye doctor’s offices may often not be standardized. The examiner administering the used test must decide which optotypes to display and its sequence. Due to variations in the recognition of different optotypes, attention of the subject, or other factors, individuals may misidentify certain optotypes above threshold while correctly identifying only some optotypes at threshold making final visual acuity determination difficult to interpret. This may be of particular concern for visual acuity assessments performed outside of an eye professional’s office. While there are a few apps that fill the space, a recent study that investigated the accuracy of visual acuity by testing apps and assessed their usability for telehealth reported that most of the apps tested had large errors with the optotype and testing distance. Interestingly, none of the apps qualified for telemedicine purposes.1
The limitations of available apps for use in telehealth, and the fact that most vision assessments outside of research protocols are still performed subjectively suggests that there is a need for a new, standardized visual acuity testing app that is reproducible, fast, and easy to use in a variety of different vision testing venues.
Some of the other ideal requirements such an app would need to fulfill include: display presentation to meet the limited screen space available on smart phones, customizable for use at a variety of test distances based on testing requirements, input method such as a touch screen interface to avoid the need for a separate remote device, validated logic protocol to standardize testing, adaptive protocol which responds to subject’s actual responses to ensure adherence to the validated protocol and mimic a skilled professional’s testing paradigm regardless of user experience, automated data recording, automated results with result interpretation, data retention for monitoring of visual acuity changes over time, precise recording of every presentation point, logMAR reporting for accurate interpolation between lines, Early Treatment of Diabetic Retinopathy Study (ETDRS) or HOTV validated optotypes including crowding bars when not displaying traditional rows of letters, telemedicine compatible, widely available and, affordable, etc.
The Early Treatment of Diabetic Retinopathy (e-ETDRS)4 protocol is a “gold standard” for visual acuity assessment for adults. The ETDRS system of measuring visual acuity, employs Sloan letters, a spacing of 0.1 log unit in optotype size between lines, and proportional spacing between lines. The major advantage using this logMAR chart is that the inverse slope of the psychometric acuity function remains more or less independent of the acuity value.5 An electronic version of ETDRS (e-ETDRS) was released in 2003 that was validated against the wall amounted ETDRS charts in adults6 and children7 between the ages of 7–12 years. M&S Technologies (Park Ridge, IL)8 has a validated visual acuity measurement software suite with e-ETDRS protocol for assessing visual acuity using Windows desktop computers which makes it an ideal benchmark for comparison of the EyeSpy 20/20 protocol.
This study evaluates a standardized vision testing EyeSpy 20/20 (v2.0) desktop software specifically designed for later use on mobile electronic platforms. This desktop application presents 3 optotypes at a time to accommodate smartphone screen size limitations but allows faster testing than evaluating single optotypes one at a time. The aim of the present study was to validate EyeSpy 20/20 (v2.0) algorithm as compared to a “gold standard” E-ETDRS algorithm on the same desktop testing system.
Methods
One hundred and ten children and adolescent subjects were recruited for this cross-sectional study. In addition to these subjects, 10 subjects were recruited to perform a repeatability. Sample size was calculated using G-power statistical software to obtain a power of 0.95, effect size of 0.3 and an alpha error of 0.05. A campus wide email was sent to all the colleges within the university seeking volunteers who would bring their children for the study; however, subjects were primarily recruited during the clinical visits for their regular eye exam at the Midwestern University Eye Institute. This study was conducted between Feb 2020 and March 2021. Enrollment was temporarily paused due to COVID-19 restrictions. Subjects were enrolled in the study if they were between the ages of 6–16 years. An assent from the child and written informed consent from the parent or legal guardian were obtained. Since EyeSpy is designed to be used for screening any child, subjects with ocular abnormalities and/or vision abnormalities were not excluded in the study. The study followed the tenets of the Declaration of Helsinki and was approved by the Midwestern University IRB Office (Glendale, AZ campus). All the subjects who were interested to volunteer and signed the consent form, completed the study. All the data were collected in a single visit.
Distance visual acuity was assessed with the subjects wearing their existing spectacles using two different techniques: e-ETDRS and EyeSpy 20/20. The sequence of test presentation and the choice of eye was randomized. Subjects were given a few minutes break between the two testing techniques. Distance visual acuity measurement with e-ETDRS involved using M&S Technologies Smart System II. Both the charts were presented via a software installed on the same desktop machine, running Windows 7. They were connected to a wall mounted monitor placed at 20ft from the subject via mirror projection. Near testing was performed at 40 cms. Testing distance and calibration was checked with a ruler prior to the start of the study and rechecked periodically to ensure that the charts were essentially set up as per the manufacturer’s recommendation. When testing distance is longer, there is a decreased potential for error in visual acuity measurements from variations in test distance, and when the distance is shorter there is an improved testability for children as reported by the VIP study group.9 In the current study, the testing software was presented on the same desktop monitor as the M&S technologies ETDRS Smart System II to ensure accurate comparison of algorithms at 6 meters. EyeSpy 20/20 software included input such as subject ID and use of spectacles/contact lenses. EyeSpy 20/20 chart as presented on the monitor, displayed 3 letters arranged vertically, one above the other with different logMAR levels of visual acuity. There was an option to present HOTV or Sloan type letters. The optotype size range on EyeSpy 20/20 for this study was 20/100 (largest) to 20/16 (smallest). Subjects would read aloud the letters similar to most visual acuity assessment process using resolution acuity and based on the accuracy of the response, the examiner would type in the response into the software using a keyboard that generates the next column of 3 optotypes stacked vertically (See Figure 1). Crowding bars surround each optotype. To accommodate maximal use of smaller screen sizes on smartphones, the crowding bars are shared between adjacent letters with the shared crowding bar length always matching the larger of the two adjacent letters (See Figure 1) Letters presented decreased progressively in size based on results of previous responses until predicted threshold is determined. At the predicted LogMAR level, the presentations include 3 optotypes of the same logMAR to confirm the end point of the psychophysical testing and a visual acuity was determined (See Table 1). EyeSpy 20/20 protocol assigns a final visual acuity result based on the smallest LogMAR line with 3 out of 5 optotypes correct, considered as the threshold line, and requires confirmation of failure of 3 out of 5 optotypes on the line below the threshold line. When one eye is tested, the software resets automatically for the testing of the other eye and the process repeats. The software documents each logMAR stimulus presented and the response recorded. A timer is used to calculate “time to assess visual acuity” (See Table 1).
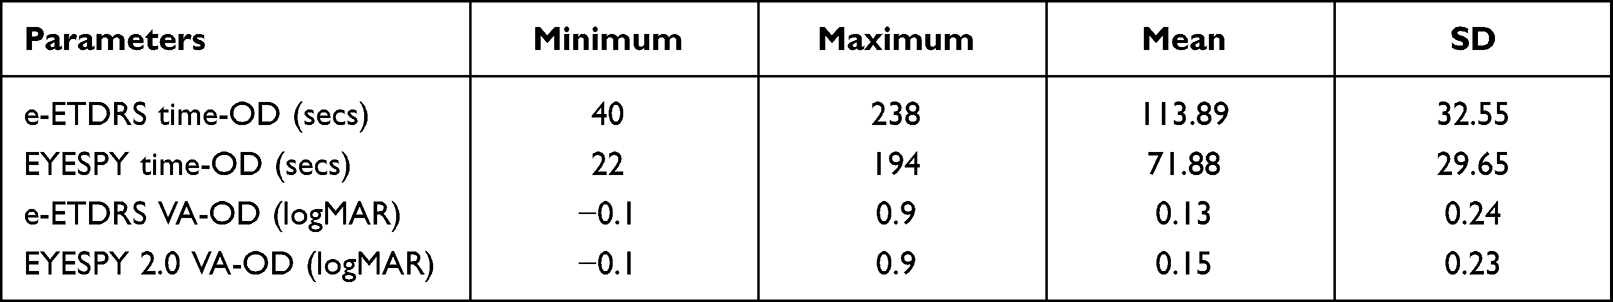 |
Table 1 Summary of the Mean, SD, Minimum and Maximum Values for the Visual Acuity Measurement Techniques and the Time to Measure Them |
 |
Figure 1 (left): Sample display of HOTV optotypes with flanking bars using EyeSpy 20 software, (right): sample display of Sloan optotypes with flanking bars using EyeSpy 20 software (letters are reversed for projection onto the exam lane mirror). |
Monocular measurement of visual acuity with M&S system e-ETDRS involves presentation of one optotype at a time on the same display monitor. Optotype sizes were changed starting from 20/400 to 20/12 when they were successfully resolved, when missed that logMAR level is retested. Visual acuity was tested monocularly for both the charts. The e-ETDRS protocol has been described elsewhere.7 It has been reported to be repeatable with 89% of retest scores were within 0.1 logarithm of the minimal angle of resolution.6
Apart from the distance visual acuity, other subject profile information was also collected. This included age, sex, ethnicity, use of glasses/contact lenses. Near visual acuity was also measured in all the subjects using a standard Sloan near vision chart (Precision Vision) at 40cms (OD, OS, and OU). Near visual acuity was used as a baseline measurement and no further analysis was performed. Repeatability assessment was performed on Eyespy 2.0 with 2 minutes rest interval between the measurements. Testing procedures were similar as described above.
Statistical analysis was performed using SPSS (V25.0; IBM). Paired t-tests were performed to assess for the presence of any clinical significance in the measured logMAR visual acuity between EyeSpy 20/20 and e-ETDRS. In this study, a difference of less than 1 line (0.1logMAR) or less in visual acuity between Eyespy and e-ETDRS is assumed to signify non-inferiority. Pearson correlation analysis was also performed to compare the visual acuity with these 2 charts. A Bland–Altman plot was performed to compare the visual acuity between these 2 techniques and assess the repeatability with Eyespy 2.0.
Results
A total of 110 subjects completed the study between the ages of 6 and 17 years (58 girls and 52 boys) with a mean (SD) of 11.47 (3.22) years.
Figure 2 illustrates the test–retest reliability for Eyespy 20/20. They showed good repeatability. LogMAR values correlated very well upon repeated test completions (r = 0.94, P < 0.001, 95% CI [−0.025, 0.052]). Bland–Altman analysis showed that the logMAR visual acuity were very repeatable, with a mean difference of 0.014. Paired t-test revealed no significant difference between these repeated measurements (p = 0.43).
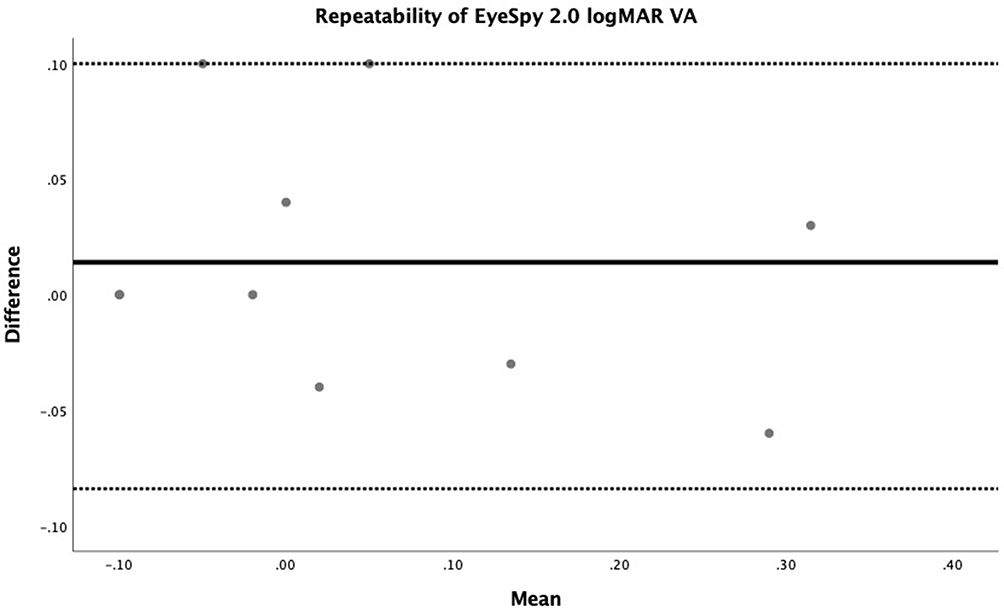 |
Figure 2 Bland–Altman plot demonstrating repeatability of logMAR visual acuity from EyeSpy 20 that shows the mean delta (solid line) and 95% limits of agreement, or ±1.96 × SD (dotted lines). |
Mean (SD) of the visual acuity measured with e-ETDRS in OD was 0.13 (0.24) logMAR. Mean (SD) of the visual acuity measured with EyeSpy 20/20 (2.0) in OD was 0.15 (0.23) logMAR. Only data from the right eye is reported. Difference in the mean (SD) of the visual acuity between e-ETDRS and EyeSpy 20/20 was −0.01 (0.08) and the absolute difference in the mean (SD) was 0.05 (0.06) logMAR. Paired t-tests performed did not reveal any significant difference between the visual acuity in e-ETDRS vs EyeSpy 20/20 (p = 0.91) and an effect size of 0.005 was observed. As expected, Pearson correlation analysis performed between e-ETDRS and EyeSpy 20/20 visual acuity demonstrated a very strong correlation (r = 0.93, p<0.01). See Figure 3. Bland–Altman plot (see Figure 4) demonstrated that 92% of the data were within mean ± 1.96*SD. Mean delta between the techniques is −0.016 with CI [−0.03, −0.00]. Agreement between measures is considered good when the mean difference is close to zero. In the current study, mean delta between the techniques is −0.016. The points on the Bland–Altman plot are scattered above and below zero, so it suggests that there is no consistent bias of one approach versus the other. The difference in logMAR visual acuity between EyeSpy 20/20 and e-ETDRS was very minimal with subjects demonstrating mean (SD) difference of logMAR 0.0 (±0.04 or 2 letters) and an effect size of 0.45. See Figure 5. This device is validated against subjects having a broad range of visual acuity levels between logMAR −0.1 and 0.70. See Figure 6.
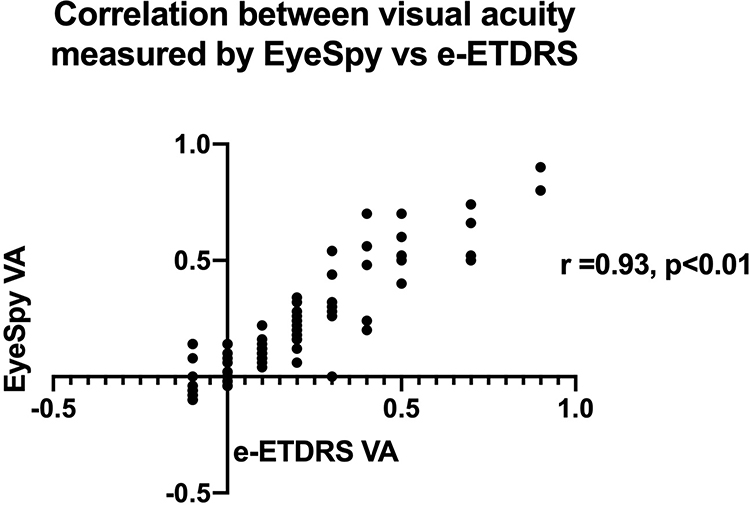 |
Figure 3 Correlation plot between visual acuity measured with EyeSpy 20 and e-ETDRS. |
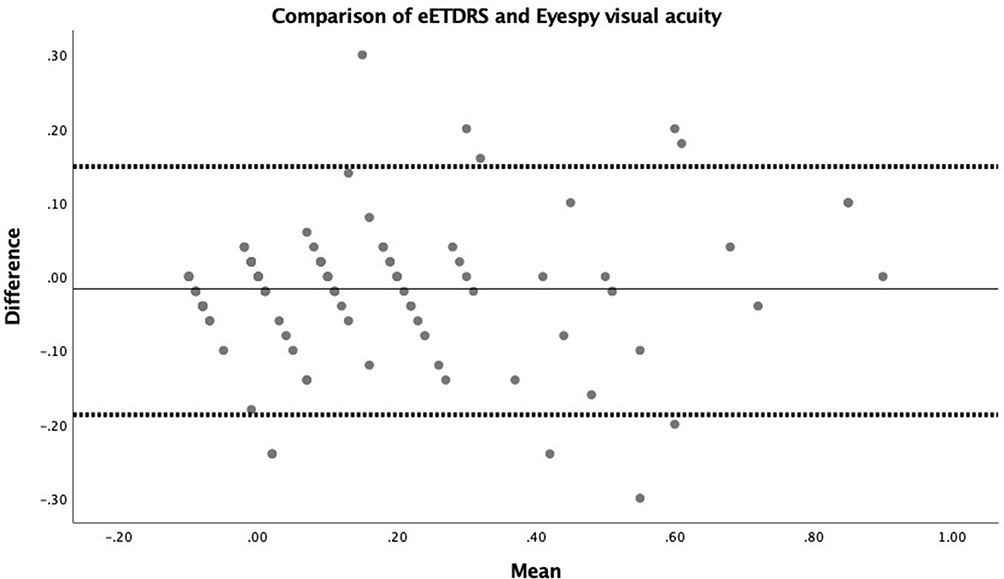 |
Figure 4 Bland–Altman plot comparing visual acuity between EyeSpy 20 and e-ETDRS that shows the mean delta (solid line) and 95% limits of agreement, or ±1.96 × SD (dotted lines). |
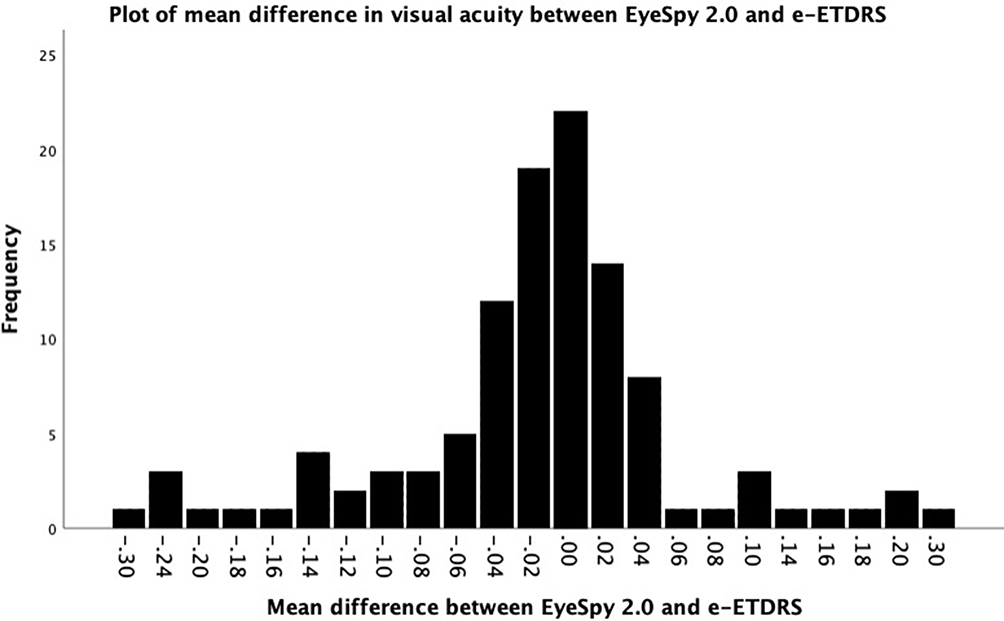 |
Figure 5 Plot of mean difference in logMAR visual acuity between EyeSpy 20 and e-ETDRS demonstrating the highest frequencies within logMAR 0 (±0.04). |
 |
Figure 6 Plot of frequency of EyeSpy visual acuity of the subjects demonstrating varying levels of best corrected visual acuity. |
Mean (SD) of the time to assess visual acuity with e-ETDRS in OD was 113.89 (32.55) seconds. Mean (SD) of the time to assess visual acuity with EyeSpy 20/20 in OD was 71.88 (29.65) seconds. Paired t-tests performed revealed significant difference between the time to assess visual acuity in e-ETDRS vs EyeSpy 20/20 (p<0.01) with 95% CI [35.32, 48.69].
Subjects with visual acuity less than 0.40 logMAR correlated well (r=0.72, p<0.01) between Eyespy and e-ETDRS demonstrating the usability for moderate to poor vision loss (See Figure 7). Bland–Altman analysis (See Figure 8) demonstrated that the mean delta between the techniques is –0.03. The points on the Bland–Altman plot are scattered above and below zero, so it suggests that there is no consistent bias on either techniques with an effect size of 0.25 and 95% CI [0.20, −0.26].
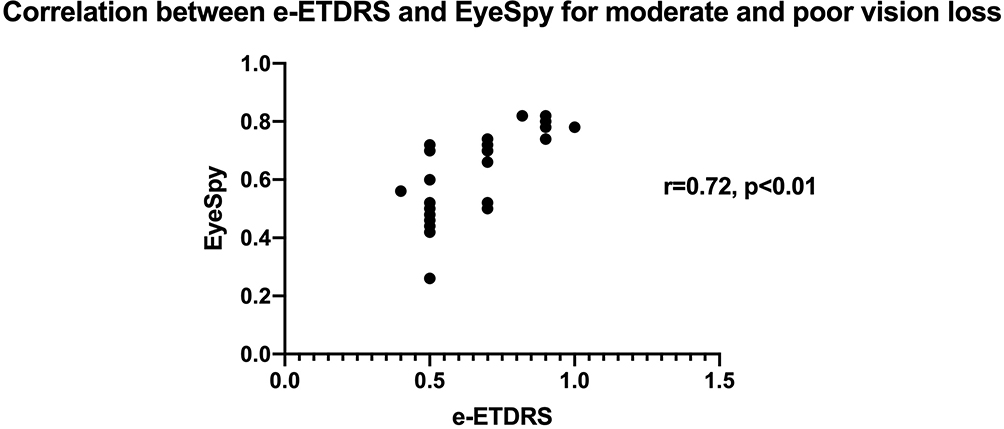 |
Figure 7 Plot of the correlation between e-ETDRS and EyeSpy for moderate and poor loss conditions with best corrected visual acuity. |
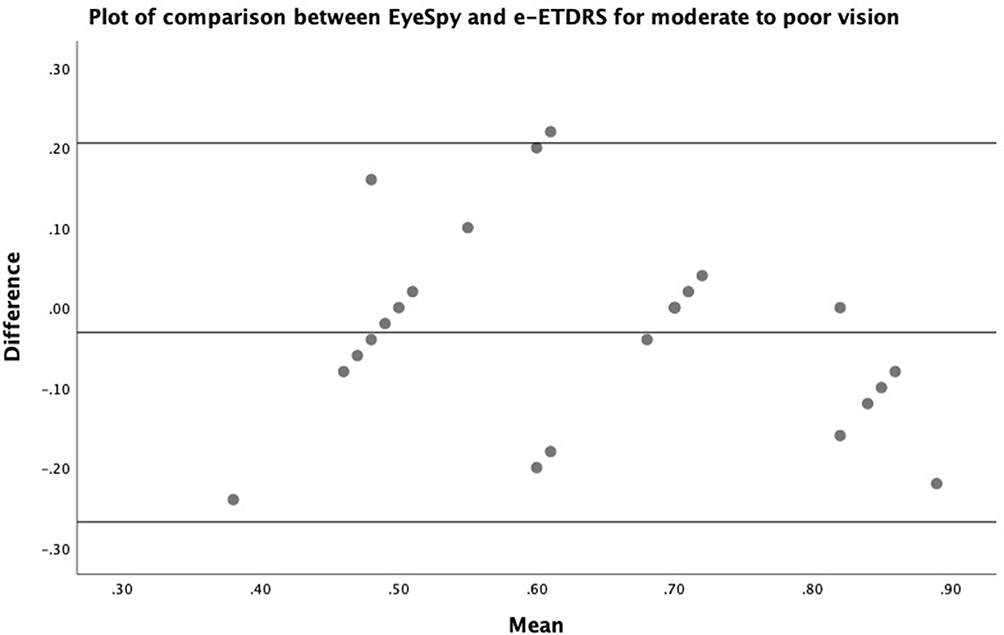 |
Figure 8 Bland–Altman plot comparing the Eyespy and e-ETDRS in subjects with moderate to poor vision. |
Discussion
The main findings in this study demonstrates that the logMAR visual acuity measured with the EyeSpy20/20 (V2.0) desktop software was similar to that of e-ETDRS measured with the M&S desktop system, and the time to measure threshold visual acuity was significantly faster by ~40% on average with EyeSpy 20/20 (v2.0). There was a very small difference between the two measurement systems, that was both statistically insignificant and clinically unimportant.
The accuracy and reliability of visual acuity measurement have been studied and reported extensively,6,10 particularly with regards to the importance of LogMAR chart design such as what ETDRS charts employ. A recent study by Cotter et al6 that assessed the reliability of the eETDRS in children between 7 and 13yrs demonstrated that 89% of retest scores were within 0.1 logMAR and 99% of retests were within 0.2 logMAR. The 95% Limits of agreement (LoA) of the repeatability of the distance visual acuity has been reported to be ±0.07 to ±0.25 logMAR.11 In the present study, the absolute difference between EyeSpy 20/20 and ETDRS was 0.05 (0.06) logMAR demonstrating a lesser variation that that of the repeated measures of eETDRS.6 Visual acuity measurements can vary due to factors like the type of charts, age, optical defocus, and presence of ocular disease.10,11
Numerous studies have demonstrated that visual acuity can be successfully measured on computers and other electronic gadgets, and they can be an accurate replication of standard visual acuity charts when administered properly12 There has been an emergence of smartphone based visual acuity apps that can accurately measure visual acuity with comparison done against a logMAR chart for visual acuity. One such system is called PEEK acuity as developed by Bastawrous group2 and has been validated against ETDRS chart and Snellen acuity chart with good repeatability and accuracy. More recently, another system called DigiVis a smartphone or tablet-based system has been validated with accuracy and repeatability3 as well. The repeatability of visual acuity measurements in the current study are repeatable and similar to that of Bastawrous2 with a test–retest variability using a smartphone at ±0.029 logMAR and that of Thirunavukarasu3 who reported a 95% CI of −0.017 to 0.015 logMAR with a Digivis system. PEEK uses an adaptive algorithm but is limited to tumbling E (which is not the US standard), it is available only on Android platform, and the test distances are not customizable. Digivis requires use of two electronic devices. EyeSpy 20/20 reduces these limitations. Unlike other apps, EyeSpy 20/20 completely tests the full line (all 5 letters) at threshold and the full line (all 5 letters) below threshold to allow interpolation between lines, most apps, are not true LogMAR design, use Snellen or other less accepted optotypes, hence a better understanding of the pros and cons are important to understand. A systematic review of some of these apps have been reported elsewhere by Kawamoto et al)13 and Claessens et al.14
The theoretical advantage of a standardized protocol is that visual acuity results can be obtained consistently by different examiner and be less influenced by subjective interpretation.
Standardized vision assessments are typically used in vision research settings with ETDRS based assessments being a requirement for FDA trials and by far the most commonly used for research.15
A unique feature of EyeSpy 20/20 is that it displays optotypes in a three-letter vertical display format as opposed to horizontal rows of letters used with traditional eye chart designs. The vertical display arrangement is formatted to be compatible with the screen size constraints of smartphones. Based on the findings of the current study, the shorter testing time was achieved without a statistically significant difference in results over a range of different visual acuity levels. Of note, times presented in this study are related to the relative administration times of the EyeSpy 20/20 protocol on a desktop software using the same computer projection system as used for the e-ETDRS protocol administered on the M&S Smart System II.
Rounding errors when scoring by line as opposed to letter counting can be significant. Each adjacent LogMAR line is 0.10 LogMAR apart, or approximately 25% different in size. Since all LogMAR lines on the ETDRS chart contain 5 letters, each additional incorrect or correct letter identified can impact scoring by 0.02 LogMAR. For example, if all 5 letters were correctly identified on the 20/20 line, but only 2 out of 5 letters correctly identified on the 20/16 line, results would be displayed as 20/20+2 (−0.04 LogMAR). In this example, 20/20+2 (−0.04 LogMAR) falls 40% of the way between 20/20 (0.00 LogMAR) and 20/16 (−0.10 LogMAR). These calculations work only when using logMAR design containing an equal number of letters per line. Scoring with visual acuity apps which are not LogMAR design or round to the nearest line may be off by up to 4 letters (20%), or almost one entire line (eg, 20/20-2 will be reported the same as 20/20+2).
Whenever assessing vision, crowding effects of adjacent letters need to be considered. Younger children are more susceptible to the effects of crowding.16 The ability to identify a letter is influenced by how near it is to other letters or may be the edge of the chart17 and inaccurate eye movements may occur when several letters are on the same line.18 Modern letter charts use standardized separation between letters both on a given LogMAR line and between adjacent LogMAR lines. Crowding bars are a validated method for measuring visual acuity with isolated optotypes.17 Typically, crowding bars surround letters which are presented in isolation, or when separated more than one full letter size away from each other to approximate the contour interactions which occur when letters are presented in rows. Measurement of visual acuity with e-ETDRS from M&S displayed one optotype at a time whereas EyeSpy 20/20 displays three optotypes at a time. EyeSpy20/20 utilizes four flanking black bars (See Figure 1), similar to the M&S e-ETDRS desktop testing software. However, to maximize limited screen size available on smartphones, EyeSpy 20/20 shares crowding bars between adjacent vertical letters. Despite its unique three vertically arranged letter display with shared crowding bars in between letters, there was a strong correlation (r = 0.93) between both the e-ETDRS and EyeSpy 20/20 protocols.
When validating different methods of measuring visual acuity, a comparison across different visual acuity thresholds should be performed because there may be more variation in results when testing at poorer levels of visual acuity. In the current study, EyeSpy 20/20 was compared with e-ETDRS with subjects having different vision levels to strengthen the applicability of results.
Testing visual acuity using standardized, validated protocols such as ETDRS is an accepted best practice by vision researchers. Nevertheless, nearly all real-world visual acuity testing is performed subjectively and not standardized. The potential value of a validated, adaptive algorithm designed for mobile devices to facilitate standardized visual acuity testing by non-professionals in real world settings is significant. The current study evaluated the EyeSpy 20/20 algorithm as compared to M&S e-ETDRS on a desktop display device instead of a mobile device and demonstrated that the desktop version as tested is faster and equally reliable like the logMAR chart. Further studies should be performed to evaluate its performance on a portable device when used by non-eyecare professionals outside of the eye exam lane to better understand the full potential utility of the software.
Study limitations: While the study had adequate sample size, only 10 subjects served in the repeatability testing and the visual acuity recorded in these individuals do not span the entire range that the software could serve. Further studies can be performed to expand the range of visual acuity, use of the real Eyespy app instead of a desktop version and also compare Eyespy (2.0) to other existing tools.
Disclosure
The authors report no conflicts of interest in this work.
References
1. Steren BJ, Young B, Chow J. Visual acuity testing for telehealth using mobile applications. JAMA Ophthalmol. 2021;139(3):344–347. doi:10.1001/jamaophthalmol.2020.6177
2. Bastawrous A, Rono HK, Livingstone IA, et al. Development and validation of a smartphone-based visual acuity test (Peek Acuity) for clinical practice and community-based fieldwork. JAMA Ophthalmol. 2015;133(8):930–937. doi:10.1001/jamaophthalmol.2015.1468
3. Thirunavukarasu AJ, Mullinger D, Rufus-Toye RM, Farrell S, Allen LE. Clinical validation of a novel web-application for remote assessment of distance visual acuity. Eye (Lond). 2021;30:1–5. doi:10.1038/s41433-021-01760-2
4. Hazel CA, Elliott DB. The dependency of logMAR visual acuity measurements on chart design and scoring rule. Optom Vis Sci. 2002;79(12):788–792. doi:10.1097/00006324-200212000-00011
5. Horner DG, Paul AD, Katz B, Bedell HE. Variations in the slope of the psychometric acuity function with acuity threshold and scale. Am J Optom Physiol Opt. 1985;62(12):895–900. doi:10.1097/00006324-198512000-00011
6. Cotter SA, Chu RH, Chandler DL, et al. Reliability of the electronic early treatment diabetic retinopathy study testing protocol in children 7 to <13 years old. Am J Ophthalmol. 2003;136(4):655–661. doi:10.1016/s0002-9394(03)00388-x
7. Beck RW, Moke PS, Turpin AH, Ferris FL
8. McClenaghan N, Kimura A, Stark LR. An evaluation of the M&S technologies smart system II for visual acuity measurement in young visually normal adults. Optom Vis Sci. 2007;84(3):218–223. doi:10.1097/OPX.0b013e3180339f30
9. Vision in Preschoolers Study Group. Preschool vision screening tests administered by nurse screeners compared with lay screeners in the vision in preschoolers study. Invest Ophthalmol Vis Sci. 2005;46(8):2639–2648. doi:10.1167/iovs.05-0141
10. Bailey IL, Bullimore MA, Raasch TW, Taylor HR. Clinical grading and the effects of scaling. Invest Ophthalmol Vis Sci. 1991;32(2):422–432.
11. Manny RE, Hussein M, Gwiazda J, Marsh-Tootle W; COMET Study Group. Repeatability of e-ETDRS visual acuity in children. Invest Ophthalmol Vis Sci. 2003;44(8):3294–3300. doi:10.1167/iovs.02-1199
12. Black JM, Jacobs RJ, Phillips G, et al. An assessment of the iPad as a testing platform for distance visual acuity in adults. BMJ Open. 2013;3(6):e002730. doi:10.1136/bmjopen-2013-002730
13. Kawamoto K, Stanojcic N, Li JO, Thomas PBM. Visual acuity apps for rapid integration in teleconsultation services in all resource settings: a review. Asia Pac J Ophthalmol (Phila). 2021;10(4):350–354. doi:10.1097/APO.0000000000000384
14. Claessens JLJ, Geuvers JR, Imhof SM, Wisse RPL. Digital tools for the self-assessment of visual acuity: a systematic review. Ophthalmol Ther. 2021;25:1–16. doi:10.1007/s40123-021-00360-3
15. Kaiser PK. Prospective evaluation of visual acuity assessment: a comparison of Snellen versus ETDRS charts in clinical practice (an aos thesis). Trans Am Ophthalmol Soc. 2009;107:311–324.
16. Norgett Y, Siderov J. Crowding in children’s visual acuity tests–effect of test design and age. Optom Vis Sci. 2011;88(8):920–927. doi:10.1097/OPX.0b013e31821bd2d3
17. Flom MC, Heath GG, Takahashi E. Contour interaction and visual resolution: contralateral effects. Science. 1963;142(3594):979–980. doi:10.1126/science.142.3594.979
18. Flom MC. Contour interaction and the crowding effect. Probl Optom. 1991;3:237–257.
 © 2022 The Author(s). This work is published and licensed by Dove Medical Press Limited. The
full terms of this license are available at https://www.dovepress.com/terms
and incorporate the Creative Commons Attribution
- Non Commercial (unported, 3.0) License.
By accessing the work you hereby accept the Terms. Non-commercial uses of the work are permitted
without any further permission from Dove Medical Press Limited, provided the work is properly
attributed. For permission for commercial use of this work, please see paragraphs 4.2 and 5 of our Terms.
© 2022 The Author(s). This work is published and licensed by Dove Medical Press Limited. The
full terms of this license are available at https://www.dovepress.com/terms
and incorporate the Creative Commons Attribution
- Non Commercial (unported, 3.0) License.
By accessing the work you hereby accept the Terms. Non-commercial uses of the work are permitted
without any further permission from Dove Medical Press Limited, provided the work is properly
attributed. For permission for commercial use of this work, please see paragraphs 4.2 and 5 of our Terms.