")
Back to Journals » Clinical Ophthalmology » Volume 15
Analysis of Socioeconomic Factors Affecting Follow-Up in a Glaucoma Screening Program
Authors Staropoli PC, Lee RK, Kroger ZA, Somohano K , Feldman M, Verriotto JD, Aldahan A, Rosa PR, Feuer WJ, Zheng DD, Lee DJ, Lam BL
Received 3 November 2021
Accepted for publication 16 December 2021
Published 29 December 2021 Volume 2021:15 Pages 4855—4863
DOI https://doi.org/10.2147/OPTH.S346443
Checked for plagiarism Yes
Review by Single anonymous peer review
Peer reviewer comments 3
Editor who approved publication: Dr Scott Fraser
Patrick C Staropoli, 1 Richard K Lee, 1 Zachary A Kroger, 2 Karina Somohano, 3 Matthew Feldman, 4 Jennifer D Verriotto, 1 Adam Aldahan, 5 Potyra R Rosa, 1 William J Feuer, 1 D Diane Zheng, 6 David J Lee, 1, 6 Byron L Lam 1
1Bascom Palmer Eye Institute, University of Miami Miller School of Medicine, Miami, FL, USA; 2Ophthalmology Department, Baylor College of Medicine, Houston, TX, USA; 3Ophthalmology Department, New York Presbyterian Hospital, New York, NY, USA; 4Neurology Department, University of Miami Miller School of Medicine, Miami, FL, USA; 5Dermatology Department, University of Minnesota, Minneapolis, MN, USA; 6Department of Public Health Sciences, University Miami School of Medicine, Miami, FL, USA
Correspondence: Byron L Lam
Bascom Palmer Eye Institute, 900 NW 17 Street, Miami, FL, 33136, USA
Tel +1 305-326-6021
Fax +1 305 326 6114
Email [email protected]
Purpose: To determine what socioeconomic factors affect follow-up in a glaucoma screening program.
Patients and Methods: This was a retrospective cohort study of six health fairs in South Florida from October 2012 to March 2013 among socially and economically disadvantaged populations. Visual acuity (VA), intraocular pressure (IOP), cup-to-disc ratio (CDR), and visual field testing were obtained to identify glaucoma suspects. Glaucoma suspects were defined as having intraocular pressure ≥ 24 mm Hg, cup-to-disc ratio of ≥ 0.6 in either eye, or glaucomatous defects on visual field testing. In July 2015, telephone surveys were administered to assess follow up and socioeconomic factors.
Results: Seventy-two out of 144 (50%) glaucoma suspects responded to the survey and were included in the analysis. Of the 72 respondents, average age was 52.8 years old and 65% were female. The most common race was African American (69%) and ethnicity was Haitian (51%). Glaucoma suspects who followed up were significantly more likely to have health insurance compared to those who did not follow up (74% vs 43%, p = 0.014). No significant difference in follow-up based on age (p = 0.125), education (p = 0.151), gender (p = 0.48), or ethnicity (p = 0.707) was identified. Of the 30 respondents, who did not follow up, the most common reasons were “no insurance” (57%, 17/30) and “not worried” (33%, 10/30).
Conclusion: Insurance was the main socioeconomic factor in determining whether glaucoma suspects followed up after community health screenings. Streamlining social services could increase clinical access of glaucoma suspects.
Keywords: epidemiology, follow-up, glaucoma, socioeconomics
Introduction
Glaucoma is the leading cause of irreversible blindness worldwide.1 Glaucoma is projected to affect 76 million people in 2020 and over 111 million people by 2040.1 Several studies have shown that early intervention can prevent glaucoma progression and blindness.2 However, early glaucoma is frequently asymptomatic, leading to a high prevalence of undetected cases.3 Approximately 2.4 million people in the United States have undiagnosed glaucoma, particularly in minority and elderly populations.3 Risk factors for glaucoma include African American race, advanced age, low socioeconomic status, and positive family history.4
Targeting high risk and underserved populations for glaucoma screening is recommended by the American Academy of Ophthalmology Preferred Practice Pattern Guidelines.5 Medicare & Medicaid fund yearly eye exams in African Americans over 50 years old and Hispanic Americans over 65 years old.6 For people without established physicians, community screenings have shown utility in identifying glaucoma suspects.7–9 However, achieving follow-up in clinic is a significant obstacle that has not been well reviewed.10
This study examines what socioeconomic factors are associated with failure to follow up, after identifying glaucoma suspects at community health screenings in South Florida.
Materials and Methods
This retrospective cohort study was approved by the University of Miami Miller School of Medicine Institutional Review Board (IRB) and was compliant with the Health Insurance Portability and Accountability Act. The described research adhered to the tenets of the Declaration of Helsinki. This study was conducted as part of the Ocular Screening Study in conjunction with the University of Miami Miller School of Medicine’s community health fairs. These free events screen for glaucoma, hypertension, cholesterol, diabetes, and osteoporosis, among other diseases. Data were collected from October 2012 to March 2013 at six different economically and socially disadvantaged locations in South Florida targeting underserved populations including: Little Haiti, South Dade, Upper Keys, Key West, Broward, and Liberty City. Advertisements included flyers, newspaper, and public radio.
All participants gave written informed consent and parents or legal guardians provided informed consent for patients under 18 years of age. Translators were available if necessary. A standardized paper-based questionnaire was administered to determine: age, gender, ethnicity, health insurance status, last eye examination, history of glaucoma and years since diagnosis, family history of glaucoma including which family member(s), history of diabetes and years since diagnosis, insulin dependence, history of hypertension and years since diagnosis, and average blood pressure.
Snellen Visual Acuity (VA) was tested in both eyes with current refractive lenses. If VA was worse than 20/40, participants were tested with pinhole and VA was recorded. Visual field tests were completed on every participant using a Frequency Doubling Technology (FDT) perimeter (Humphrey FDT, Welch Allyn, Skaneateles, NY) in C-20-5 screening mode. Results were interpreted based on the Total Deviation plot by counting the sectors with a probability of 5% or worse, as described by Bokman et al (2014).11 A “normal” test was defined by 0 or 1 missed sectors, a “suspect” test was 2 missed sectors, and an “abnormal” test was 3 or more missed sectors. A visual field was considered unreliable if there was more than 1 out of 3 false positives, or if more than 50% of sectors were abnormal. Unreliable and “abnormal” test results were repeated for confirmation. Intraocular pressure (IOP) was obtained with a Tono-Pen XL (Reichert Technologies, Depew, NY). Central corneal thickness (CCT) was obtained with an ultrasound pachymeter (Pachette 3, DGH Technology, Exton, PA). Medical students were trained in these techniques and worked alongside ophthalmology residents, fellows, and attendings from the Bascom Palmer Eye Institute. Cup-to-disc ratio (CDR) was measured by direct ophthalmoscopy using a Pan-Optic (Welch-Allyn) direct ophthalmoscope through a non-dilated pupil by an ophthalmology resident or fellow.
Glaucoma suspects were defined as having one of the following criteria in at least one eye: IOP greater than or equal to 24 mmHg, a vertical CDR greater than or equal to 0.7, glaucomatous changes of the optic disc (eg, rim thinning, nerve fiber defect), or visual field loss on perimetry as defined above and as previously described by Bokman et al.11 Glaucoma suspects were given a “glaucoma referral” form, a copy of their test results, and contact information with instructions on how to obtain an appointment with local community ophthalmologists. The public municipal Jackson Memorial Hospital or the University of Miami Miller School of Medicine’s Bascom Palmer Eye Institute were given as alternative options if the patient preferred. Other abnormal ocular findings were also reported such as cataracts, macular degeneration, or diabetic retinopathy. Participants with abnormal findings received an “ophthalmic referral” and follow-up information as above. Normal examinees were told to return for routine follow-up and dilated eye examination every 1 to 2 years. All patients were counseled about their diagnosis and the importance of follow-up by a physician.
In 2015, a standardized and scripted telephone survey was administered to participants who attended the community health screenings in 2012 and 2013. The survey questions and administration were adapted from other published glaucoma screening programs in the literature7,12 LexisNexis, an online internet service, was used to identify working numbers when phone numbers previously provided were incorrect or no longer in service. Phone calls were placed between 8am and 8pm. Six phone call attempts were made over a 3-week period. The survey asked for the participant’s age, gender, race, ethnicity, highest level of education, and type of health insurance. Participants were then asked if they followed up with an eye doctor since the screening, the diagnosis they were given (if any), and time since last eye exam. Those who did not follow up were asked why. Choices included: “not worried”, “no time”, “no transportation”, “no insurance”, “trouble communicating with doctor”, and “other,” in which the patient was able to provide an open-ended response. Follow-up data were self-reported and not confirmed by medical record review given that subjects could have followed up with outside providers. If the patient needed to follow up with an eye care provider and had not, information to schedule an appointment was again provided.
Statistical analysis was performed using Statistical Package for the Social Sciences software (SPSS V25.0 Inc, Chicago, Illinois, USA). Student’s 2-sided t-test, exact chi-squared, and Fisher’s exact test were used for statistical comparison. A p-value of <0.05 was considered statistically significant.
Results
Four hundred sixty-six participants were screened at 6 community health fair sites from 2012 to 2013. Out of those participants, 30.3% (146/466) were identified as glaucoma suspects and eligible for the study. Forty-nine percent (72/146) of glaucoma suspects were successfully contacted, and 58% (42/72) of those respondents followed up with an eye care professional.
Table 1 summarizes the demographics of the 466 health fair participants, demonstrating the racial and ethnic diversity across the screening sites. The most common self-identified race/ethnic subgroup was African American in Little Haiti, Broward, and Liberty City, Hispanic in South Dade, and Caucasian in the Upper Keys and Key West. Overall, the average age was 50.5 years old, 16% (74/466) had health insurance, 59.7% (278/466) were female, 34.5% (161/466) were male, and 5.8% (27/466) did not report. Table 2 focuses on the 72 glaucoma suspects who responded to the phone survey. The average age was 51.2 years old, 67% (48/72) were female, and 33% (24/72) were male. The most common self-identified race/ethnicity was Haitian (60%, 43/72) and Black (26%, 19/72). Most respondents had a high school degree or less (57%, 41/72). A majority of respondents at this later time point had health insurance (64%, 46/72), while 36% (26/72) did not. At the time of survey, 44% (32/72) of respondents had seen an eye care provider in the previous year. The sites with the lowest proportions of follow-up were South Dade (25%, 1/4) and Liberty City (40%, 6/15). These sites also had the highest uninsured proportions (75% [3/4] and 47% [7/15], respectively) and youngest patients (44±11 and 49±8 years old, respectively).
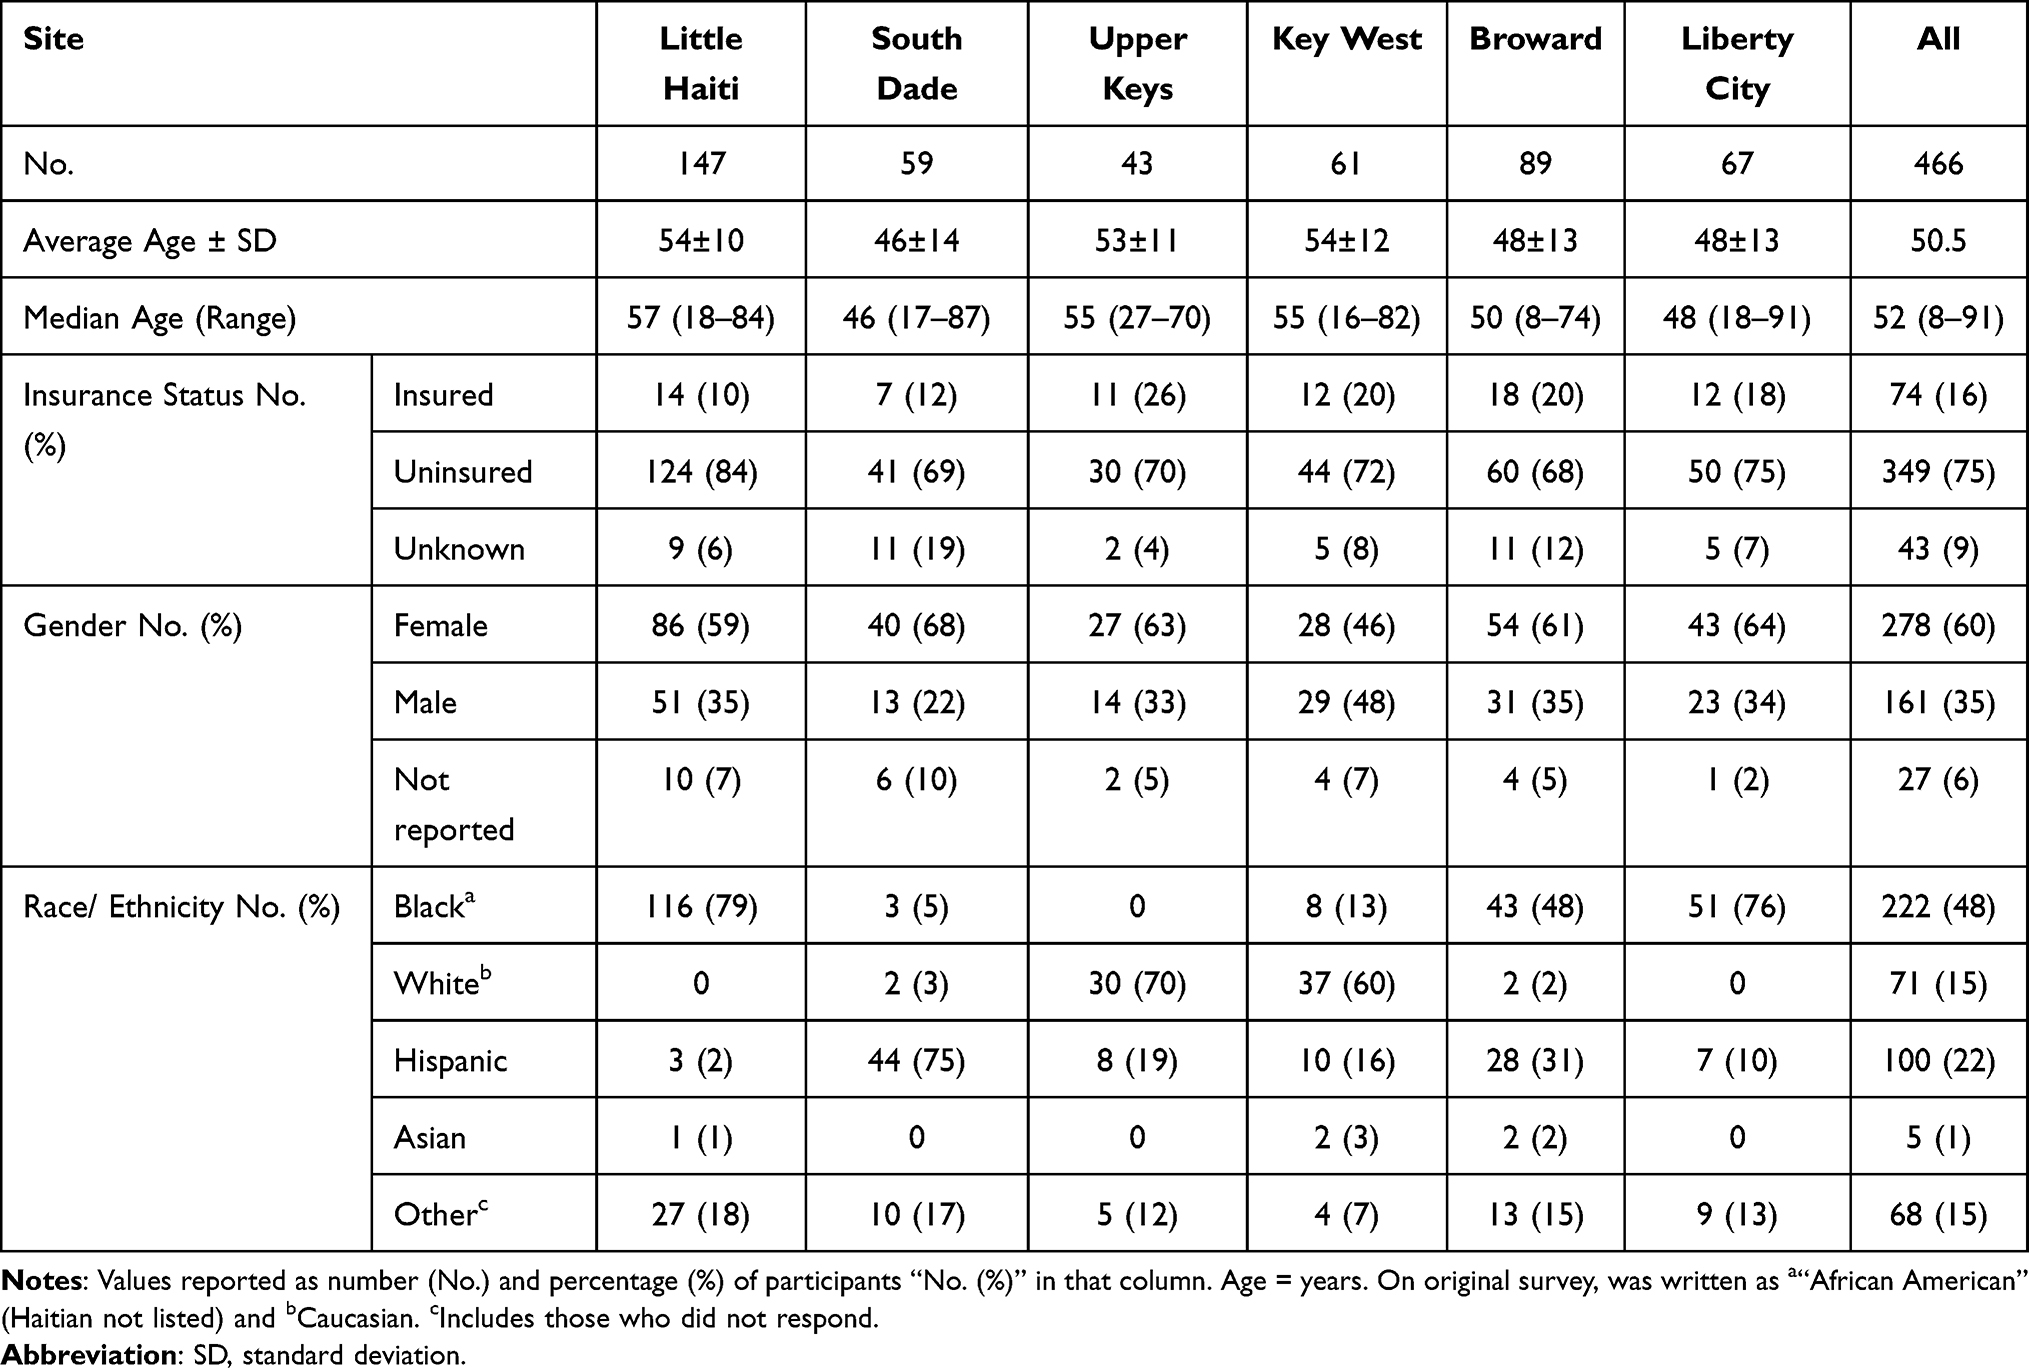 |
Table 1 Demographics of All Screened Patients |
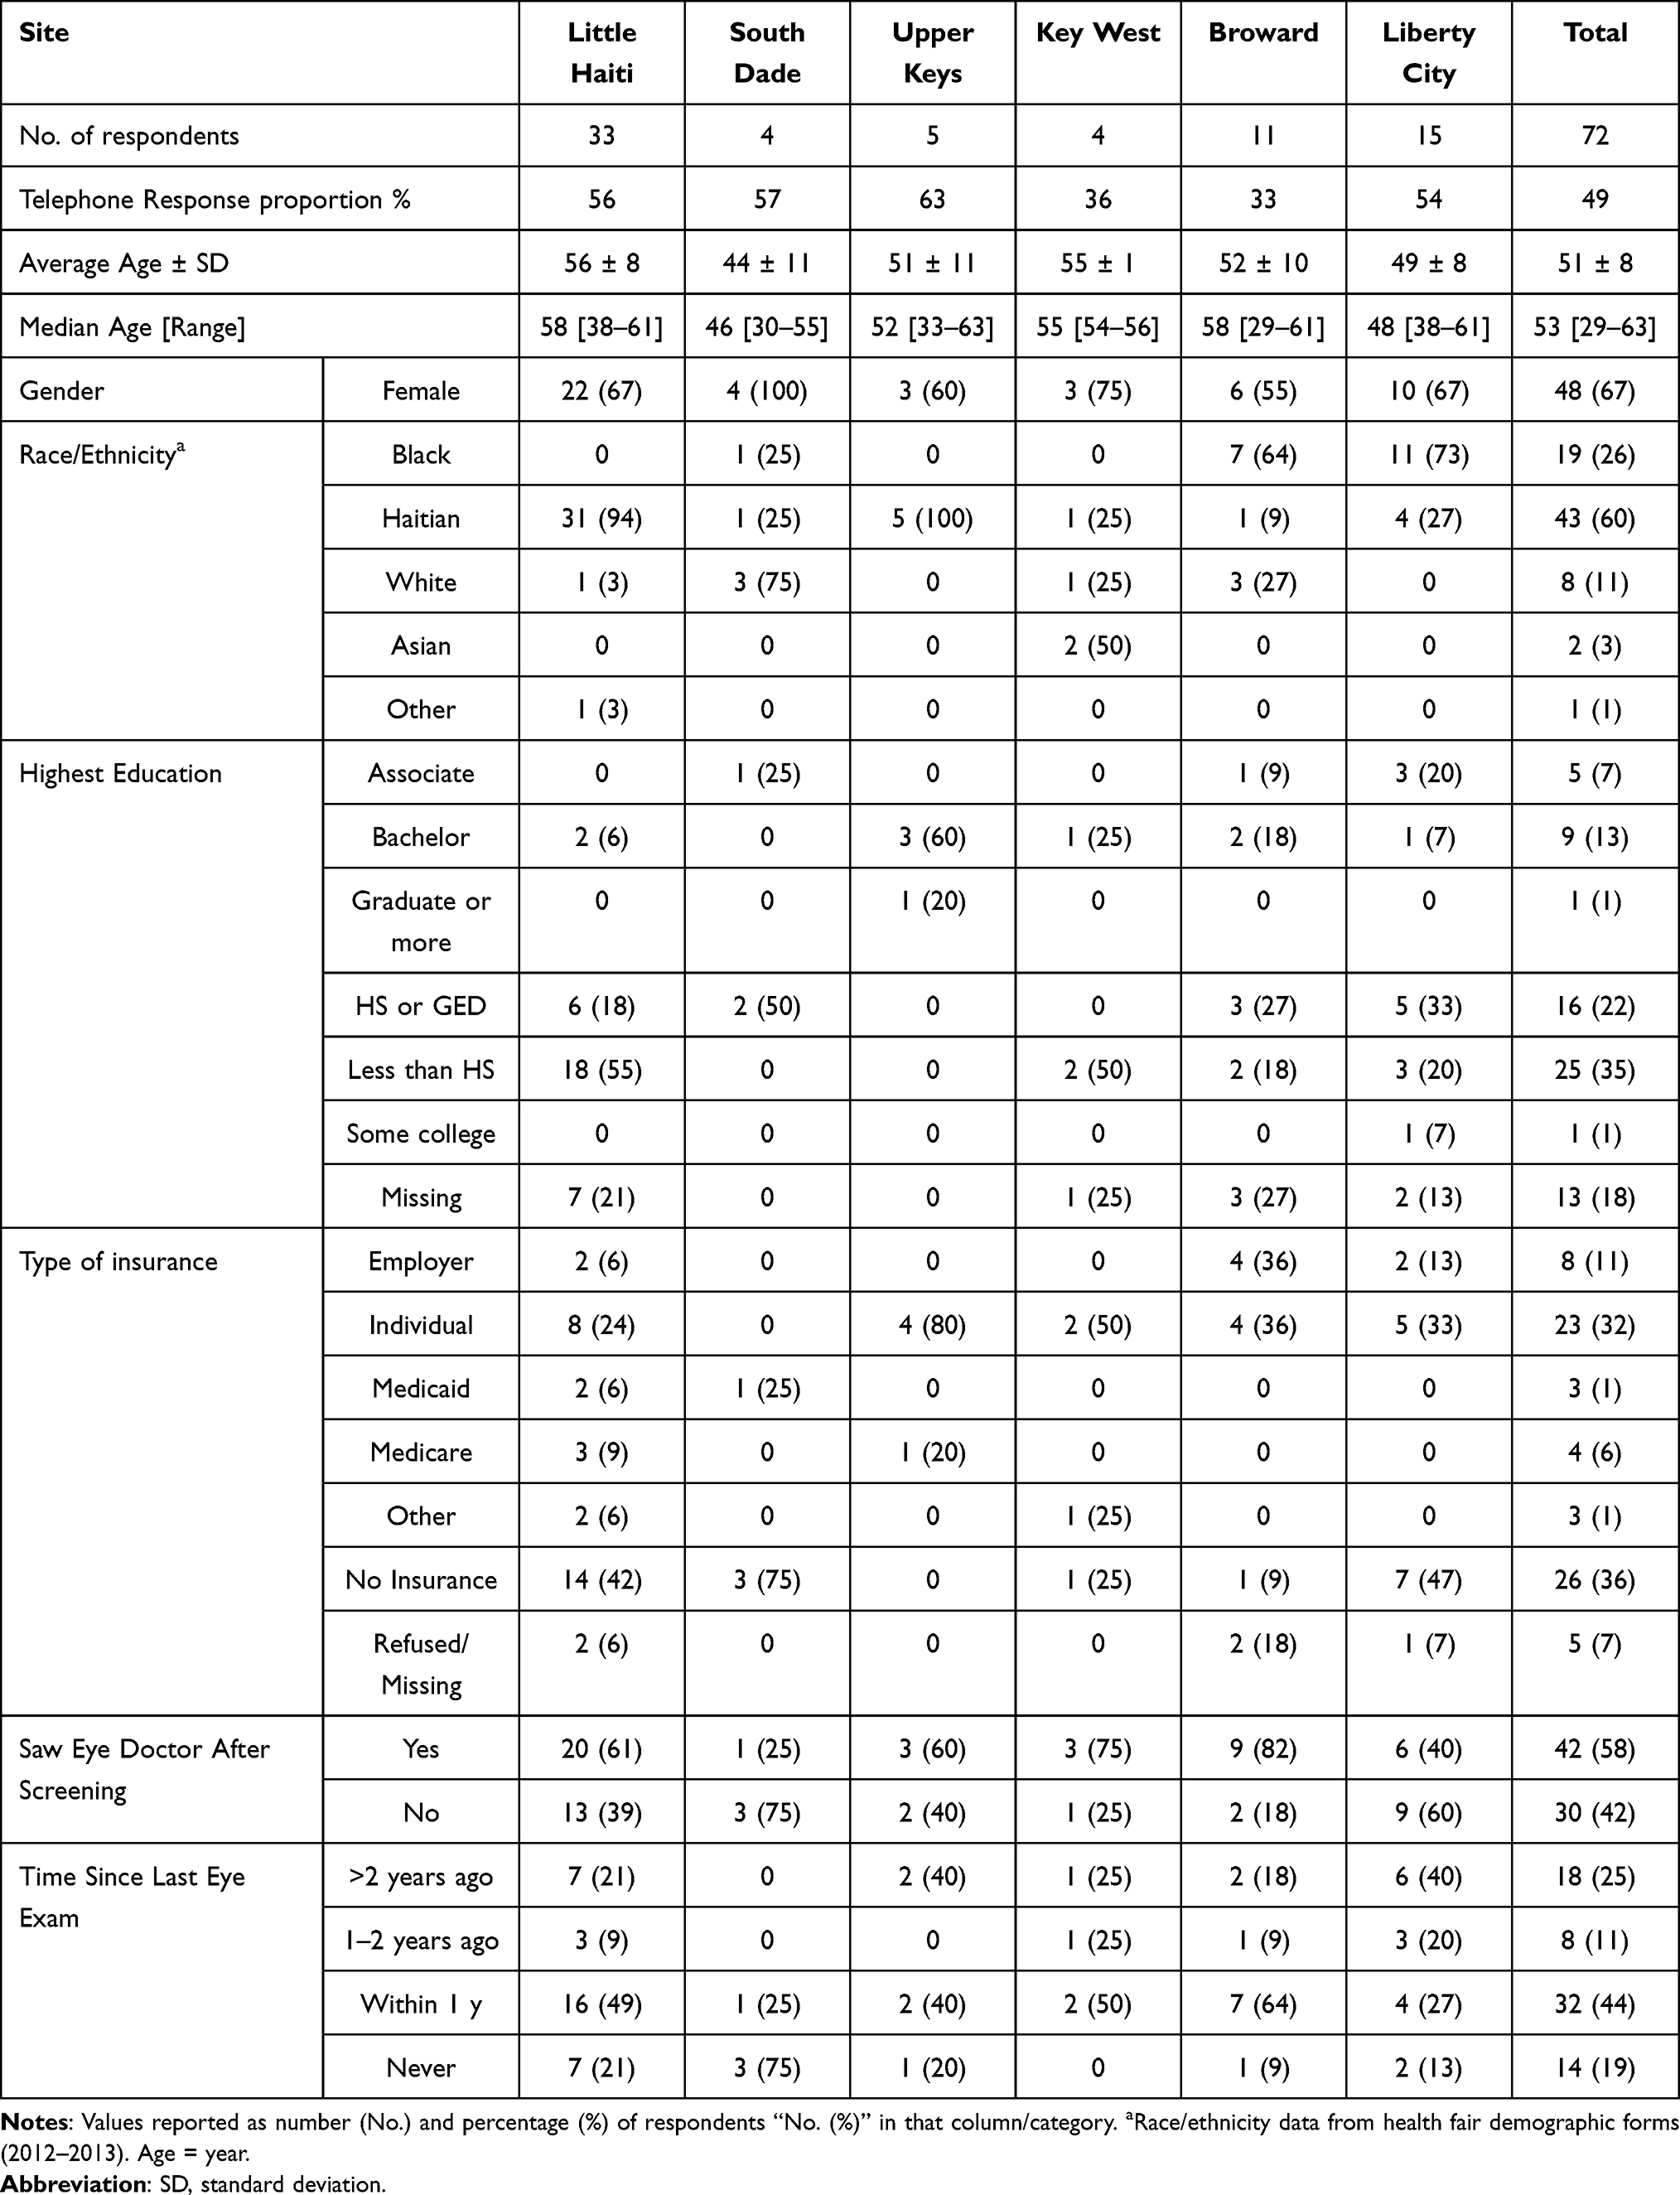 |
Table 2 Demographics of Glaucoma Suspects Who Responded to Phone Survey |
Table 3 outlines the association between socioeconomic factors and clinical follow-up. Overall, 58% (42/72) of respondents followed up with an eye care provider. Respondents who followed up were significantly more likely to have health insurance compared to those who did not follow up (71% insured vs 43% insured, respectively, p = 0.014). No significant difference in follow-up based on education (p = 0.15), gender (p = 0.48), ethnicity (p = 0.71), or screening site (p = 0.23) was identified. These results were confirmed by a forward stepwise logistic regression which showed that lack of a health plan was associated with a 3.5 times higher risk of not following up compared to someone with a health plan (OR = 3.5, p = 0.028). No other variables entered the model (all p > 0.1). The most common reasons given for failure to follow-up were “no insurance” (57%, 17/30) and “not worried” (33%, 10/30), among others (Table 4).
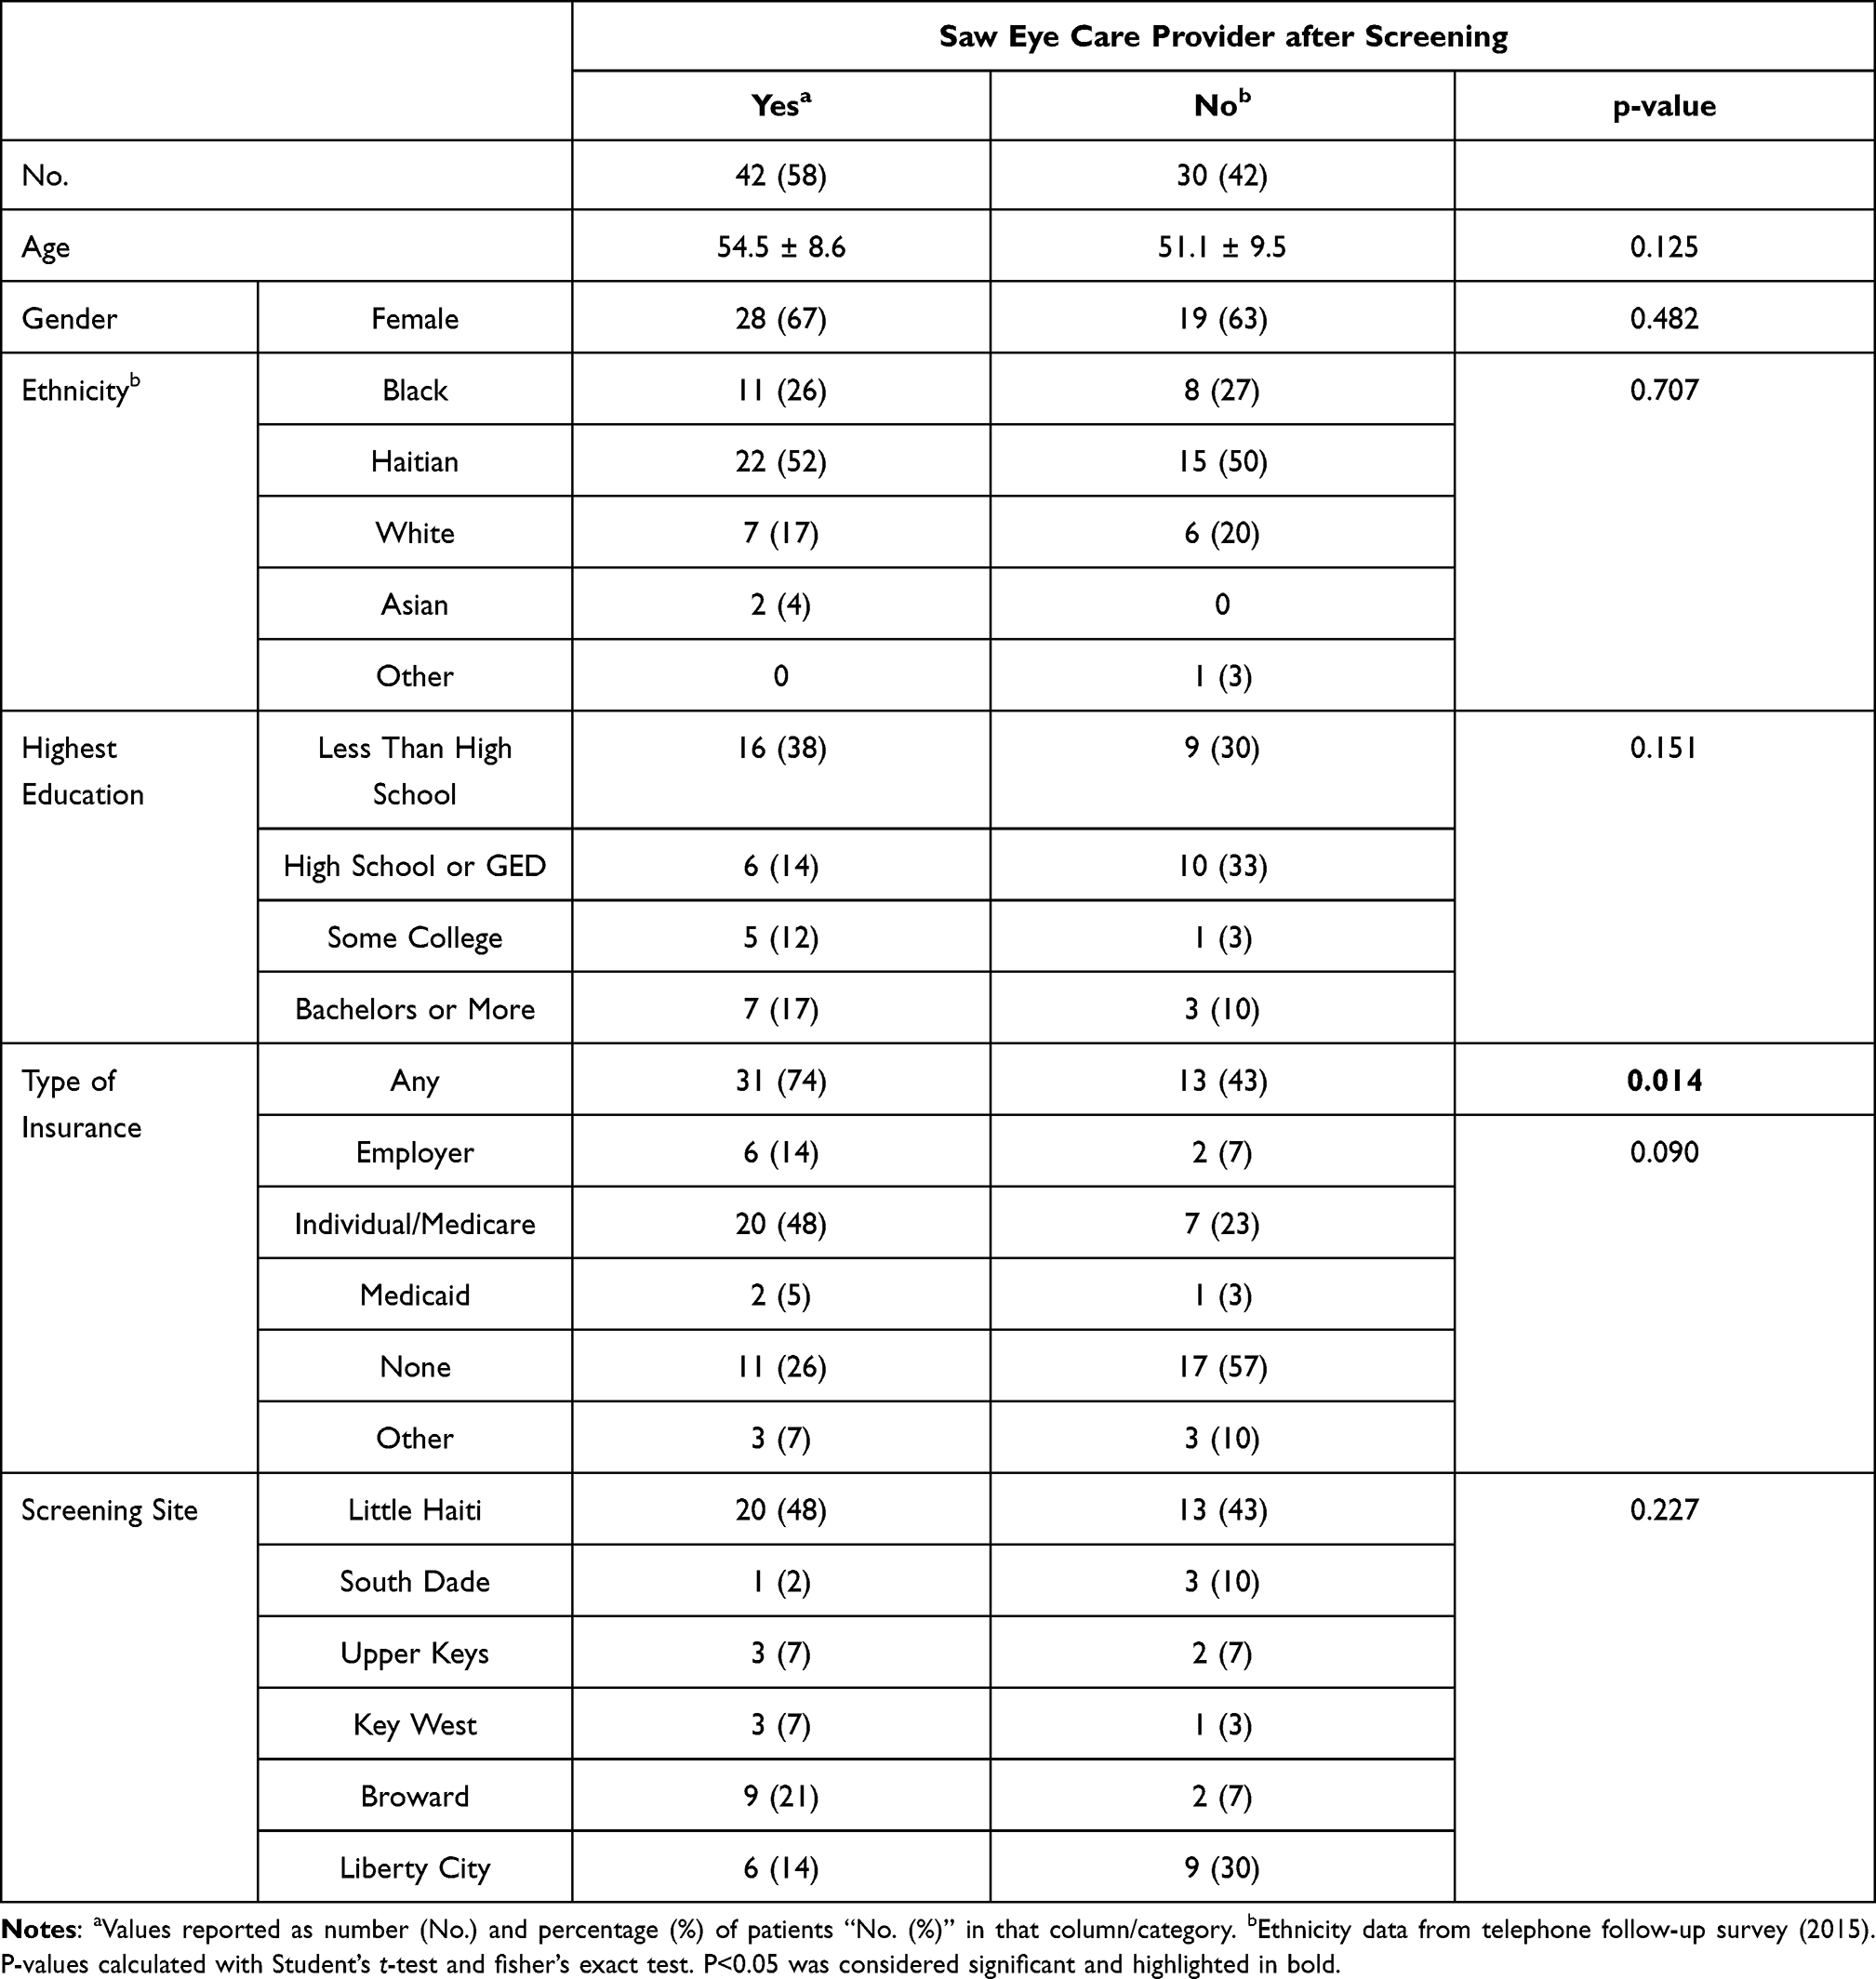 |
Table 3 Association of Socioeconomic Factors with Follow-Up |
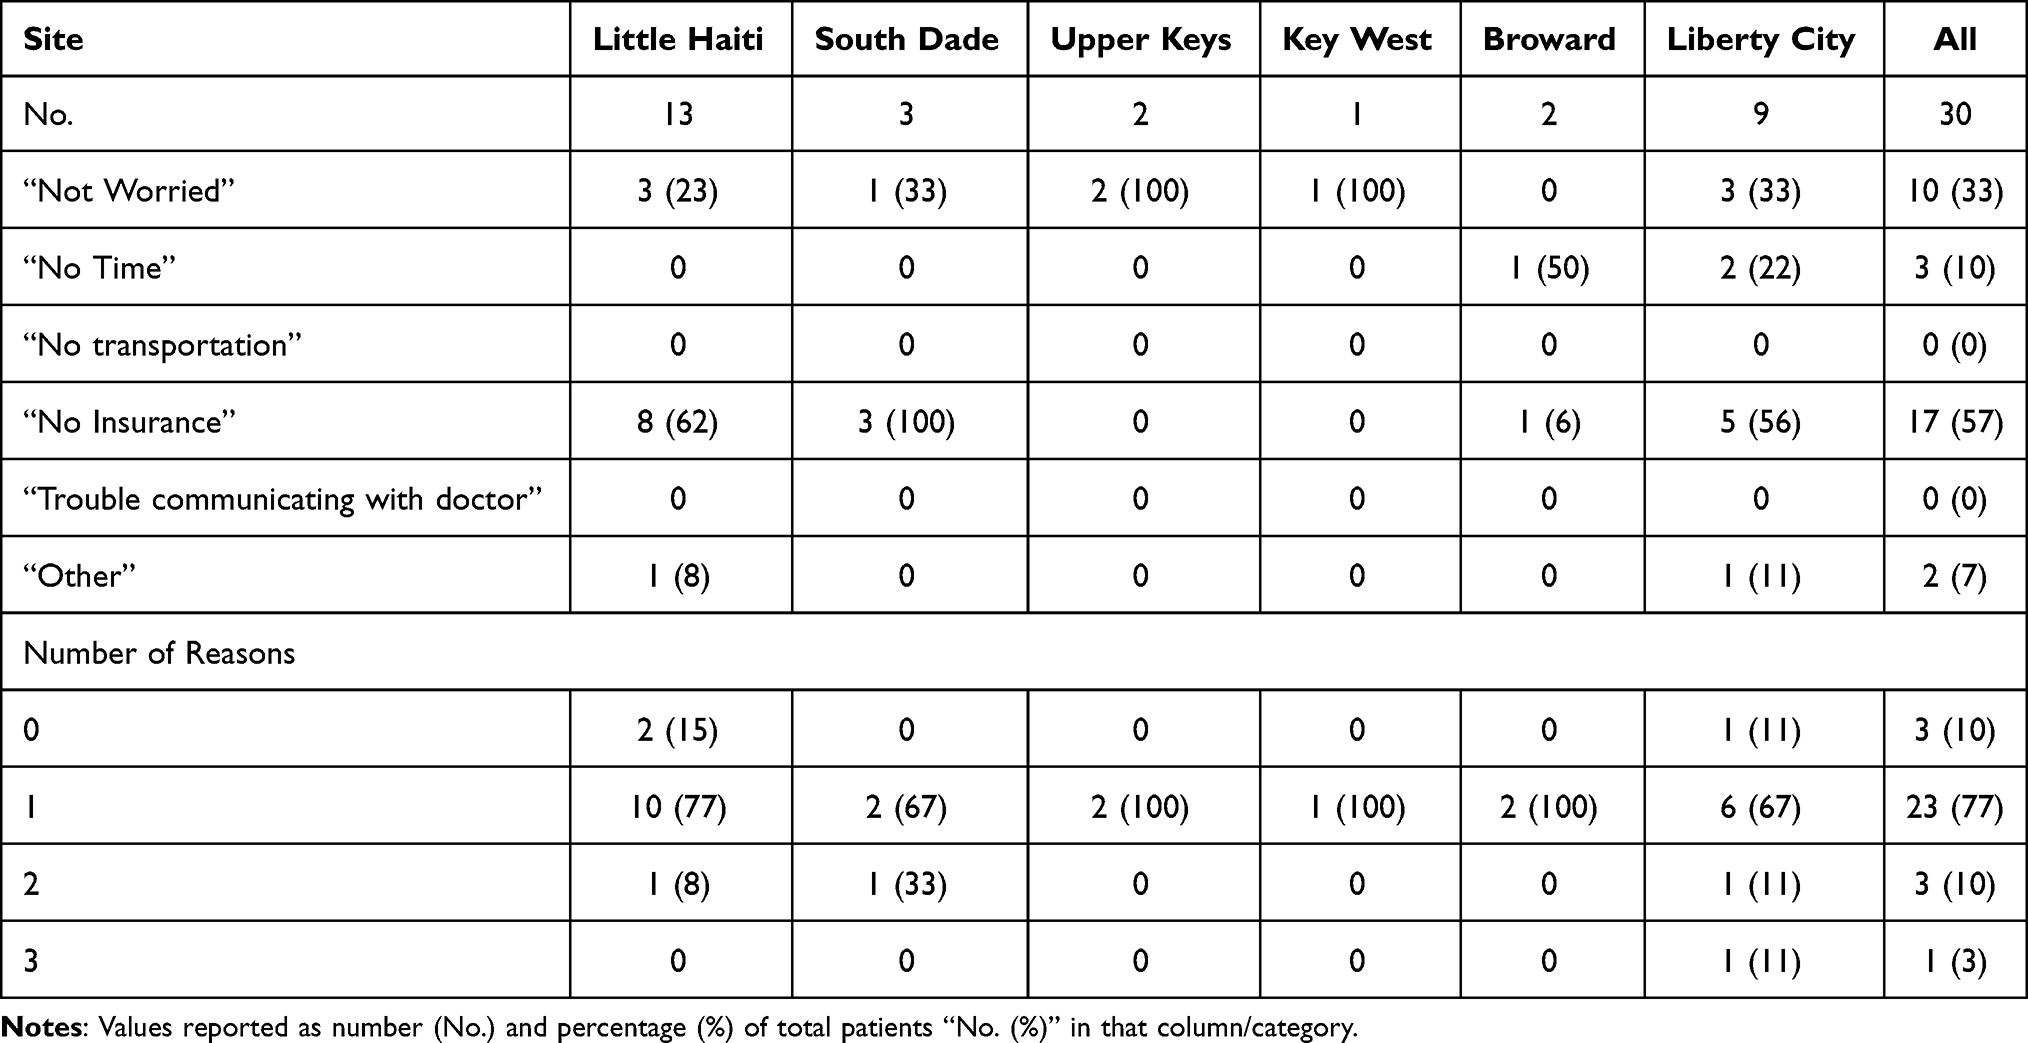 |
Table 4 Reasons for Not Following Up After Screening |
Discussion
The findings of this study are noteworthy because they demonstrate that despite robust and free glaucoma screening, socioeconomic barriers can limit their effectiveness. Our screening program identified 30% of participants as glaucoma suspects, which is similar to other screening programs that target high-risk populations (ie, 39% in Hark et al14). However, health insurance was a significant factor in determining whether these glaucoma suspects followed up in clinic (p = 0.014). Lack of health insurance was also the most commonly cited reason provided by respondents in the telephone interview for not following up. The two screening sites with the lowest follow-up (South Dade and Liberty City) also had glaucoma suspects with the highest uninsured proportion and lowest average age. This is an unfortunate association since younger, higher-risk glaucoma suspects may benefit more from early glaucoma diagnosis and intervention.
The failure to follow-up (FFU) proportion in the current study was 42% (30/72). This is similar to previous studies.12–14 However, a variety of reasons for poor follow-up have been reported by other authors. Transportation is a commonly mentioned issue. Gower et al had a FFU proportion of 52.9% (566/1070) and the leading reason was lack of transportation (36%; 25/70).12 Similarly, the Glaucoma Screening Study in New Haven had a FFU proportion of 31% (84/273) and a significant association was lack of a car (p < 0.01).13 Meanwhile, the Philadelphia Glaucoma Detection and Treatment Project described a FFU proportion of 38.8% (206/531). This program took the unique approach of bringing clinical equipment directly to community sites for follow-up visits, eliminating the need to refer to a third party or academic center.14 In comparison, our program referred to an extensive network of local physicians that would decrease the barrier of transportation and promote culturally competent care between physicians and residents of their community. None of the respondents reported an issue with transportation (n = 0).
Patient education also plays an important role. Studies have shown that screenings conducted by volunteers have relatively higher FFU proportions, possibly due to a lack of initial counseling that could lead to misunderstanding the importance of follow-up.7,15 Altangerel et al surveyed one population of glaucoma screening participants and found that while 91% had insurance and 100% had transportation, only 29% (71/244) provided an accurate definition of glaucoma. They proposed that lack of education may be more important than lack of transportation or insurance in determining follow-up.16 Indeed, community educational workshops about glaucoma have been shown to increase glaucoma evaluation appointments.17 Even though the health fairs in the current study were organized as multidisciplinary screening sites (and were not constructed to be glaucoma educational workshops) direct patient counseling and education about diagnosis and the importance of follow-up was explicitly provided by a physician, and none of the respondents reported an issue communicating with the doctor (n = 0). When presented as an open-ended question, none of the respondents reported lack of trust in their physician as a reason why they did not follow up.
Quigley et al made the argument that there is a trend toward better follow-up if a more serious diagnosis and treatment is given at initial evaluation.7 They showed that among those who returned for a clinic visit, the subsequent FFU proportion over 1 year was 29% (5/17) among those diagnosed with glaucoma, 43% (3/7) among those prescribed eye drops, and 68% (25/37) among those not prescribed eye drops.7 Similarly, Hark et al found that a confirmed diagnosis of glaucoma, increased IOP, and recommendation for glaucoma medication or laser peripheral iridotomy were associated with adherence to follow up.14 Our program straddled this line, having physicians on-site to screen and counsel patients, although definitive diagnosis was deferred until examination in clinic.
Previous research has shown a higher utilization of ophthalmic care in those older than 65, female sex, white race, those with at least a high school degree, and being in the United States for at least 15 years.18,19 Lower utilization of ophthalmic care has been associated with men, lower education, and lack of visual impairment.19,20 In terms of follow-up specifically after glaucoma screening, male sex, white race, and older age have been associated with adherence to follow up,14 while living alone (p = 0.008) and smoking (p = 0.0005) were associated with noncompliance.13 Contrary to these previous studies, we did not find an association between race, gender, or age as factors influencing follow-up proportions. There was also no difference in follow-up between screening sites despite the different socioeconomic compositions of the subpopulations.
Our results reaffirm previous studies that demonstrated an association between follow-up and insurance status. Lee et al found significantly higher eye care utilization among insured compared to uninsured patients at all levels of visual impairment (ie, none, moderate, high).20 Li et al reported that those with vision insurance were significantly more likely to have eye care visits, recognize friends across the street, and read printed material.21 Lack of insurance was associated with an increased CDR in a previously published subset of our 2011–2013 health fair data (p = 0.019).11 This suggests that poor access to eye care leads to missed early detection. McClure et al reported that those who never had insurance were less likely to have had a previous eye exam and more likely to have difficulty in obtaining eye care.19
In comparison, some studies suggest that insurance or financial assistance does not lead to better follow-up. Quigley et al had a relatively high FFU proportion of 59% (79/1331) despite providing free clinic visits and transportation. However, this could be attributed to having technician (rather than physician) screeners and 26% of patients not receiving a follow-up appointment.7 Indeed, prescheduling appointments at the time of screening was previously shown to enhance follow-up.22 Interestingly, the Screening To Prevent (SToP) Glaucoma Study demonstrated a FFU of 57.0% (203/356) despite providing free follow-up visits, free glasses, prescheduled appointments, educational materials, phone and text reminders, and social workers to help obtain insurance.15 Insurance status was not associated with follow-up in their study (p = 0.39), however a majority of their participants (93.8%, 830/885) were already insured.23 In contrast, our data showed that insurance was the predominant factor affecting follow-up in largely underserved populations. Uninsured Miami-Dade residents are eligible for a Jackson Card, a form of government-funded charity care offered through the municipal Jackson Memorial Hospital Public Health Trust. Having social workers on-site to assist with this program would be very beneficial for our screening system.
On a larger scale, controversy still exists over glaucoma screening due to the US Preventive Services Task Force finding insufficient evidence to recommend it.24 This recommendation has been criticized for giving primary care providers the impression that glaucoma screening is of no value.25 By selecting high-risk populations, pre-test probability increases as well as the predictive value for a positive test.26 While fully addressing this topic is outside the scope of this paper, the current study identified a relatively high proportion of glaucoma suspects (30.9%, 144/466). This adds to the argument that glaucoma screening is pragmatic, particularly when appropriate populations are selected for screening. Efforts should focus on how to get glaucoma suspects into the clinic instead of whether they should be screened in the first place.
Several limitations to the current study include its small sample size and inherently retrospective nature. Self-reporting is subject to recall bias which may have influenced the accuracy of answers to the survey given that the health fairs were approximately 2 years before the telephone encounter. A substantial loss to follow up either due to unsuccessful attempts to contact participants or deferring to complete the survey affected follow-up numbers. Some participants who could not be contacted were frequently homeless, had no contact information, or utilized temporary housing. Therefore, responders may have had higher socioeconomic status than non-responders, which could have affected the results via nonresponse bias. Of note, our telephone response proportion (49%) was higher than what is commonly cited in the literature: Quigley et al reported 30% and Gower et al reported 39%7,12 Household income and health literacy levels were not directly assessed. Finally, the diverse South Florida communities screened are not representative of the general population. However, our results may still be applicable to other glaucoma screening protocols focused on at-risk populations.
Studies that examine follow-up after glaucoma screening are useful not only for identifying population-specific socioeconomic barriers to follow-up, but also to help identify aspects of the screening program that need to be improved. Based on the literature, modifiable elements that appear important for follow-up include financial assistance, same-day appointment scheduling, nearby offices, transportation assistance, and direct physician counseling.
Conclusion
Compared to other studies, our screening program had a FFU proportion just below average, and insurance status was the primary determinant of follow-up. Augmenting our health fairs with stronger social work support to obtain health insurance will be useful in serving the high-risk, underserved populations of South Florida, and improving models for glaucoma screening across the nation.
Funding
NIH Center Core Grant P30EY014801, Research to Prevent Blindness Unrestricted Grant (GR004596). The sponsor or funding organization had no role in the design or conduct of this research.
Disclosure
The authors report no conflicts of interest in this work.
References
1. Tham YC, Li X, Wong TY, Quigley HA, Aung T, Cheng CY. Global prevalence of glaucoma and projections of glaucoma burden through 2040. Ophthalmology. 2014;121(11):2081–2090. doi:10.1016/j.ophtha.2014.05.013
2. Heijl A, Leske MC, Bengtsson B, Hyman L, Bengtsson B, Hussein M. Reduction of intraocular pressure and glaucoma progression: results from the early manifest glaucoma trial. Arch Ophthalmol. 2002;120(10):1268–1279. doi:10.1001/archopht.120.10.1268
3. Shaikh Y, Yu F, Coleman AL. Burden of undetected and untreated glaucoma in the United States. Am J Ophthalmol. 2014;158(6):1121–1129. e1121. doi:10.1016/j.ajo.2014.08.023
4. Boland MV, Quigley HA. Risk factors and open-angle glaucoma: classification and application. J Glaucoma. 2007;16(4):406–418. doi:10.1097/IJG.0b013e31806540a1
5. Prum JBE, Rosenberg LF, Gedde SJ, et al. Primary open-angle glaucoma preferred practice pattern (®) guidelines. Ophthalmology. 2016;123(1):41–111. doi:10.1016/j.ophtha.2015.10.053
6. Centers for Medicare & Medicaid Services. Medicare vision services. Available from: https://www.cms.gov/outreach-and-education/medicare-learning-network-mln/mlnproducts/downloads/visionservices_factsheet_icn907165.pdf.
7. Quigley HA, Park CK, Tracey PA, Pollack IP. Community screening for eye disease by laypersons: the Hoffberger program. Am J Ophthalmol. 2002;133(3):386–392. doi:10.1016/S0002-9394(01)01380-0
8. McManus JR, Netland PA. Screening for glaucoma: rationale and strategies. Curr Opin Ophthalmol. 2013;24(2):144–149. doi:10.1097/ICU.0b013e32835cf078
9. Zhao D, Guallar E, Gajwani P, et al. Optimizing glaucoma screening in high-risk population: design and 1-year findings of the screening to prevent (SToP) glaucoma study. Am J Ophthalmol. 2017;180:18–28. doi:10.1016/j.ajo.2017.05.017
10. Skorin JL, Multack RF, Holtzman JN. Health fair glaucoma screening: follow-up evaluation. J Am Osteopath Assoc. 1991;91(7):671–674. doi:10.1515/jom-1991-900710
11. Bokman CL, Pasquale LR, Parrish RK
12. Gower EW, Silverman E, Cassard SD, et al. Barriers to attending an eye examination after vision screening referral within a vulnerable population. J Health Care Poor Underserved. 2013;24(3):1042–1052. doi:10.1353/hpu.2013.0134
13. Gwira JA, Vistamehr S, Shelsta H, et al. Factors associated with failure to follow up after glaucoma screening. Ophthalmology. 2016;113(8):1315–1319. doi:10.1016/j.ophtha.2006.04.017
14. Hark LA, Leiby BE, Waisbourd M, et al. Adherence to follow-up recommendations among individuals in the Philadelphia glaucoma detection and treatment project. J Glaucoma. 2017;26(8):697–701. doi:10.1097/IJG.0000000000000716
15. Zhao D, Guallar E, Gajwani P, et al.; SToP Glaucoma Study Group. Optimizing glaucoma screening in high-risk population: design and 1-year findings of the Screening to Prevent (SToP) glaucoma study. Am J Ophthalmol. 2017;180:18–28.
16. Altangerel U, Nallamshetty HS, Uhler T, et al. Knowledge about glaucoma and barriers to follow-up care in a community glaucoma screening program. Can J Ophthalmol. 2009;44(1):66–69. doi:10.3129/i08-175
17. Johnson DM, Stratford S, Shyu AP, et al. The impact of educational workshops on individuals at risk for glaucoma in the Philadelphia glaucoma detection and treatment project. Patient Educ Couns. 2016;99(4):659–664. doi:10.1016/j.pec.2015.11.026
18. Chiang YP, Wang F, Javitt JC. Office visits to ophthalmologists and other physicians for eye care among the U.S. population, 1990. Public Health Rep. 1995;110(2):147–153.
19. McClure LA, Zheng DD, Lam BL, et al. Factors associated with ocular health care utilization among Hispanics/Latinos: results from an ancillary study to the Hispanic community health study/study of Latinos. JAMA Ophthalmol. 2016;134(3):320–329. doi:10.1001/jamaophthalmol.2015.5842
20. Lee DJ, Lam BL, Arora S, et al. Reported eye care utilization and health insurance status among US adults. Arch Ophthalmol. 2009;127(3):303–310. doi:10.1001/archophthalmol.2008.567
21. Li YJ, Xirasagar S, Pumkam C, et al. Vision insurance, eye care visits, and vision impairment among working-age adults in the United States. JAMA Ophthalmol. 2013;131(4):499–506. doi:10.1001/jamaophthalmol.2013.1165
22. van Zyl T, Su Z, Zhou E, et al. Providing prescheduled appointments as a strategy for improving follow-up compliance after community-based glaucoma screening: results from an urban underserved population. J Community Health. 2015;40(1):27–33. doi:10.1007/s10900-014-9890-2
23. Zhao D, Guallar E, Bowie JV, et al. Improving follow-up and reducing barriers for eye screenings in communities: the SToP glaucoma study. Am J Ophthalmol. 2018;188:19–28. doi:10.1016/j.ajo.2018.01.008
24. Moyer VA. Screening for glaucoma: US preventive services task force recommendation statement. Ann Intern Med. 2013;159(7):484–489. doi:10.7326/0003-4819-159-6-201309170-00686
25. Parrish RK. Reframing the US preventive services task force recommendations on screening for glaucoma. Am J Ophthalmol. 2014;158(5):860–862. doi:10.1016/j.ajo.2014.08.004
26. Mills RP. Glaucoma screening: the value is in the details. Am J Ophthalmol. 2008;145(1):3–4. doi:10.1016/j.ajo.2007.09.017
 © 2021 The Author(s). This work is published and licensed by Dove Medical Press Limited. The full terms of this license are available at https://www.dovepress.com/terms.php and incorporate the Creative Commons Attribution - Non Commercial (unported, v3.0) License.
By accessing the work you hereby accept the Terms. Non-commercial uses of the work are permitted without any further permission from Dove Medical Press Limited, provided the work is properly attributed. For permission for commercial use of this work, please see paragraphs 4.2 and 5 of our Terms.
© 2021 The Author(s). This work is published and licensed by Dove Medical Press Limited. The full terms of this license are available at https://www.dovepress.com/terms.php and incorporate the Creative Commons Attribution - Non Commercial (unported, v3.0) License.
By accessing the work you hereby accept the Terms. Non-commercial uses of the work are permitted without any further permission from Dove Medical Press Limited, provided the work is properly attributed. For permission for commercial use of this work, please see paragraphs 4.2 and 5 of our Terms.