Back to Journals » OncoTargets and Therapy » Volume 12
Analysis of risk factors for colon cancer progression
Authors Yang Z ![]() , Chen Y, Wu D, Min Z, Quan Y
, Chen Y, Wu D, Min Z, Quan Y
Received 2 March 2019
Accepted for publication 24 April 2019
Published 22 May 2019 Volume 2019:12 Pages 3991—4000
DOI https://doi.org/10.2147/OTT.S207390
Checked for plagiarism Yes
Review by Single anonymous peer review
Peer reviewer comments 2
Editor who approved publication: Dr Arseniy Yuzhalin
Zhou Yang,* Yusheng Chen,* Dejun Wu, Zhijun Min, Yingjun Quan
Department of General Surgery, Shanghai Pudong Hospital, Fudan University Pudong Medical Center, Shanghai 201399, People’s Republic of China
*These authors contributed equally to this work
Purpose: This study aimed to find risk factors for colon cancer progression with bioinformatics methods, and validated by clinical patients.
Methods: Differentially expressed genes (DEGs) between colon cancer tissues and normal colon tissues were extracted from The Cancer Genome Atlas (TCGA) database using R software, amounted to 8,051. DEGs between pathologic stage I+II and stage III+IV amounted to 373, and were compared with DEGs of cancer/normal analyzed above to get the intersection of both. Ninety-six intersected DEGs were identified and defined as progressive DEGs of colon cancer. Then these 96 progressive DEGs were studied by Gene ontology and KEGG (Kyoto Encyclopedia of Genes and Genomes) pathway analysis using the DAVID database and visualizing by R software. A protein–protein interaction (PPI) network and functional modules were established using the STRING database. Further, an overall survival (OS) curve was drawn via the GEPIA website based on the CGA database and six progressive DEGs were found to be involved with OS of colon cancer patients. The Linkedomics website was used for detailed analysis of specific subsets of TNM.
Results: Pregnancy specific glycoprotein (PSG), vitamin digestion, and absorption were confirmed to promote the progression of colon cancer. Furthermore, NTF4 was found to be associated with both OS and each subset of TNM; therefore, defined as a key risk factor for colon cancer progression. Further analysis of NTF4 expression using clinical data showed it acted as a key risk factor and diagnosis marker for colon cancer progression.
Conclusion: NTF4 is a risk factor contributing to colon cancer progression and associated with overall survival.
Keywords: colon cancer, differentially expressed genes, tumor progression, NTF4
Introduction
Colon cancer is a common malignant tumor of the digestive tract. Nearly one million people suffer every year, and the mortality rate is as high as 33%.1 The early symptoms of colon cancer are not obvious, but the progression and distant metastasis of advanced tumors can lead to changes in patients’ stool habits, hematochezia, emaciation, and a series of symptoms including anemia, colonic fistula, partial or complete intestinal obstruction, and intestinal perforation. At present, the treatment of colon cancer mainly depends on surgery, radiotherapy and chemotherapy. However, it is difficult for advanced patients to operate, and the side-effects of radiotherapy and chemotherapy are serious, which may cause chemotherapy resistance.2,3 Risk factors for colon cancer include smoking, overweight, excessive intake of red meat products, and so on.4 These risk factors may all play a role at the genetic level. Therefore, it is urgent to find risk factors that affect the progression of colon cancer, as they would be effective diagnosis markers and therapeutic targets.
As the largest database of cancer, the Cancer Genome Atlas (TCGA), a landmark cancer genomics program, molecularly characterized over 20,000 primary cancer and matched normal samples spanning 33 cancer types. Through bioinformatics methods, we can deeply mine tumor gene data and further connect it to clinical data, so as to obtain more accurate and meaningful results.5 In order to identify risk factors for colon cancer progression, our research analyzed mRNA expression data of TCGA-Colon Adenocarcinoma (TCGA-COAD) via R software and several online tools .
Materials and methods
TCGA data
TCGA-Colon Adenocarcinoma (
DEGs analysis with R software
The original expression level of mRNA downloaded from TCGA was normalized through the R software “Limma” package (
Gene ontology, KEGG pathway, and protein–protein interaction analysis
The DEGs were uploaded to the Database for Annotation Visualization and Integrated Discovery (DAVID, david.ncifcrf.gov/) online tool for Gene ontology and KEGG pathway analysis. Concreate pathways and P-value were obtained and visualized by R software. For Protein–protein interaction (PPI) analysis, DEGs were uploaded to the STRING online tool (
Overall survival curve and TNM subsets analysis
Overall Survival (OS) curves and Disease Free Survival (DFS) curves of DEGs were drawn by the GEPIA online tool (
Patients and specimens
Seventy-four colon cancer specimens and four normal healthy colon tissues were collected from July 2008 to July 2010 (Table 1). Patients with the following criteria were excluded from participation: had previously received adjuvant chemotherapy or radiotherapy prior to surgery; had additional cancers diagnoses. All patients were classified according to the 7th edition of the TNM staging system 23. Postoperative adjuvant therapies were performed, according to standard schedules and doses. All participating patients provided written informed consent. This study was approved by the Ethical Committee of Shanghai Pudong Hospital.
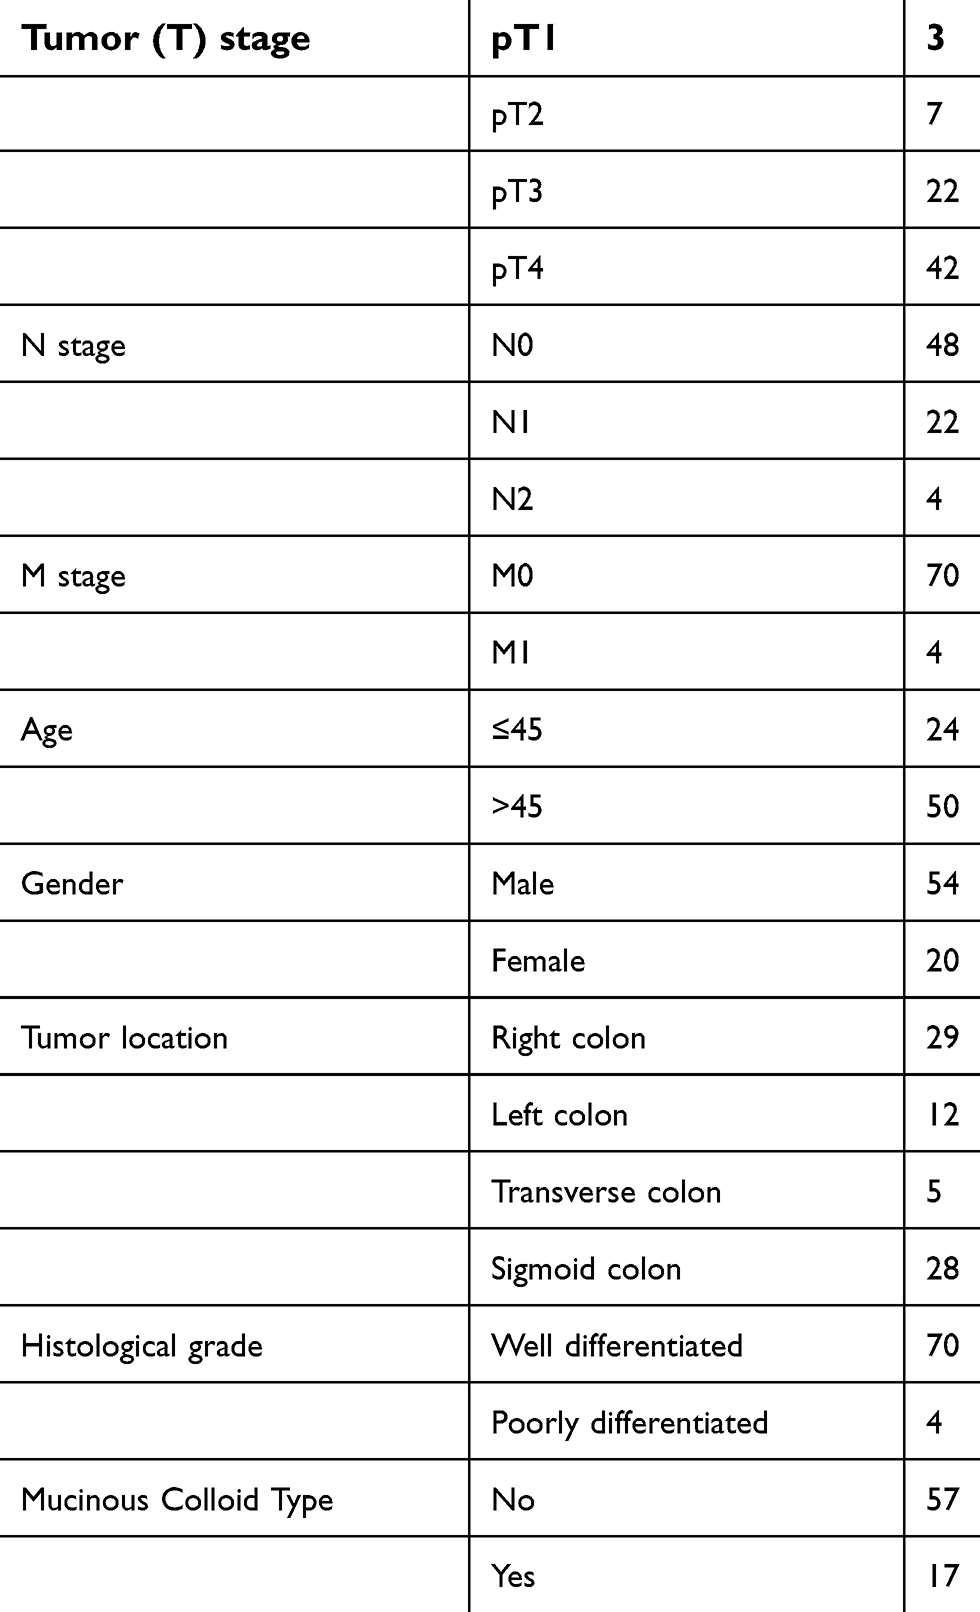 | Table 1 Clinical characteristics of patients |
RNA extraction and RT-qPCR
Total RNA was extracted by Trizol Regent (Invitrogen). cDNA was obtained using PrimeScript™ RT reagent kit (Takara Bio, Inc., Otsu, Japan). The expression of mRNA was assessed by RT-qPCR, which was carried out in triplicate by a SYBR Premix Ex Taq™ kit (Takara Bio) and ABI 7900HT Real‑Time PCR system (Applied Biosystems Life Technologies, Foster City, CA, USA). The primers of NTF4: GTACTTCTTTGAAACCCGCTG and GCAGTGTCAATTCGAATCCATC; Actin: GGGACCTGACTGACTACCTC and TCATACTCCTGCTTGCTGAT. The comparative cycle threshold values (2‑ΔΔCt) were adopted to analyze the final results.
Protein extraction and Western blot analysis
The total proteins were extracted using RIPA lysis buffer with 1% phenylmethanesulfonyl fluoride (PMSF). Then, equal amounts (20 μg) of protein determined by BCA protein assay kit (Thermo Fisher Scientific, USA) were separated using 10% SDS-PAGE gels. The proteins were then transferred to PVDF membranes (0.45 mm, Solarbio, China). The membranes were blocked with 5% non-fat milk for 1 hour at room temperature and then incubated with primary antibodies at 4℃ for 12 hours. NTF4 rabbit polyclonal antibodies (1:1,000, Cat: 12297-1-AP, Proteintech, USA) and β-actin rabbit polyclonal antibodies (1:4,000, Cat: 60008-1-Ig, Proteintech) were used as loading controls and normalization. The secondary antibody was anti-rabbit antibodies conjugated to horseradish peroxidase (HRP) (1:4,000, Proteintech). The antibody was used at a 1:4,000 dilution and was incubated for approximately 1 hour at room temperature. The bands were visualized with ECL reagents (Thermo Fisher Scientific) and developed by Omega Lum G (Aplegen, USA).
Immunohistochemical (IHC) staining
IHC staining was carried out according to manufacturer’s instruction. Briefly, formalin‑fixed and paraffin‑embedded tissue sections were deparaffinized in xylene and hydrated with decreasing concentrations of ethanol (100, 95, 80, and 75%). The slices were then soaked in 10% BSA to inhibit endogenous peroxidase activity and incubated with NTF4 rabbit polyclonal antibody (1:100) at 4°C overnight. A horseradish peroxidase‑conjugated rabbit secondary antibody was added for 60 minutes at room temperature; then, 3,3’‑diaminobenzidine (DAB) development (DAB Substrate Chromogen System; Dako, Glostrup, Denmark) and hematoxylin staining were performed according to standard protocols. Slides were fixed and images were obtained through an Olympus IX71 inverted microscope with a DP2‑BSW Olympus image acquisition software system. We scored the IHC staining based on the proportion of cell staining and the staining intensity. For each epitope, the staining score for tumor cells and normal epithelial cells was recorded separately. The percentage of immunostaining and the staining intensity (0, negative; 1+, weak; 2+, moderate; and 3+, strong) were recorded. An H-score was calculated using the following formula: H-score=∑(PI×I)=(percentage of cells of weak intensity×1)+(percentage of cells of moderate intensity×2)+percentage of cells of strong intensity×3).8 Here H-score was recorded as a continuous variable.
Statistical analysis
SPSS software (version 19.0, IBM Corp., Armonk, NY, USA) was used for statistical analysis of all the experimental data. GraphPad Prism (version 7, GraphPad Software, La Jolla, CA, USA) was used to determine the statistical results. All data are expressed as the mean±standard deviation (mean±SD). In addition to the contents of statistical methods described in the main body, statistical analysis of the data from two groups was performed using aindependent-smaples t-test. The comparisons of multiple groups were performed by one-way ANOVA and LSD t-test. P<0.05 was considered to be significant.
Results
Differentially expressed genes screening
R software was used to screen DEGs extracted from TCGA-COAD. In total, 8,051 and 373 DEGs were infirmed in the Cancer/Normal (Figure 1A) and Stage III+IV/I+II (Figure 1B) groups, respectively. Only 307 intersected DEGs of the two groups were obtained as progressive DEGs (Figure 1C). After removing non-coding genes, finally the remaining DEGs totaled 96, only 1.19% of the total Cancer/Normal DEGs (Table 2).
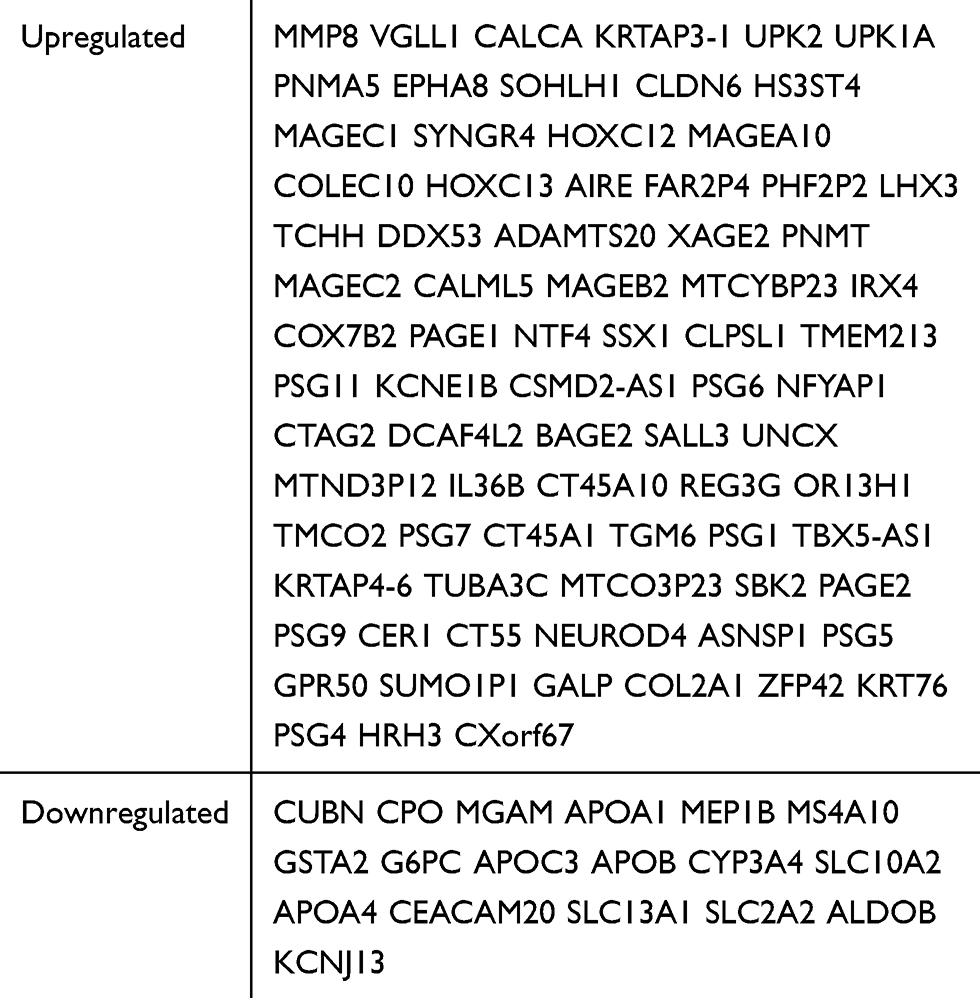 | Table 2 Intersection of DEGs between cancer/normal and stage III+IV/I+II group |
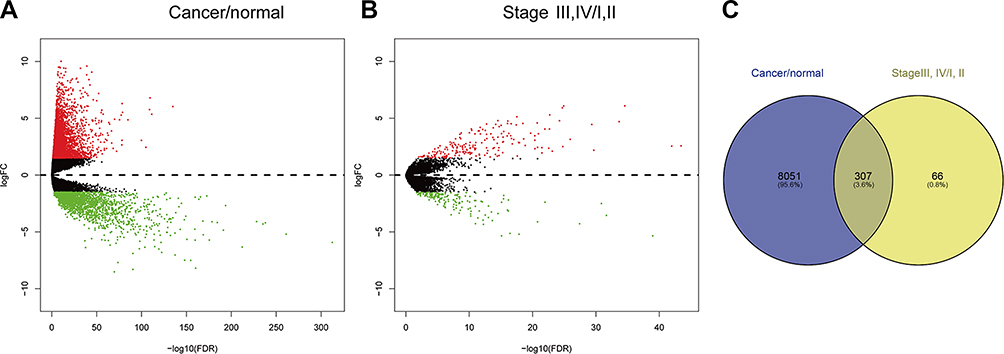 | Figure 1 DEGs analysis. (A) DEGs analysis between colon cancer and normal control. (B) DEGs analysis between Stage III+IV/I+II patients. (C) Intersection of DEGs between cancer/normal and stage III+IV/I+II group. |
Gene ontology, KEGG pathway, and protein–protein interaction analysis
Ninety-six of the DEGs screened above were identified as progressive DEGs, and further analysis was performed with DAVID tools and R software. In Gene ontology (GO) analysis, female pregnancy, lipoprotein metabolic process, and cholesterol homeostasis were three of the most enriched annotations (Figure 2A). In KEGG pathway analysis, vitamin digestion and absorption pathway were the most relevant pathways (Figure 2B). For PPI analysis, we found seven modules, accompanied with 32 nodes and 37 edges via STRING databases (Figure 2C).
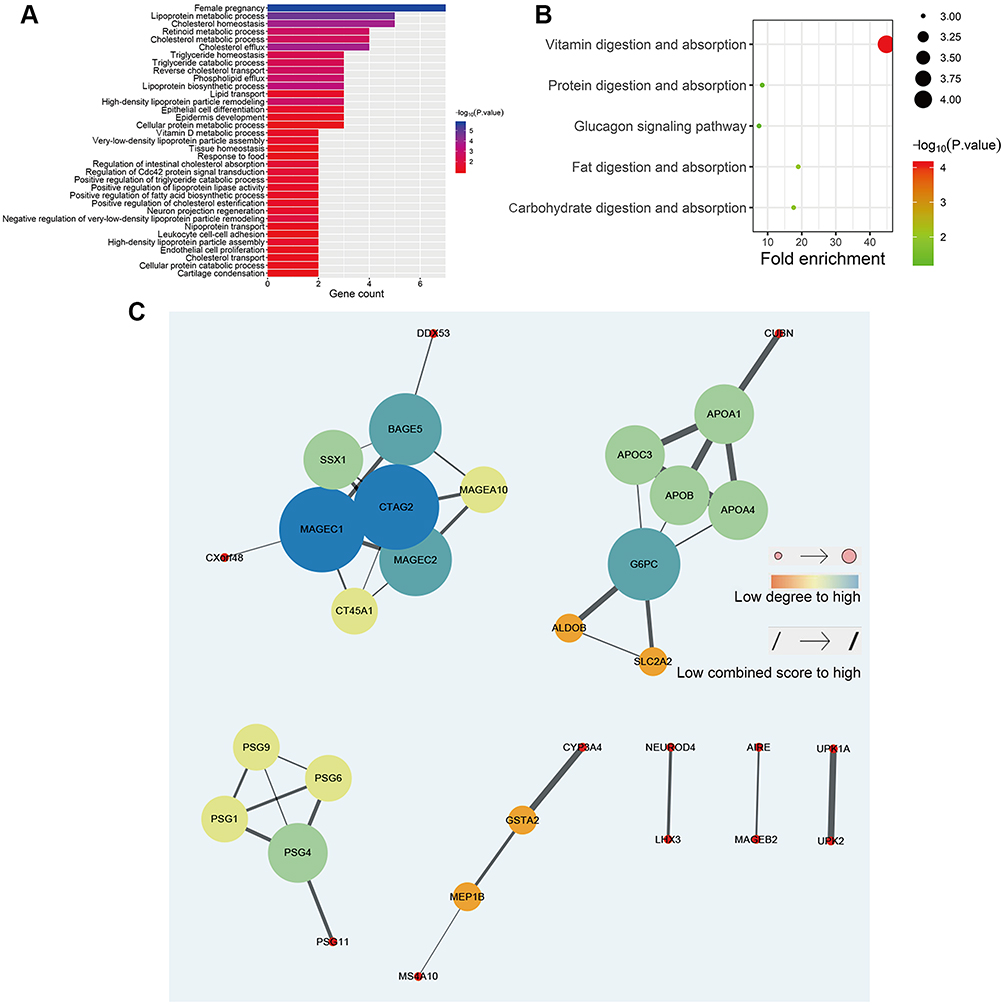 | Figure 2 (A) Gene ontology analysis of progressive DEGs. (B) KEGG pathway analysis of progressive DEGs. (C) PPI network analysis of progressive DEGs. |
Overall survive time analysis of DEGs
All the progressive DEGs were connected with clinical data of TCGA-COAD for further analysis of OS and RFS via GEPIA tools. P<0.05 was thought to be statistically significant. We finally got six DEGs associated with OS: ALDOB, CUBN, KRTAP3-1, NTF4, PNLDC1, PNMA5, TCHH (Figure 3A); in which three DEGs were further associated with RFS: CUBN, NTF4, TCHH (Figure 3B).
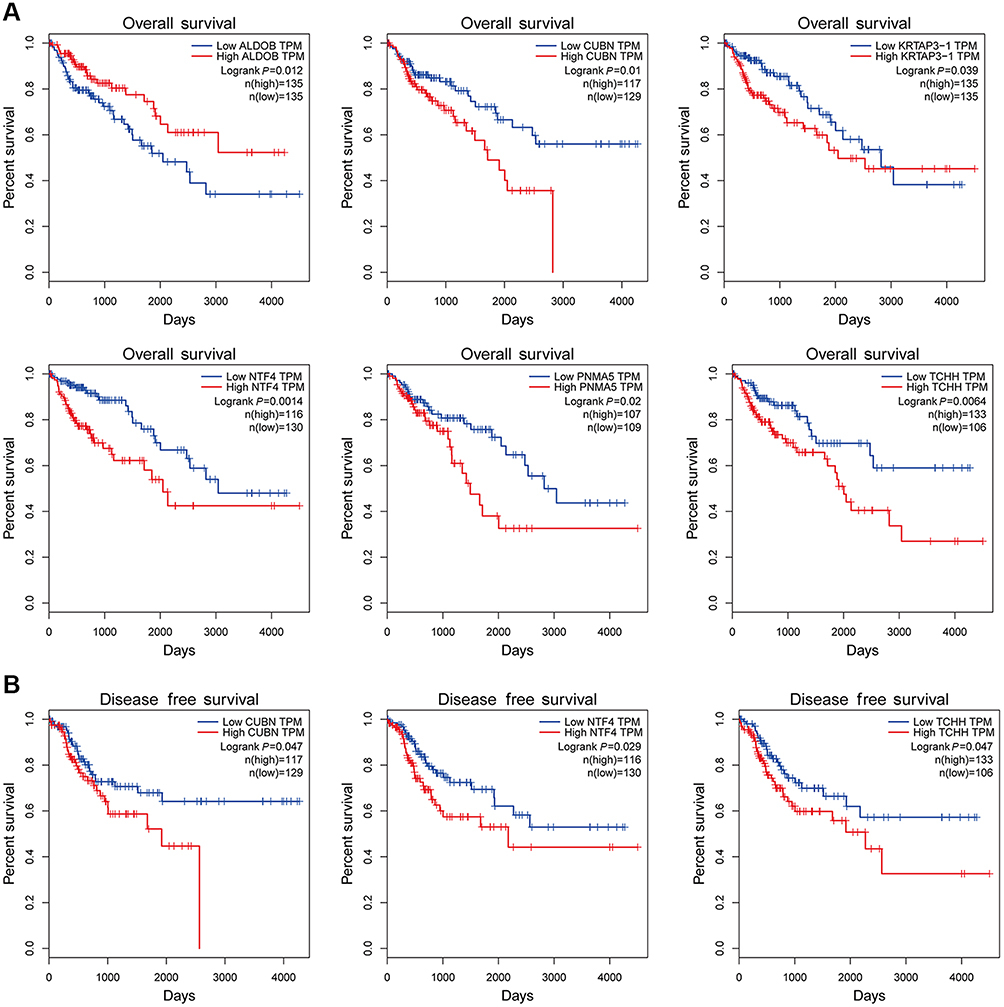 | Figure 3 (A) Overall survival analysis with progressive DEGs. (B) Disease free survival analysis of progressive DEGs. |
TNM subsets analysis
All six progressive DEGs associated with OS were further analyzed for expression in each TNM subset via LinkedOmics tools. P<0.05 was thought to be statistically significant. We found the expression of NTF4 continuously stepwise increased in each subset of TNM. In tumor stage, NTF4 had significantly increased in T4 stage; whereas no statistical differences between T1, T2, and T3 stage (Figure 4A) were found. In Node stage, NTF4 was significantly increased between both N1/N0 and N2/N1 (Figure 4B). In Metastasis stage, NTF4 was significantly increased in M1 stage compared with M0 stage (Figure 4C). In Pathologic stage, NTF4 expression of stages III and IV was both increased compared with stages I and II; whereas there was no statistical difference between stage III and IV, nor between stage I and II (Figure 4D).
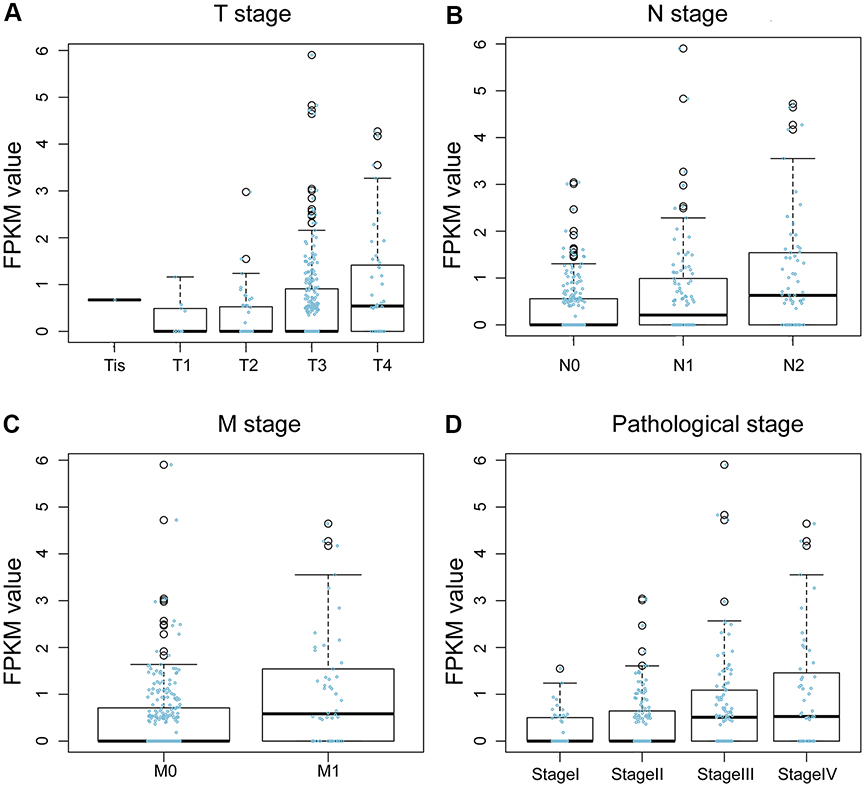 | Figure 4 Subset analysis of TNM (A) Tumor stage analysis of NTF4 expression. (B) Node stage analysis of NTF4 expression. (C) Metastasis stage analysis of NTF4 expression. (D) Pathologic stage analysis of NTF4 expression. |
NTF4 expression infirmed in clinical patients
For further confirmation of NTF4 expression in clinical colon cancer patients, tumor tissue was collected from 74 patients and four healthy samples were collected and performed with IHC. The staining score was analyzed as H-score described above. We analyzed correlative factors that may affect the overall OS of colon cancer patients via Cox’s proportional hazard model. In both univariate and multivariate analysis, high H-score of NTF4 all indicated poor OS. In univariate analysis, the P-value was 0.000, the hazard ratio (HR) was 1.056, and the 95% confidence interval (CI) was 1.037–1.076. In multivariate analysis, the P-value was 0.000, the HR was 1.048, and the 95% CI was 1.023–1.073 (Table 3, Figure 5A). The H-score of NTF4 also showed an obvious increasing trend in all TNM subsets as well as pathological stage (Figure 5B). Western Blot and RT-qPCR also infirmed NTF4 upregulating in tumor tissue compared with normal tissue at mRNA (Figure 5C) and protein level (Figure 5D).
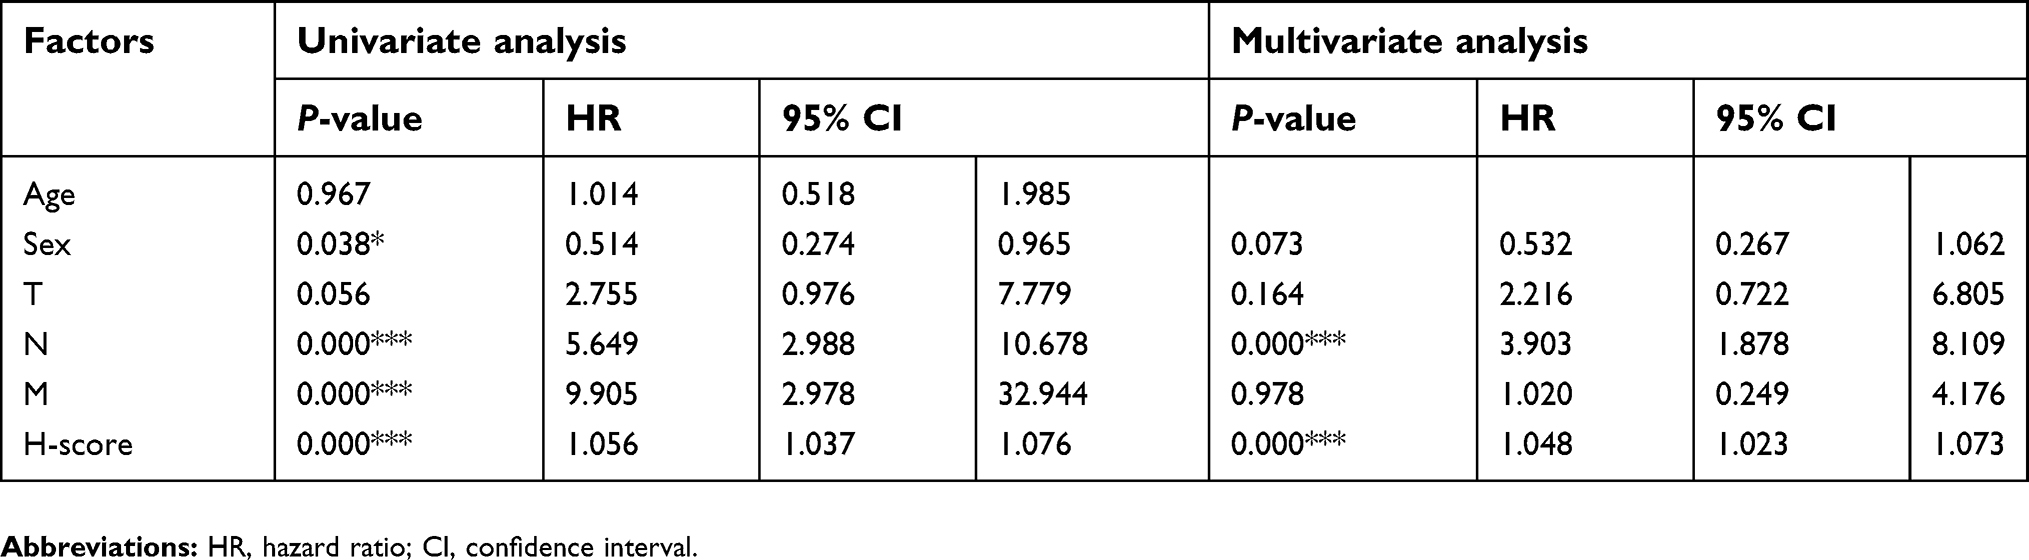 | Table 3 Cox’s proportional hazard model of colon cancer patients |
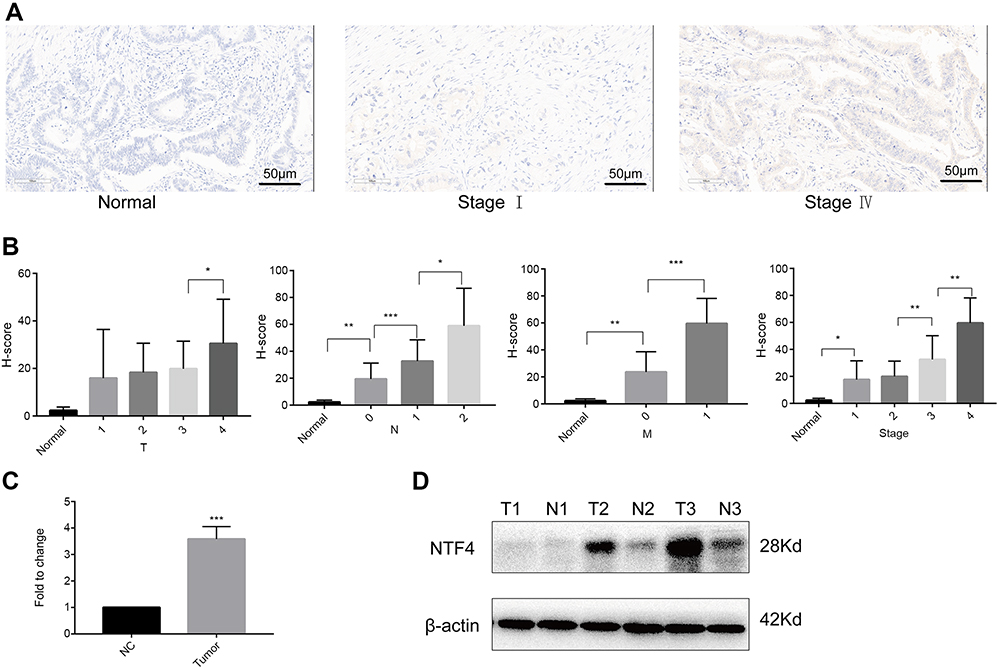 | Figure 5 (A) IHC of colon cancer tissue at different stages. (B) TNM subset analysis of H-score. (C) mRNA expression of NTF4 detected by RT-qPCR. (D) Protein expression of NTF4 detected by Western Blotting. (*P<0.05, **P<0.01, ***P<0.001). |
Discussion
In the past 10 years, despite many efforts in the research of colon cancer, the 5-year survival rate has not improved significantly. Early colon cancer has a good prognosis and can be cured by surgical resection combined with chemotherapy. Unfortunately, most patients with advanced colon cancer are not suitable for surgical resection alone, but can only undergo chemotherapy or palliative treatment.9 Therefore, exploring more effective diagnostic markers and therapeutic targets for advanced colon cancer is essential for the study. For this purpose, we screened DEGs of colon cancer by bioinformatics methods. DEGs related to cancer progression and OS were further analyzed, and finally validated in clinical patients’ samples.
In the preliminary screening results, 8,051 DEGs were identified as DEGs between colon cancer and normal tissue. Further analysis only infirmed 96 progressive DEGs associated with cancer progression, which accounted for 1.19%. Although the amount of DEGs between tumors and normal tissues is enormous, most of them may be of little significance or unclear significance, and only a very small proportion of them are really responsible for the progression of tumors. Next, 96 progressive DEGs were performed with Gene ontology and KEGG pathway analysis to learn their cellular component, molecular function, and biological process. In GO analysis, female pregnancy was confirmed as the most enriched annotation, which seemed absurd. Further study found this annotation came from pregnancy specific glycoprotein (PSG) 1, 4, 5, 6, 7, 9, 11. Among them, PSG9 was found to be upregulated in the early stage of colorectal cancer (CRC), and drives the progression of CRC and tumor angiogenesis.10,11 In pancreatic adenocarcinoma, cytoplasmic localized PSG1 is associated with shortened median survival.12 We suggested other members of the PSG family affect the progression of colon cancer as PSG9. In KEGG pathway analysis, vitamin digestion and the absorption pathway were the most relevant pathways of these DEGs. In a randomized clinical trial with 2,259 participants, the effect of vitamin D3 supplementation on advanced adenomas significantly varied according to genotype at two VDR SNPs (rs7968585 and rs731236) in linkage disequilibrium (D’=0.98; r2=0.6). For rs7968585, among individuals with the AA genotype (26%), vitamin D3 supplementation reduced risk by 64% (RR=0.36; 95% CI=0.19–0.69; P=0.002; absolute risk decreased from 14.4% to 5.1%). Among individuals with one or two G alleles (74%), vitamin D3 supplementation increased risk by 41% (RR=1.41; 95% CI=0.99–2.00; P=0.05; absolute risk increased from 7.7% to 11.1%; P<0.001 for interaction).13 In similar research, High vitamin D receptor expression in tumor stromal fibroblasts was associated with better OS and RFS in colorectal cancer, independently of its expression in carcinoma cells.14 PPI is the contact of high specificity established between two or more protein molecules as a result of biochemical events. Many molecular processes within a cell are carried out by molecular machines that are built from a large number of protein components organized by their PPI. PPI is the basis of multiple aggregation-related diseases, especially of cancer.15 In our PPI analysis, most proteins in the nodes were closely associated with various tumors, including breast cancer, synovial sarcoma, and lung cancer.16–18 We can’t rule out possible effects of these interacting proteins on the progression of colon cancer, whereas rare research was found in it.
We further analyzed all 96 progressive DEGs association with OS and RFS. Among them, six DEGs were associated with OS: ALDOB, CUBN, KRTAP3-1, NTF4, PNLDC1, PNMA5, TCHH; in which three DEGs were further associated with RFS: CUBN, NTF4, TCHH. Some of them had been studied in tumors. For example, high ALDOB expression was associated with poor OS and RFS in both univariate and multivariate regression analyses, and promotes colorectal cancer metastasis by facilitating epithelial-mesenchymal transition in vitro.19 In addition, targeting ALDOB or reducing dietary fructose significantly reduces liver metastatic growth, but has little effect on the primary tumor.20 Next, these six progressive DEGs associated with OS were further analyzed expression in each TNM subset. In which, expression of NTF4 showed a continuous stepwise increase in each subset of TNM. NTF4 gene encodes protein Neurotrophin-4 (NT-4), also known as neurotrophin-5 (NT-5). It is a neurotrophic factor that signals predominantly through the TrkB receptor tyrosine kinase. Its research focuses on neurology and ophthalmology, though rare in cancer. Except in breast cancer, NT-4/5 contribute to cancer cell survival and can serve as prospective targets in attempts to inhibit tumor growth.21 We finally confirmed its expression in clinical colon cancer patients. We found significant overexpression of NTF4 in colon cancer tissue compared with normal tissue. In Cox’s proportional hazard model, the high H-score of NTF4 indicated poor OS. In TNM subset analysis, the H-score of NTF4 also showed an obvious association with tumor progression.
In another bioinformatics research focused on metastasis-related genes in colon cancer, N0 and M0 patients were defined as the non-metastasis group, while all others were defined as a metastasis group, DEGs was extracted between them. REG1B, TGM6, NTF4, PNMA5, and HOXC13 were finally confirmed as significant prognostic genes for colon cancer. In contrast, there are some differences in our research results, which are mainly due to the design of the scheme. We also have some similar results, which prove the feasibility of our scheme.22 In addition, gene expression-based subtyping is widely accepted as a relevant source of cancer stratification. For example, CRC can be divided into four consensus molecular subtypes (CMS) with distinguishing features. Our analysis of risk factors for progression of colon cancer may also provide evidence for its subtype classification.23
In conclusion, we successfully confirmed several significant targets for diagnosis and treatment of advanced colon cancer. Among them, NTF4 is the most significant one and had been clinically verified.
Ethics approval and consent to participate
All procedures performed in studies involving human participants were in accordance with the ethical standards of the institutional and/or national research committee and with the 1964 Helsinki declaration and its later amendments or comparable ethical standards. Patients have given their written informed consent. The study protocol has been approved by the Pudong Hospital Committee on human research.
Availability of data and material
The datasets used and analyzed during the current study are available from the corresponding author on reasonable request.
Acknowledgments
This study was funded by Academic Leaders Training Program Supported by Pudong Health Bureau of Shanghai (Grant No. PWRd2016-05) and Natural Science Foundation of Shanghai (Grant No. 16411972800).
Author contributions
All authors contributed to data analysis, drafting or revising the article, gave final approval of the version to be published, and agree to be accountable for all aspects of the work.
Disclosure
The authors report no conflicts of interest in this work.
References
1. Cunningham D, Atkin W, Lenz HJ, et al. Colorectal cancer. Lancet. 2010;375(9719):1030–1047. doi:10.1016/S0140-6736(10)60353-4
2. Yatsuoka T, Nishimura Y, Sakamoto H, Tanaka Y, Kurozumi M. [Lymph node metastasis of colorectal cancer with submucosal invasion]. Gan To Kagaku Ryoho. 2013;40(12):2041–2043.
3. Shi Y, Huang XX, Chen GB, et al. Dragon (RGMb) induces oxaliplatin resistance in colon cancer cells. Oncotarget. 2016;7(30):48027–48037. doi:10.18632/oncotarget.10338
4. Zhivotovskiy AS, Kutikhin AG, Azanov AZ, Yuzhalin AE, Magarill YA, Brusina EB. Colorectal cancer risk factors among the population of South-East Siberia: a case-control study. Asian Pac J Cancer Prev. 2012;13(10):5183–5188.
5. Yuzhalin AE, Urbonas T, Silva MA, Muschel RJ, Gordonweeks AN. A core matrisome gene signature predicts cancer outcome. Br J Cancer. 2018;118(3):435–440. doi:10.1038/bjc.2017.458
6. Tang Z, Li C, Kang B, Gao G, Li C, Zhang Z. GEPIA: a web server for cancer and normal gene expression profiling and interactive analyses. Nucleic Acids Res. 2017;45(W1):W98–w102. doi:10.1093/nar/gkx247
7. Vasaikar SV, Straub P, Wang J, Zhang B. LinkedOmics: analyzing multi-omics data within and across 32 cancer types. Nucleic Acids Res. 2018;46(D1):D956–D963. doi:10.1093/nar/gkx1090
8. Azim HA
9. Moriarity A, O’Sullivan J, Kennedy J, Mehigan B, Mccormick P. Current targeted therapies in the treatment of advanced colorectal cancer: a review. Ther Adv Med Oncol. 2016;8(4):276. doi:10.1177/1758834016646734
10. Shimizu Y, Oshima K, Nakano Y, Fujita M, Taguchi T. Significance of pregnancy-associated α2-glycoprotein (α2-PAG) in patients with breast,gastric and colorectal cancer. Biken J. 1981;24(24):95–102.
11. Yang L, Hu S, Tan J, et al. Pregnancy-specific glycoprotein 9 (PSG9), a driver for colorectal cancer, enhances angiogenesis via activation of SMAD4. Oncotarget. 2016;7(38):61562–61574. doi:10.18632/oncotarget.11146
12. Shahinian JH, Fuellgraf H, Tholen S, et al. Pregnancy specific β-1 glycoprotein 1 is expressed in pancreatic ductal adenocarcinoma and its subcellular localization correlates with overall survival. J Cancer. 2016;7(14):2018–2027. doi:10.7150/jca.15864
13. Barry EL, Peacock JL, Rees JR, et al.Vitamin D Receptor Genotype, Vitamin D3 Supplementation, and Risk of Colorectal Adenomas: A Randomized Clinical Trial. JAMA Oncol. 2017;3(5):628–635. doi:10.1001/jamaoncol.2016.5917
14. Ferrer-Mayorga G, Gomez-Lopez G, Barbachano A, et al. Vitamin D receptor expression and associated gene signature in tumour stromal fibroblasts predict clinical outcome in colorectal cancer. Gut. 2017;66(8):1449–1462. doi:10.1136/gutjnl-2015-310977
15. De LRJ, Fontanillo C. Protein-protein interactions essentials: key concepts to building and analyzing interactome networks. PLoS Comput Biol. 2010;6(6):e1000807. doi:10.1371/journal.pcbi.1000807
16. Maine EA, Westcott JM, Prechtl AM, Dang TT, Whitehurst AW, Pearson GW. The cancer-testis antigens SPANX-A/C/D and CTAG2 promote breast cancer invasion. Oncotarget. 2016;7(12):14708–14726. doi:10.18632/oncotarget.7408
17. Tsuyoshi S, Makoto N, Marc L. SYT-SSX1 and SYT-SSX2 interfere with repression of E-cadherin by snail and slug: a potential mechanism for aberrant mesenchymal to epithelial transition in human synovial sarcoma. Cancer Res. 2006;66(14):6919–6927. doi:10.1158/0008-5472.CAN-05-3697
18. Wang L, Xu Y, Luo C, et al. MAGEA10 gene expression in non-small cell lung cancer and A549 cells, and the affinity of epitopes with the complex of HLA-A ∗ 0201 alleles. Cell Immunol. 2015;297(1):10–18. doi:10.1016/j.cellimm.2015.05.004
19. Li Q, Li Y, Xu J, et al. Aldolase B overexpression is associated with poor prognosis and promotes tumor progression by epithelial-mesenchymal transition in colorectal adenocarcinoma. Cell Physiol Biochem. 2017;42(1):397–406. doi:10.1159/000477484
20. Bu P, Chen KY, Xiang K, et al. Aldolase B-mediated fructose metabolism drives metabolic reprogramming of colon cancer liver metastasis. Cell Metab. 2018;27(6):1249–1262.e1244. doi:10.1016/j.cmet.2018.04.003
21. Vanhecke E, Adriaenssens E, Verbeke S, et al. Brain-derived neurotrophic factor and neurotrophin-4/5 are expressed in breast cancer and can be targeted to inhibit tumor cell survival. Clin Cancer Res. 2011;17(7):1741–1752. doi:10.1158/1078-0432.CCR-10-1890
22. Zhou Y, Zang Y, Yang Y, Xiang J, Chen Z. Candidate genes involved in metastasis of colon cancer identified by integrated analysis. Cancer Med. 2019. doi:10.1002/cam4.2071
23. Guinney J, Dienstmann R, Wang X, et al. The consensus molecular subtypes of colorectal cancer. Nat Med. 2015;21(11):1350–1356. doi:10.1038/nm.3967
 © 2019 The Author(s). This work is published and licensed by Dove Medical Press Limited. The
full terms of this license are available at https://www.dovepress.com/terms
and incorporate the Creative Commons Attribution
- Non Commercial (unported, 3.0) License.
By accessing the work you hereby accept the Terms. Non-commercial uses of the work are permitted
without any further permission from Dove Medical Press Limited, provided the work is properly
attributed. For permission for commercial use of this work, please see paragraphs 4.2 and 5 of our Terms.
© 2019 The Author(s). This work is published and licensed by Dove Medical Press Limited. The
full terms of this license are available at https://www.dovepress.com/terms
and incorporate the Creative Commons Attribution
- Non Commercial (unported, 3.0) License.
By accessing the work you hereby accept the Terms. Non-commercial uses of the work are permitted
without any further permission from Dove Medical Press Limited, provided the work is properly
attributed. For permission for commercial use of this work, please see paragraphs 4.2 and 5 of our Terms.