Back to Journals » Clinical, Cosmetic and Investigational Dermatology » Volume 16
Analysis of Lower-Limb Ulcers in Participants with Leprosy Sequelae Using Metabolomics and 16S Ribosomal DNA Sequencing
Authors Wang J, Wang B, Liang C, Jin C, Shen H ![]()
Received 19 September 2023
Accepted for publication 28 November 2023
Published 5 December 2023 Volume 2023:16 Pages 3465—3480
DOI https://doi.org/10.2147/CCID.S441000
Checked for plagiarism Yes
Review by Single anonymous peer review
Peer reviewer comments 2
Editor who approved publication: Dr Jeffrey Weinberg
Jian Wang,1 Ben Wang,2 Chao Liang,3 Caifei Jin,4 Huiliang Shen1
1Department of Dermatology, Zhejiang Province Dermatology Hospital, Huzhou City, 313200, Zhejiang Province, People’s Republic of China; 2Department of Information Technology, Zhejiang Province Dermatology Hospital, Huzhou City, 313200, Zhejiang Province, People’s Republic of China; 3Department of Surgery, Zhejiang Province Dermatology Hospital, Huzhou City, 313200, Zhejiang Province, People’s Republic of China; 4Department of Medical Technology, Zhejiang Province Dermatology Hospital, Huzhou City, 313200, Zhejiang Province, People’s Republic of China
Correspondence: Huiliang Shen, Department of Dermatology, Zhejiang Province Dermatology Hospital, No. 61, Wuyuan Street, Deqing County, Huzhou City, Zhejiang Province, 313200, People’s Republic of China, Tel +86-13706535666, Email [email protected]
Purpose: This study investigated microbiome and metabolome differences between ulcerated tissues and normal skin from the lower limbs of participants with leprosy.
Patients and Methods: Ulcerated tissues and surrounding normal skin were collected from the lower limbs of 28 participants with leprosy who had been cured. The 16S ribosomal DNA sequencing analysis of the samples was conducted with the Illumina NovaSeq platform to analyze the community structure and diversity of microorganisms on the skin surface, followed by non-targeted metabolomic analysis with LC-MS technology. Next, differential metabolites were statistically screened, followed by metabolic pathway analysis. The Spearman method was used to analyze the correlation between differential microbiota and differential metabolites.
Results: Compared to normal skin, ulcerated tissues showed a decrease in microbial α diversity (species richness, homogeneity, and sequencing depth), without significant differences (observed species, Chao1, Shannon, Simpson, and Pielou’s evenness index; P > 0.05). Conversely, Jaccard distance demonstrated that sample β-diversity exhibited a certain degree of clustering (P < 0.05), with significant differences between the two groups. The results of LEfSe analysis revealed that compared to the normal skin, the ulcerated tissues had significantly decreased microbial abundance of Flavobacteriaceae, Flavobacteriales, Lachnospiraceae, Lachnospirales, Enterobacterales, Acinetobacter, and Moraxellaceae, which might be associated with the ulcerative state. The Spearman correlation analysis suggested a strong correlation between skin metabolome and skin microbiome.
Conclusion: For participants with leprosy sequelae, skin microecology and metabolites are disturbed and species diversity and homogeneity are reduced in lower-limb ulcers, and the types of skin metabolites are dependent on the microbiota.
Keywords: leprosy, lower-limb ulcers, 16S rDNA sequencing, metabolome, skin microecology
Introduction
Leprosy is a disabling infectious disease that predominantly occurs in the skin and peripheral nerves and is transmitted by contact with pathogenic bacteria through the respiratory tract and broken skin. Leprosy is attributed to infection with Mycobacterium leprae (M. leprae)1 and the more recently discovered Mycobacterium lepromatosis.2 In addition, humans and other animals such as armadillo and red squirrels can be influenced by other leprosy-like diseases resulting from pathogens that are phylogenetically closely related to M. leprae and may be involved in the leprosy course. These mycobacteria have been proposed to be classified as M. leprae-complexes.3 The vast majority of people are not susceptible to leprosy and even do not experience disease progression after exposure to pathogenic bacteria or recover spontaneously after a single lesion occurs.4 As a requisite cause of leprosy progression, M. leprae shares the same host colonization strategy with other bacteria, such as Mycobacterium tuberculosis.5 Accordingly, leprosy is a complex microecological disorder, and the microbiome on the skin surface may have a significant impact on the disease state. Also, leprosy lesions may compromise the skin barrier and enable the survival of bacteria that are normally absent in healthy skin.
The degree of host infection by M. leprae and the progression of the disease are determined by the ability of the mycobacterium to form a safe environment for its replication during its early interactions with the host cells. The clinical phenotype of leprosy is a result of the regulation of biological pathways by M. leprae. The progression of the disease is influenced by the combination of the genetic diversity of genes associated with these biological pathways in the host, the effect of pathogens on adult Schwann cell reprogramming, and interactions with innate and adaptive immunity.6 Among the theories about the causes of leprosy, one suggests that M. leprae can promote its own survival by regulating the lipid metabolism of the host.7 Therefore, analysis of leprosy-related metabolome may provide new information on disease mechanisms.
Lower-limb ulcers are a symptom of leprosy, which appear during a specific course and occur in different patients due to varying causes, including the occurrence of type I and II leprosy reactions, Lucio’s phenomenon, and neuropathy.8,9 Leprosy can affect the tibial and common peroneal nerves of the lower limbs in patients, leading to sensory and motor deficits in the innervated areas. Neuropathy places patients at risk for injuries and chronic ulcers from daily activities.10 Moreover, the vascular and neurological lesions caused by leprosy may slow down the healing of ulcers. Since the causes of ulcers vary from patient to patient, in addition to multidrug therapy, patient-specific therapeutic interventions are needed to timely arrest disease progression and then avoid disability.11 Therefore, it is crucial to identify the specific cause of lower-limb ulcers induced by leprosy for specific treatment and recurrence prevention.
The microbiome of leprosy has been studied in only two 16S ribosomal DNA (rDNA) sequencing studies conducted in Brazil and India and never in China.12,13 The skin microbiome is strongly influenced by biogeography. Previous studies have shown that there may also be subtle differences in pathogenic bacteria from region to region. Additionally, metabolomic studies on leprosy have focused on serum metabolomics in patients with leprosy and urinary metabolomic changes due to leprosy reactions.14,15 The skin metabolome was only explored in a study on polyunsaturated fatty acid, which included eight patients, to validate the serum metabolome.16 Of note, skin can be most directly affected in patients with leprosy. Leprosy is curable clinically with multi-drug therapy, while leprosy-induced ulcers are sequela characterized by slow healing and frequent recurrence. The current common surgical treatments for leprosy-induced ulcers include debridement, skin transplantation, and even amputation. Unfortunately, the effect of these treatments is often unsatisfactory.17,18
In this study, 16S rDNA sequencing and metabolomics were used to analyze 28 cured participants with leprosy-induced ulcers of different types who had normal body mass index (BMI) and were distributed in all age and sex groups, with the surrounding normal skin tissues of these participants as controls for omics association analysis. In this way, this study investigated the pathological mechanisms of lower-limb ulcers in participants with leprosy sequelae to provide promising diagnostic targets and therapeutic strategies.
Participants and Methods
Participants
Our study included 28 cured participants with leprosy-induced ulcers, and ulcerated tissues and surrounding normal skin were obtained from the lower limbs of the participants for 16S rRNA and metabolomic analyses. Participants with clinically confirmed leprosy were recruited from the dermatology department in Zhejiang Province. All participants met the clinical diagnostic criteria for leprosy. The inclusion criteria were listed below: participants diagnosed with leprosy based on the diagnostic criteria of Leprosy Diagnosis (WS291-2018); participants with lower-limb ulcers caused by leprosy who had been cured; participants not treated with antibiotics, glucocorticoids, and immunosuppressants within 1 month; participants whose skin surface was not coated with cosmetics before sampling. 26 Participants received debridement treatment, 20 of them received Skin-grafting surgery, and 18 of them used topical wound antiseptics and growth factors.
The exclusion criteria were as follows: participants combined with foot diseases (psoriasis, Tinea pedis, eczema, or other skin diseases).
Finally, 28 participants were included, who suffered from no other skin diseases with an age of 38–89 (66.32 ± 9.42) years and BMI of 23.34 ± 1.51. The remaining information is depicted in Table 1.
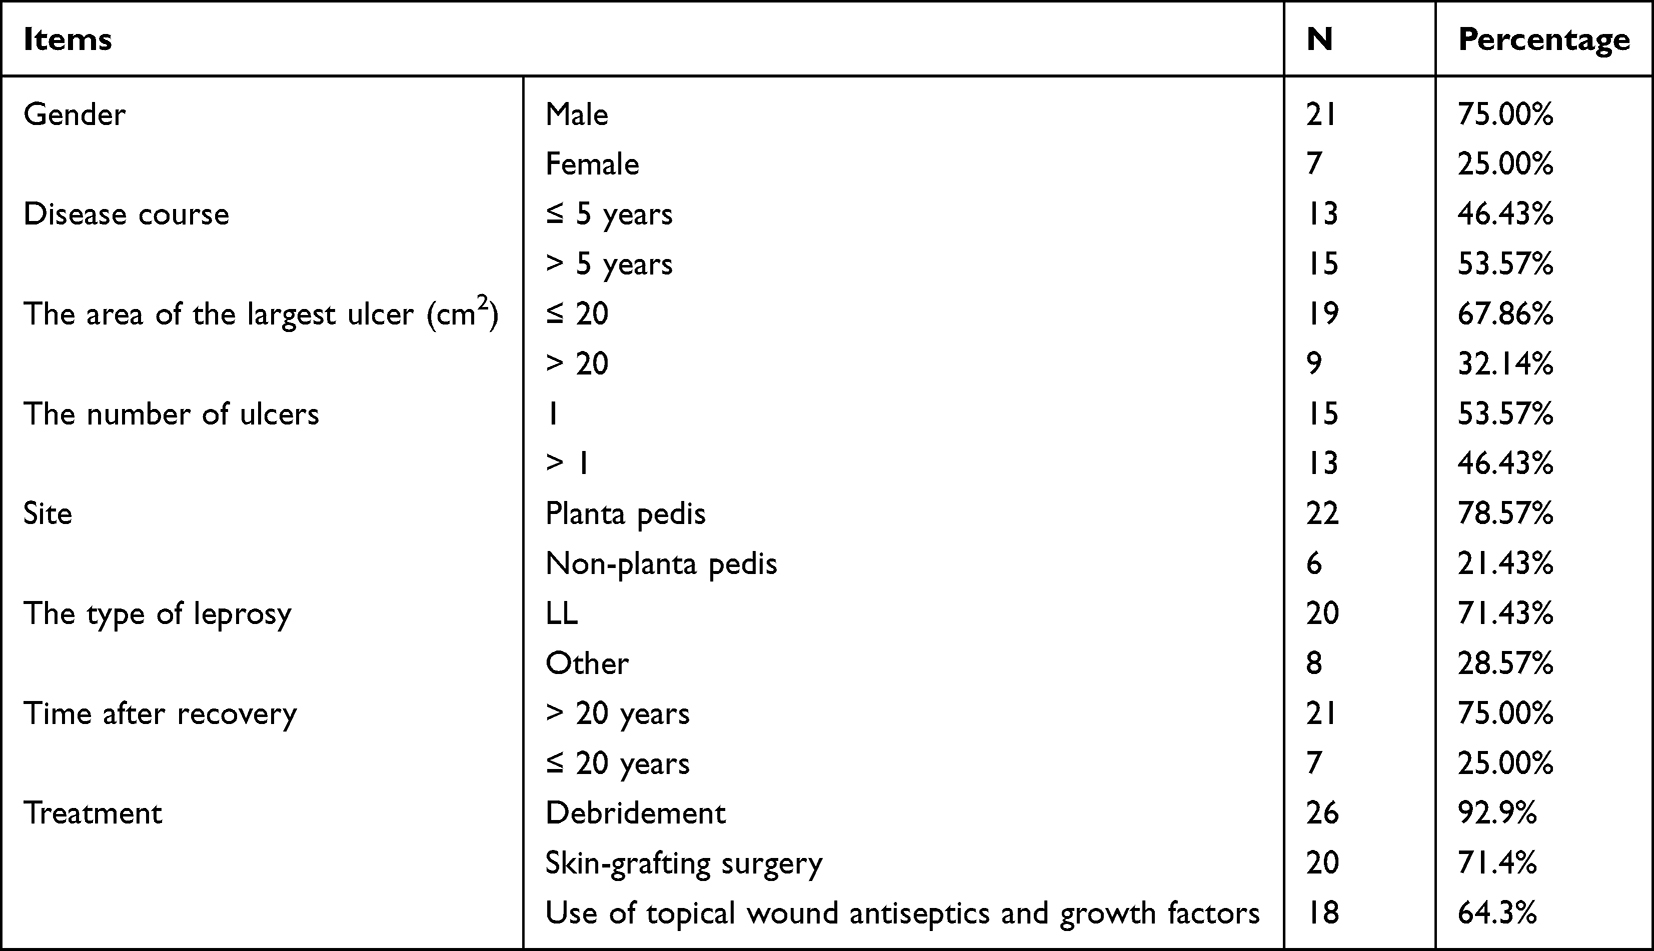 |
Table 1 The Basic Information of Patients |
Experimental Methods
Sampling
The samples were collected from participants without any topical medication within 12 h in a relatively clean room. Samplers wore sterile gloves and lab coats to avoid any form of cross-infection. A sterile swab moistened with normal saline was used to swab over the ulcer as well as the surrounding normal skin in an overturning motion, and the times of swab for both ulcer and normal skin was two. After sampling was completed, the swabs were placed in a sterile cryopreservation tube and stored at −80°C.
Isolation and Detection of DNA in Samples
Each swab was cut and vortexed in the collection tube. The swab sponge was pressed against the wall of the tube several times to ensure the transfer of bacteria from the swab to the solution. Subsequently, the swabs were subjected to two temperature shocks in a 90°C water bath, which lasted for 20 min. The cetyltrimethylammonium bromide method was utilized for the extraction of total microbiome DNA from samples of various sources. The quality of the extracted DNA was examined with agarose gel electrophoresis, and the DNA was quantified with an ultraviolet spectrophotometer. The concentration of DNA samples ranged from 0.4 to 32 ng/ul, and the quality of samples met the principle of Quality Control (QC) evaluation. The detailed DNA concentrations of every single sample in a Supplementary Table.
Polymerase Chain Reaction (PCR) Amplification and Product Purification
The V3 to V4 regions of the 16S rDNA gene were selected as amplification and sequencing fragments for PCR amplification. The primer sequences were: 341F (5’-CCTACGGGNGGCWGCAG-3’) and 805R (5’-GACTACHVGGGTATCTAATCC-3’).19 PCR products were confirmed with 2% agarose gel electrophoresis, purified with AMPure XT beads (Beckman Coulter Genomics, Danvers, MA, USA), and quantified with Qubit (Invitrogen, Carlsbad, California, USA).
Library Preparation, Machine Sequencing, and Data Processing
Purified PCR products were evaluated with an Agilent 2100 Bioanalyzer (Agilent, Palo Alto, CA, USA) and an Illumina library quantification kit (Kapa Biosciences, Woburn, MA, USA). The machine sequencing libraries were serially diluted, mixed in an appropriate ratio according to the amount required in sequencing, and denatured to single strands with NaOH for machine sequencing. Double-end sequencing of 2×250 bp was performed with a NovaSeq 6000 sequencer and the corresponding reagent NovaSeq 6000 SP. Length filtering and denoising were performed with DADA2 (qiime dada2 denoise-paired). Automatic Signature Verification (ASV) sequences and ASV abundance tables were obtained, and ASVs with a total sequence count of only 1 were removed.
Extraction of Metabolites
The swabs were taken out and equilibrated to room temperature. The solvent extraction method was used to prepare the samples for liquid chromatography–mass spectrometry (LC–MS) analysis. Each swab was transferred to a collection tube, added with methanol, fully vortexed and mixed at room temperature, and stood for 10 min to extract metabolites from the swabs. The extracts were placed at −20°C overnight and the proteins were precipitated. The samples were centrifuged at 4000 g for 20 min, and the supernatant was transferred to a 96-well plate. Equivalent 10 µL of diluent were collected from each sample and mixed to prepare quality control (QC) samples. All obtained metabolite samples were stored at −80°C and used for machine sequencing.
Statistical Analysis
Among the basic data of participants, numerical variables were summarized as mean ± standard deviation, and categorical variables were expressed as the rate or composition ratio. The R software (v 3.4.4) was used for statistical analysis and plotting. Differences in the microbiome were calculated with the analysis of similarity test, Wilcoxon rank sum test, and linear discriminant analysis Effect Size (LEfSe) analysis. The t-test was utilized for analyzing differences in specific species between groups. P < 0.05 was considered a statistically significant difference.
Regarding the metabolomic analysis, univariate analyses, including fold change analysis and t-test, were performed for Benjamini–Hochberg (BH) correction to obtain the q-value. The Variable Important for the Projection (VIP) values were identified with multivariate statistical analyses, such as Partial Least-Squares Discriminant Analysis (PLS-DA). These two values were utilized to screen for differentially expressed metabolic ions. The model parameters R2 and Q2 were also subjected to the permutation test, with the number of tests set as 200. Spearman correlation coefficient was used to assess the correlation between microorganisms and metabolites.
Results
Analysis Results of Microorganism Species on the Skin Surface
The ulcer samples and corresponded normal skin were collected from 28 participants, and the representative images were shown (Figure 1A). A total of 3981 ASVs were obtained after the raw data were denoised and filtered, and a Venn diagram was drawn based on the abundance table of the obtained ASVs (Figure 1B). The ulcer and normal skin groups had both shared and exclusive ASVs, indicating both homogeneity and heterogeneity of microbiota between ulcer and normal skin surfaces.
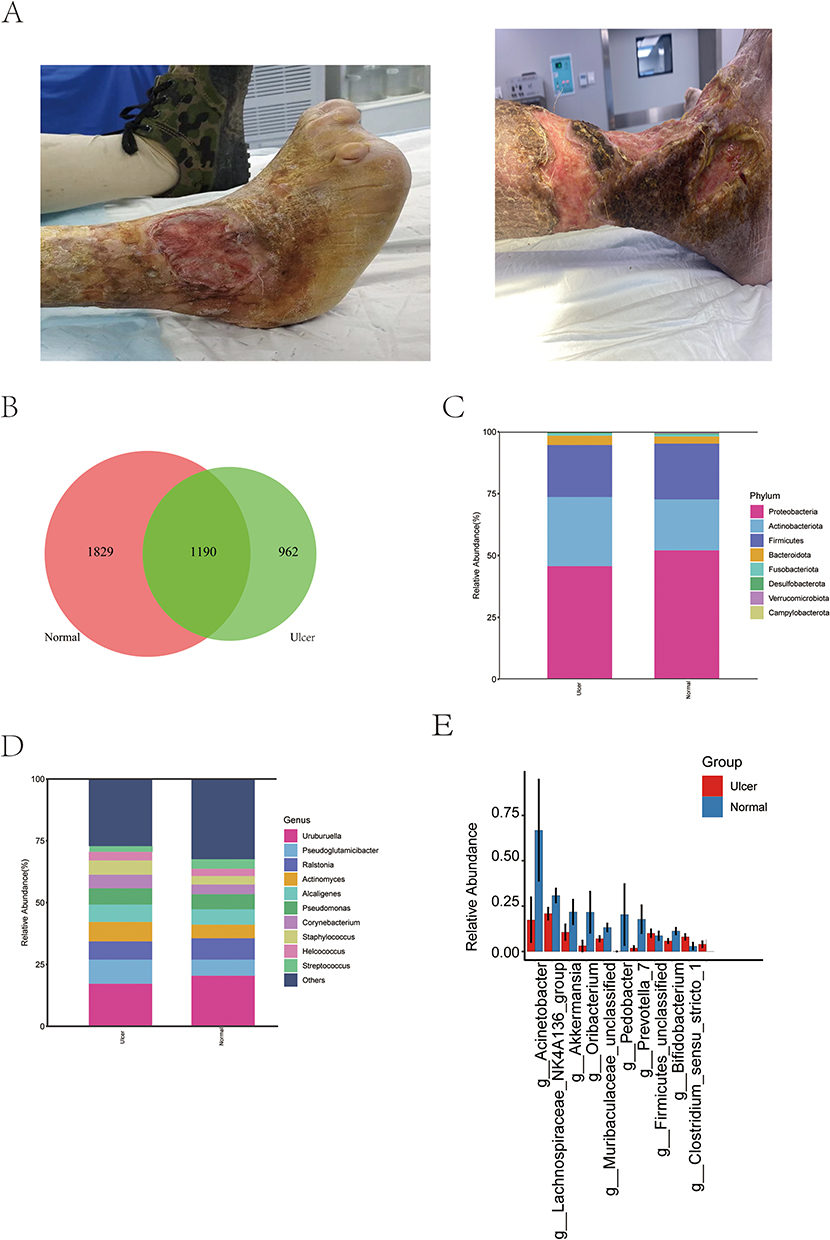 |
Figure 1 Species analysis. (A) The representative images of the ulcers of patients. (B) Venn diagram of the ASV feature of the ulcer and normal skin groups; (C) column stacking diagram of the distribution of major species at the phylum level; (D) column stacking diagram of the distribution of major species at the genus level; (E) Species with significant differences between groups at the genus level, showing the top 10 species in terms of degree of difference. |
To visualize the species composition and dominant strain profile, column stacking diagrams were used to show the species abundance in the samples at the phylum and genus levels (Figure 1C and D). At the phylum level, the main dominant species in both groups were Pseudomonadota, Bacillota, and Actinomycetota. The proportion of the main bacterial phyla was higher or lower in the normal skin and ulcer groups, without significant differences, consistent with the results of a previous study on the skin microbiome.20 At the genus level, the main dominant species in both groups were Uruburuella, Pseudoglutamicibacter, and Actinomyces, with higher or lower percentages in both groups. The differences in the microbiota between the ulcer and normal skin groups were further analyzed, followed by significance analysis. It was found that among the main differential genera at the genus level (Figure 1E), Prevotella and Bifidobacterium were significantly increased but Acinetobacter, Lachnospiraceae_NK4A136_group, Akkermansia, Oribacterium, Muribaculaceae_unclassified, Pedobacter, and Bacillota_unclassified were significantly decreased in the ulcer group.
Analysis Results of Microorganism Community Structure
Results of α-Diversity Analysis
Five indexes were utilized to characterize α-diversity (Figure 2A–E), and dilution curves were plotted. As the sequencing depth increased, the dilution curve tended to flatten out, indicating that the sequencing amount used in this study was sufficient to reflect the species in the samples. The results revealed a decrease in microorganism α-diversity (species richness, homogeneity, and sequencing depth) on ulcerated tissues compared to normal skin, without significant differences (observed species, Chao1, Shannon, Simpson, and Pielou’s evenness index; P > 0.05). This finding indicated that the species richness was slightly disturbed in ulcerated tissues.
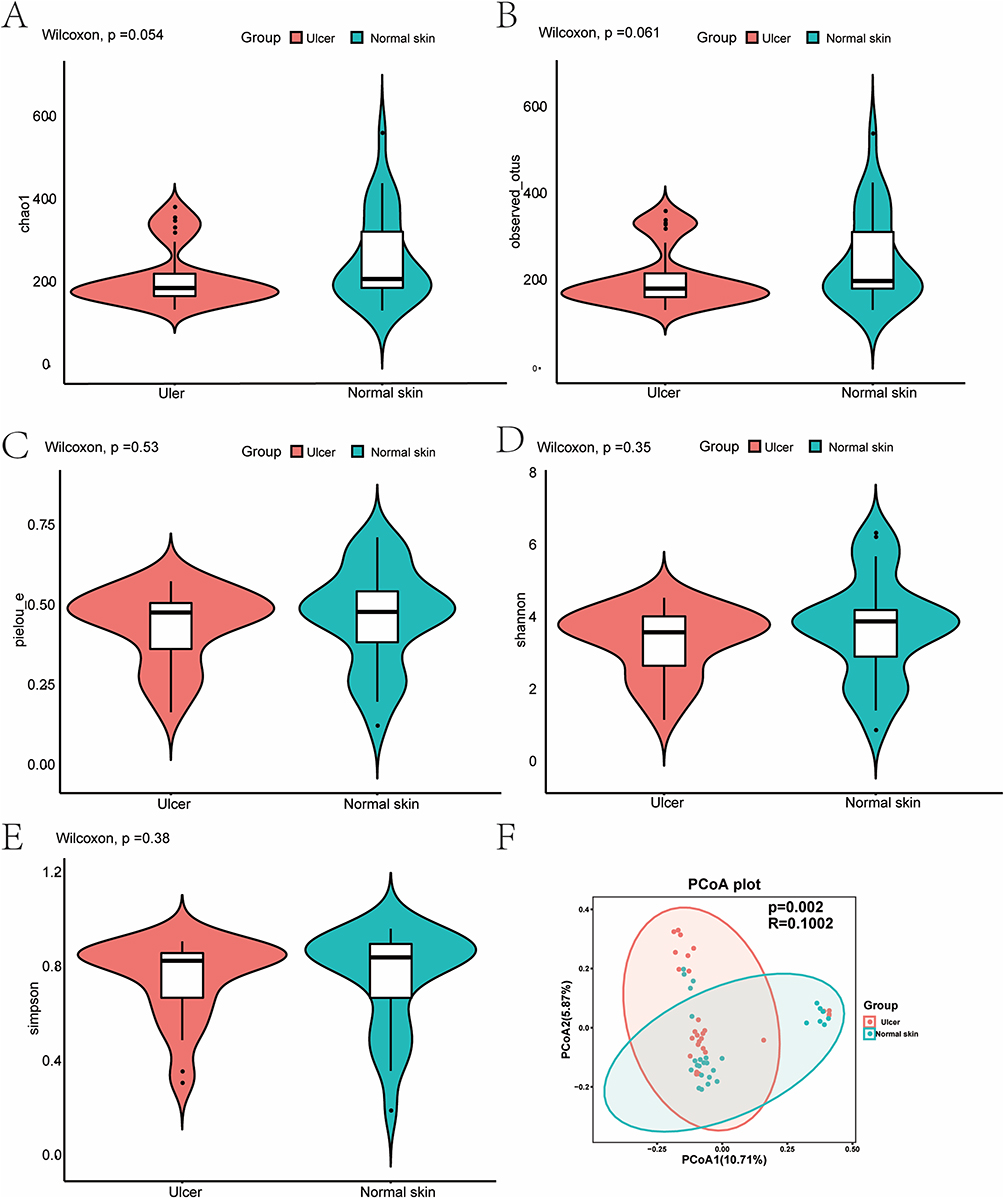 |
Figure 2 Microbiome diversity analysis. (A–E) Violin charts of α-diversity indexes. (A) Chao1 index; (B) Observed species; (C) Pielou’s evenness index; (D) Shannon index; (E) Simpson index; (F) PCoA plot of β-diversity calculated using the Jaccard distance method, indicating differences between the ulcer and normal skin groups. The horizontal and vertical axes are the two main coordinates with the greatest degree of interpretation. |
β-Diversity Analysis Results
The Jaccard distance was used to analyze β-diversity in the two groups, and the figure of the Principal Coordinate Analysis (PCoA) was drawn (Figure 2F). The two groups showed some degree of clustering of some samples, with significant differences (P < 0.05, P = 0.002, R = 0.1002). The number of discrete points remained high, indicating that the microbiota in the ulcer group changed only to some extent.
LEfSe Analysis Results of Differential Species Between the Two Groups
LEfSe analysis was performed on differential microbes between the two groups based on the Kruskal–Wallis rank sum test to explore biomarkers for leprosy-related ulcers. With the linear discriminant analysis (LDA) threshold set as 3.0, LDA scores greater than this threshold were considered statistically different. Cladogram (Figure 3A) and distribution histograms (Figure 3B) were plotted.
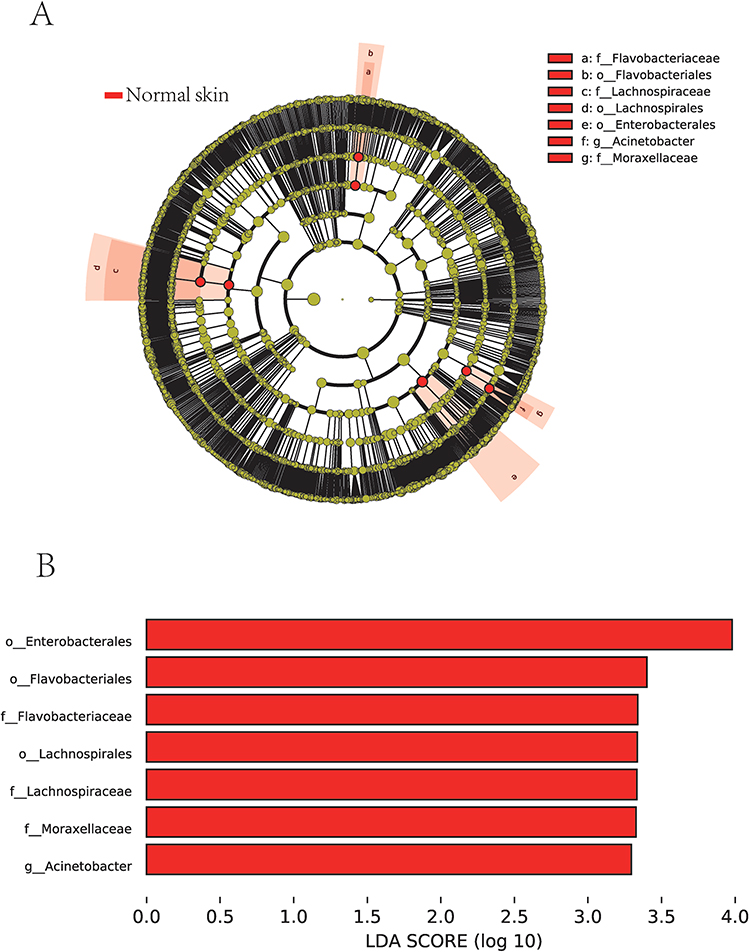 |
Figure 3 Linear discriminant analysis Effect Size (LEfSe) analysis. (A) A Cladogram, where nodes from inside to outside represented distribution levels of different species, and yellow nodes marked no significant differences; (B) A distribution diagram showing significantly different species with LDA scores greater than 3.0, where the greater the difference, the higher the score and the longer the bar; red nodes/bars indicated that the species was significantly different between the ulcer and normal skin groups and more abundant in the normal skin group. |
The microbes with significant differences between the ulcerated tissue and normal skin included Enterobacterales, Flavobacteriales, and Lachnospirales at the order level, Flavobacteriaceae, Lachnospiraceae, and Moraxellaceae at the family level, and Acinetobacter at the genus level. The abundance of all these microbes was reduced in the ulcer group, concordant with the decrease in α-diversity analyzed in the previous section.
Differential Analysis of the Metabolome
General Situation of the Metabolome
The principal component analysis displayed favorable clustering in the QC group, illustrating that the QC of this LC-MS analysis was satisfactory. Differential metabolites were subjected to univariate analyses including fold change analysis and t-test, and BH correction was performed to obtain the q-value. The results of the differential analysis were presented as a volcano plot (Figure 4A).
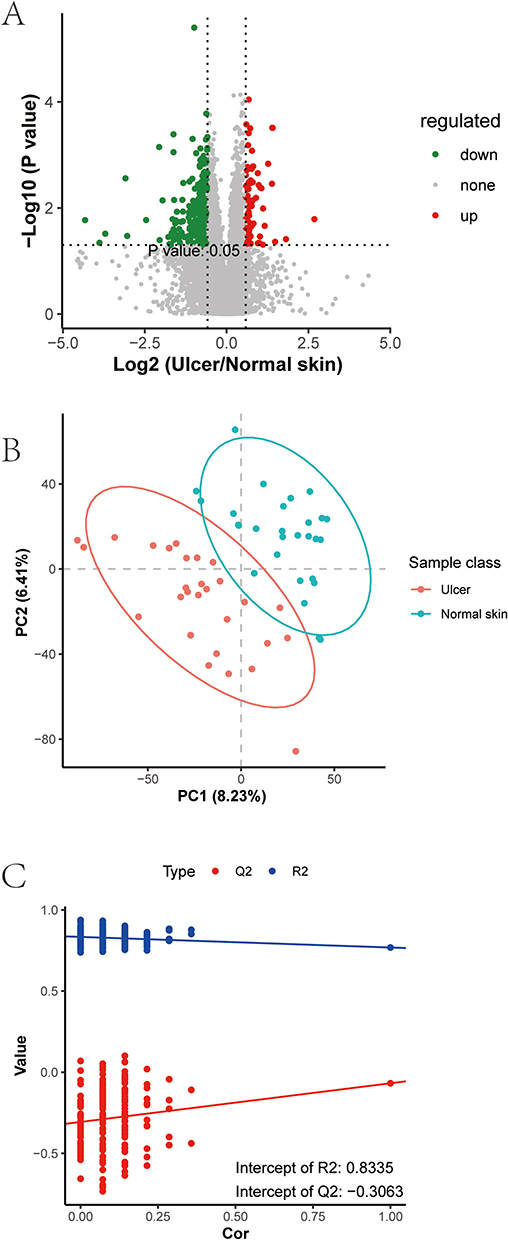 |
Figure 4 Differential analysis of the metabolome. (A) A volcano plot of differential metabolites. Each point represented a metabolite. Green indicated metabolites down-regulated in the ulcer group compared to the normal skin group, and red characterized up-regulated metabolites. The difference multiplicity of metabolite ions in the comparison groups was used as the horizontal coordinate, and -log10 (q-value) as the vertical coordinate; (B) A PLS-DA score plot; (C) Permutation test results. |
VIP values were calculated to measure the influencing strength and explanatory power of expression pattern of each metabolite for the classification and discrimination of samples in each group. Next, the PLS-DA model of the ulcer and normal skin groups was constructed with VIP ≥ 1.0 as the screening criterion (Figure 4B), and the obtained R2 and Q2 values were relatively high, illustrating that the model was relatively reliable. The model was free of overfitting as determined by the permutation test (Figure 4C), suggesting that the model had an excellent predictive effect and could be used for adjuvant metabolite screening.
Differential Metabolites
Differentially expressed metabolic ions were screened with the VIP values obtained from the multivariate statistical analysis PLS-DA and the results of the fold change analysis: ratio ≥ 1.5 or ratio <= 1/1.5 and P value < 0.05 in the fold change analysis; VIP ≥ 1 in the PLS-DA model.
Based on the above screening criteria, the metabolites with significant differences between the two groups were lysophosphatidylcholine, lysophosphatidylinositol, HemiBMP, triglycerides, adenosine, leucine, 3-(2-furanyl)-2-propenal, phenylalanine, pyroglutamic acid (PCA), arginine, urocanic acid (UCA), tetraethylene glycol, artemisinin, phosphatidic acid, 10-peroxy-docosahexaenoic acid, alanylhistidine, uridine, 3-(2 furanyl)-2-methyl-2-propenal, and 9-(4-hydroxyphenyl)-2-methoxy-1H-naphthalenylidene-1-one. The differential metabolites were specifically presented in a heat map (Figure 5A).
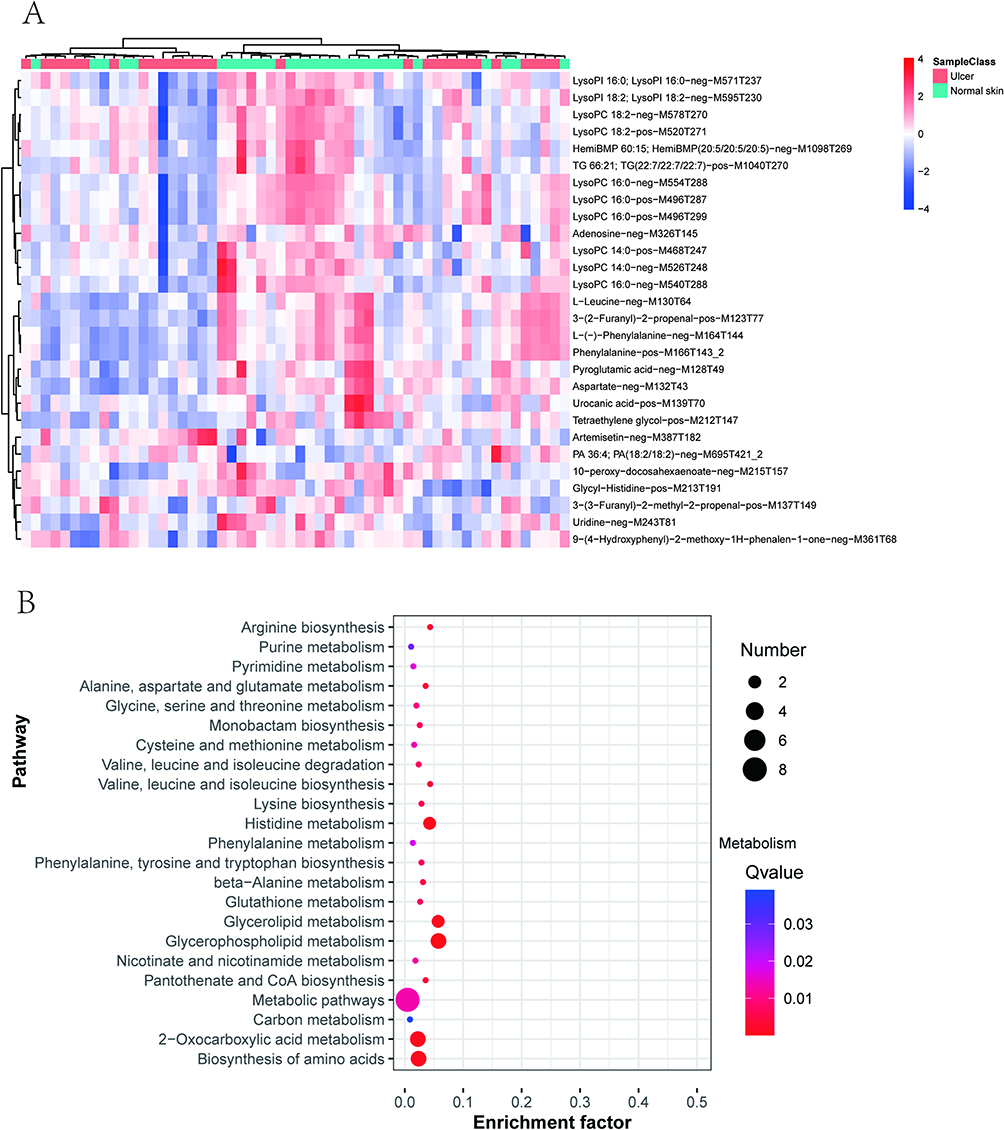 |
Figure 5 Major differential metabolites and enrichment analysis. (A) The heat map of differential metabolites; (B) The bubble map of KEGG of differential metabolites; Enrichment Factor indicated the number of differential metabolites located in this KEGG/total metabolites located in this KEGG. The smaller the q-value, the higher the KEGG enrichment. The larger the bubble, the higher the number of differential metabolites involved in this pathway. |
Analysis Results of Differential Metabolic Pathways
To further analyze the possible functional bias induced by these differential metabolites, a pathway enrichment analysis was performed based on the Kyoto Encyclopedia of Genes and Genomes (KEGG) database, and the results were presented as a bubble plot (Figure 5B). As the results exhibited, the differential metabolic pathways mainly included glycerophospholipid metabolism, glycerolipid metabolism, histidine metabolism, arginine metabolism, biosynthesis and degradation of leucine, isoleucine, and valine, metabolism of alanine, aspartate, and glutamate, monobactam biosynthesis, metabolism of glycine, serine, and threonine, cysteine and methionine metabolism, glutathione biosynthesis, amino acid biosynthesis, and pyrimidine and purine metabolism.
In conclusion, amino acid and lipid metabolism on the surface of ulcers differ from those on the surface of normal skin.
Correlation Analysis Results of Microorganisms and Metabolome on the Skin Surface
To further characterize the influence of the skin microbiota on the skin metabolome, correlations between microorganisms and metabolites were analyzed with Spearman correlation coefficients and presented as a clustering heat map (Figure 6A). The results demonstrated a strong correlation between the skin metabolome and the skin microbiome. For example, both Lachnospirales and Muribaculaceae were positively correlated with amino acids and phospholipids. Then, a network diagram was drawn to further identify the key metabolites and microbiota in the complex regulatory network (Figure 6B). The results revealed that Succiniclasticum, Lachnospira, Terrisporobacter, and Succinogenes were the key microorganisms associated with relatively abundant metabolites. Phenylalanine and lysophosphatidic acid were the metabolites associated with relatively abundant differential microorganisms.
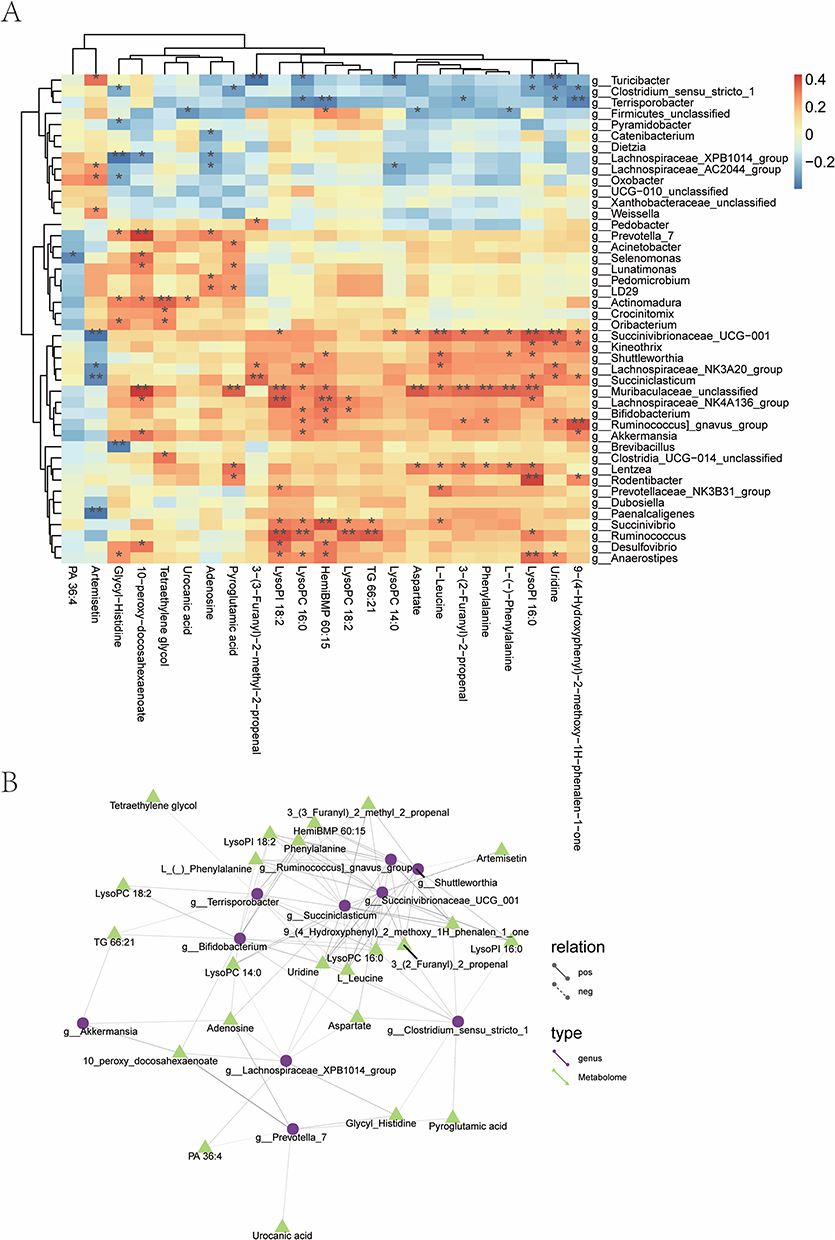 |
Figure 6 Correlation analysis between metabolome and microbiome. (A) A heat map of correlation analysis between metabolome and microbiome. *P < 0.05, **P < 0.01. The columns indicated microbial genera, and the rows represented differential metabolites. The darker the color, the stronger the correlation; (B) A network diagram between metabolome and microbiome. Different nodes in the diagram marked different microbiota or metabolites. The shape of microbiota is circular, and the shape of metabolites is triangular. The lines connecting the microbiota and metabolites represented correlation between them, where the solid line stood for positive correlation and the dashed line suggested negative correlation. |
Discussion
In this study, high-throughput sequencing and non-targeted LS-MS were used to analyze the microbiome and metabolome of the lower-limb ulcers and unaffected normal skin of participants with leprosy sequelae. The sequencing results unveiled a decrease in the homogeneity and abundance of skin microorganisms on the ulcers and certain differences in the structure of the microbiota between ulcerated tissue and normal skin in participants with lower-limb ulcers caused by leprosy. In addition, the abundance of Flavobacteriales, Lachnospirales, and Acinetobacter was markedly reduced in the ulcers. Metabolomic profiling revealed relevant metabolic regulation, which primarily involved the metabolism of glycerides, glycerophospholipids, and amino acids. Our integrative analysis elucidated possible functional associations between microorganisms and metabolome in lower-limb ulcers of participants with leprosy sequelae. Furthermore, it was observed that Lachnospirales might influence the recovery of skin lesions by regulating amino acid and glycerophospholipid metabolism and exerting immunomodulatory effects.
It has been considered that leprosy was virtually eliminated around 2000. Nevertheless, the World Health Organization reported that there still were 133802 new cases worldwide in 2021, suggesting the need to study mechanisms underlying leprosy.13 Bayal et al conducted a study on the microbiome on the surface of skin lesions in Indian patients with leprosy. The results unraveled a substantial increase in Methylobacterium and Pseudomonas and a significant decrease in Staphylococcus in the lesioned skin of patients compared to the healthy population, as well as no significant difference in the microbiological composition between the lesions and unaffected skin of patients.13 In a similar study conducted in Brazil, Silva et al observed that the abundance of Bacillota decreased and Pseudomonadota was enriched in the skin of patients, accompanied by no single dominant taxon found at a lower classification level, a substantial reduction in Staphylococcus and Streptococcus, the enrichment of Brevundimonas, and overrepresentation of Micrococcus.12
Of note, inconsistencies were observed between the microbiome changes obtained in this study and the results of these two studies, such as no significant changes in Staphylococcus in our study. This difference can be explained by four factors. First, the microbiome on the surface of the lesions of patients with leprosy varies from region to region due to the local environment or treatment strategy. Second, the control groups in the above two studies were healthy populations rather than the normal skin from the selected patients, suggesting that normal healthy populations can be included as the control in subsequent studies for further validation. Third, our study included participants with leprosy who had been cured and developed lower-limb ulcers, whereas the above two studies included patients with leprosy who were not been clinically cured. Fourth, the samples of our study were collected from ulcers, whilst the samples of the above two studies were obtained from skin lesions (including erythema and nodules caused by leprosy).
Among metabolomic studies on patients with leprosy, one analyzed patient with episodes of leprosy reactions and determined the urinary metabolomics of patients at various stages of the disease course. The results unraveled that the urinary metabolome could be used to distinguish between endemic controls and untreated patients with mycobacteriosis. Additionally, the urinary metabolic profile of patients who developed reversal reactions (RR; leprosy reaction) significantly changed after the diagnosis of RR compared to that before the onset of RR.15 Al-Mubarak et al studied the serum metabolites in patients with leprosy and observed that arachidonic acid, eicosapentaenoic acid, and docosahexaenoic acid were elevated in the serum of patients with leprosy. Eicosapentaenoic acid and docosahexaenoic acid have anti-inflammatory effects, whereas arachidonic acid exerts both pro- and anti-inflammatory effects. In patients with a high bacteriological index, the level of several lipids was enhanced, which might be related to biological pathways involved in immune regulation during leprosy.14 In contrast, our study reported a decrease in docosahexaenoic acid on the surface of ulcers. This result suggests that metabolomes are highly specific and cannot be compared among samples of different sources, but polyunsaturated fatty acid can obviously affect immunomodulation in leprosy.
The present study elucidated a marked reduction in the abundance of microbiota on the surface of ulcers. In a longitudinal study of microorganisms associated with diabetic foot ulcers, the 16S rRNA sequencing results of wounds displayed that the destabilization of the bacterial community was associated with faster healing and more positive clinical outcomes. This observation is counterintuitive because many studies of other parts of the body have demonstrated that diseases are associated with the instability of the bacterial community. However, in patients with wounds, microorganism instability may contribute to the effective clearance of bacteria in the wound by the immune system.21 According to this theory, the decrease in the abundance of microbiota on the ulcer surface may be one of the reasons for the impaired healing of leprosy-induced ulcers.
Symbiotic microorganisms in the skin can play a role in wound healing at all levels. For example, Staphylococcus aureus can induce the production of Th17 cells, which facilitates the repair of sensory neurons through IL-17A.22 Additionally, during epidermal injury, the skin microbiota moves from the epithelial surface to the dermis of the injured skin. In skin wounds, neutrophils accumulate around clusters of Gram-positive bacteria near the wound surface, triggering type I interferon responses and thus promoting wound healing.23 In addition, Staphylococcus can promote hair follicle regeneration by competing with host cells for oxygen and activating HIF-1α signaling and glutamine metabolism in keratinocytes.23 However, most of the existing related studies focus on Gram-positive bacteria, especially Staphylococcus aureus. Intriguingly, the differential microorganisms identified in this study were mainly Gram-negative bacteria whose interaction with skin is relatively barely studied.
Among the key microorganisms identified by the LEfSe analysis in our study, Flavobacteriaceae are found on the skin surface of healthy humans, but its exact function is unknown.24 Although Flavobacteriaceae is a conditionally pathogenic bacterium, it may also act as a probiotic in the intestinal microbiota. For instance, a certain type of Flavobacteriaceae can alleviate atherosclerosis.25 Additionally, Flavobacteriaceae is a potential ancestral source of the tigecycline resistance gene tet(X) which can be transferred between Acinetobacter and Enterobacteriaceae.26 Enterobacterales are pathogenic bacteria capable of causing skin infections. Lachnospiraceae are beneficial in the intestine, but their role in the skin microbiota has not yet been characterized. A prior study identified Lachnospiraceae in mouse skin and showed that topical exposure to antibiotics reduced the colonization of competing strains of Staphylococcus such as Lachnospiraceae in mouse skin.24 Previous research demonstrated that the colonization of Moraxellaceae was elevated on the skin surface of patients with psoriasis, indicating that Moraxellaceae is associated with the pathophysiological state of the skin.27 Acinetobacter in the skin microbiota protects against allergy and inflammation. A former study revealed that in healthy participants, the relative abundance of Acinetobacter species was associated with the expression of anti-inflammatory molecules in peripheral blood mononuclear cells, whilst this association was lost in patients with atopic dermatitis.28
The research by Chung et al unveiled that Akkermansia, a well-known biomarker of healthy intestinal microbiota, was strongly positively correlated with Lachnospiraceae, such as NK4A136, Parasutterella, Bifidobacterium, and unclassified Lachnospiraceae and that this cluster was associated with the ecological balance of the intestinal microbiota after chemotherapy. Another study exhibited that clusters consisting of some members of Turicibacter and Muribaculaceae were associated with ecological disorders.29 The microbiota mentioned in this study overlapped with those identified in our study, such as Lachnospiraceae including NK4A136, Bifidobacterium, Akkermansia, and Muribaculaceae, which significantly changed on the ulcer surface in our study. This finding illustrates complex supportive or antagonistic interactions among these microorganisms and that microbiome studies need to be conducted by focusing on the correlations between microorganisms (holistic view) rather than a single microorganism.
In chronically infected wounds, many bacteria form biofilms that attach to the wound surface, grow, and produce hard-to-remove extracellular polymers that repress wound healing. Microorganisms may be pathogenic by collaborating or influencing the virulence of other microbes through competition and other methods, therefore significantly affecting the severity and progression of wound infections. The differential microorganisms identified in our study were not common pathogenic bacteria and might influence wound healing through their interactions.30 M. leprae-infected cells exhibit increased glucose uptake, accompanied by the production of nicotinamide adenine dinucleotide phosphate sodium salt via the pentose phosphate pathway and metabolic changes such as downregulation of mitochondrial activity,5 indicating that leprosy is accompanied by changes in host cell metabolism. Metabolites on the skin surface are present from a variety of sources, including metabolites from sweat, metabolites from sebum, decomposition products of fibroin in the stratum corneum, and substances from the decomposition of these host-produced metabolites by microorganisms on the skin surface. Therefore, transcriptomics and further analysis are required to further confirm whether the metabolite originates from host metabolism or microorganism metabolism.31 As a result, the use of high-throughput 16S rDNA sequencing combined with metabolomics is more beneficial for elucidating the possible functional bias caused by changes in the symbiotic microbiota.
Among the differential metabolites obtained from the ulcer group in this study, UCA and PCA were lowly expressed, both of which are the decomposition products of filamentous proteins and the components of the natural moisturizing factor in the stratum corneum and also act as cosmetic additives to increase the surface hydrophilicity of the skin. A prior study elaborated that Peanut allergy was associated with reduced cis-UCA and PCA levels in the skin.32 Both allantoic acid and PCA were substantially decreased on the surface of ulcers, which characterized lesions similar to other skin diseases. In addition, PCA has been reported to have immunomodulatory functions.33
Abnormal metabolism of glycerophospholipids has long been reported in other dermatological and infectious diseases. Zeng et al found that glycerophospholipid metabolites, such as lysophosphatidic acid, lysophosphatidylcholine, phosphatidic acid, phosphatidylinositol, and phosphatidylcholine, were significantly altered in the plasma of patients with psoriasis.34 Another study unveiled that in patients with coronavirus disease-19, glycerophospholipid metabolism was activated, which repressed the effect of cortisone.35
In our study, Lachnospiraceae exhibited significant differences in its abundance between the two groups and was also identified as a key strain by the LEfSe analysis. Moreover, this strain was also associated with multiple metabolites in the microbiome and metabolome network maps. In a study by Zhang et al, Rg and Bp, bacteria in the Lachnospiraceae family, acted as tumor suppressors and might contribute to the activation of the immune system, which declined the level of glycerophospholipids. This result illustrates that Rg and Bp alter the tumor metabolic microenvironment by decreasing glycerophospholipid levels. As reported, Rg and Bp are responsible for the rapid degradation of lysoglycerophospholipids (LysoPA [0:0/18:1], LysoPC [17:0], and LysoPC [18:0]).36 The role of Lachnospiraceae in regulating metabolism is also similar to the findings of our study.
Dermal adipocytes may promote macrophage infiltration and accelerate angiogenesis by releasing free fatty acids to facilitate skin wound healing. Therefore, differences in lipid metabolites between ulcers and normal skin may influence ulcer healing through these pathways.37 Infection and pro-inflammatory immune cell infiltration on the ulcer surface are pivotal influencing factors for the development and maintenance of chronic wounds. Accordingly, reduced anti-inflammatory metabolites and related metabolic dysregulation may modulate the alternative activation of inflammatory macrophages, thereby leading to disunion in wounds. Additionally, arginine and glutamate metabolism, which can produce collagen, are required for wound healing. In our study, all of these metabolites on the ulcer surface substantially changed as compared to those on the normal skin surface, potentially affecting wound healing.38
The metabolome and microbiome are necessarily the result of certain factors. However, this “outcome” in turn feeds back into disease progression. To further identify causality, more experimental designs are needed for the generation of scientific conclusions. In addition, more information can be mined in subsequent studies by including more patient data and comparing the patient data between groups according to disease duration, ulcer location, and other subgroups. For example, we only collected samples from the lower lamb, but the distribution of ulcer could also be through arms, and so on.39 As the environment of different types of skins could be significantly varied in the metabolome and microbiome, the further study involved in a larger population of patients with different ulcer distributions is necessary, and might open the new windows in leprosy researches.
Conclusion
This study provides potential data support for viable skin microbiome transplantation for leprosy. In addition, the integrative analysis of metabolome and microbiome provides new insights into the mechanism of lower-limb ulcers caused by leprosy and information on markers that can be used to monitor disease progression.
Data Sharing Statement
The data that support the findings of this study are available from the corresponding author upon reasonable request.
Ethics Approval and Consent to Participate
This study was designed in accordance with the Declaration of Helsinki and approved by the ethics committee of Zhejiang Province Dermatology Hospital (approval number: 2022-004K). Informed consent was obtained from all participants involved in the study.
Acknowledgment
We would like to acknowledge the reviewers for their helpful comments on this paper.
Author Contributions
- Made a significant contribution to the work reported, whether that is in the conception, study design, execution, acquisition of data, analysis and interpretation, or in all these areas: Jian Wang, Ben Wang, Chao Liang, Caifei Jin, Huiliang Shen.
- Have drafted or written, or substantially revised or critically reviewed the article: Jian Wang, Ben Wang, Chao Liang, Caifei Jin, Huiliang Shen.
- Have agreed on the journal to which the article will be submitted: Jian Wang, Ben Wang, Chao Liang, Caifei Jin, Huiliang Shen.
- Reviewed and agreed on all versions of the article before submission, during revision, the final version accepted for publication, and any significant changes introduced at the proofing stage: Jian Wang, Ben Wang, Chao Liang, Caifei Jin, Huiliang Shen.
- Agree to take responsibility and be accountable for the contents of the article: Jian Wang, Ben Wang, Chao Liang, Caifei Jin, Huiliang Shen.
Funding
This work was supported by the Zhejiang Health Technology plan [grant numbers 2022KY732].
Disclosure
The authors report no conflicts of interest in this work.
References
1. Reed GB. Dissociation of Mycobacterium leprae. J Bacteriol. 1932;24(5):357–379. doi:10.1128/jb.24.5.357-379.1932
2. Han XY, Seo YH, Sizer KC, et al. A new Mycobacterium species causing diffuse lepromatous leprosy. Am J Clin Pathol. 2008;130(6):856–864. doi:10.1309/ajcpp72fjzzrrvmm
3. Ploemacher T, Faber WR, Menke H, Rutten V, Pieters T. Reservoirs and transmission routes of leprosy; A systematic review. PLoS Negl Trop Dis. 2020;14(4):e0008276. doi:10.1371/journal.pntd.0008276
4. Jacobson RR, Krahenbuhl JL. Leprosy. Lancet. 1999;353(9153):655–660. doi:10.1016/S0140-6736(98)06322-3
5. Toledo Pinto TG, Batista-Silva LR, Medeiros RCA, Lara FA, Moraes MO. Type I interferons, autophagy and host metabolism in leprosy. Front Immunol. 2018;9:806. doi:10.3389/fimmu.2018.00806
6. White C, Franco-Paredes C. Leprosy in the 21st century. Clin Microbiol Rev. 2015;28(1):80–94. doi:10.1128/cmr.00079-13
7. Degang Y, Akama T, Hara T, et al. Clofazimine modulates the expression of lipid metabolism proteins in Mycobacterium leprae-infected macrophages. PLoS Negl Trop Dis. 2012;6(12):e1936. doi:10.1371/journal.pntd.0001936
8. Upputuri B, Srikantam A, Mamidi RS. Comorbidities associated with non- healing of plantar ulcers in leprosy patients. PLoS Negl Trop Dis. 2020;14(6):e0008393. doi:10.1371/journal.pntd.0008393
9. Chauhan S, D’Cruz S, Mohan H, Singh R, Ram J, Sachdev A. Type II lepra reaction: an unusual presentation. Dermatol Online J. 2006;12(1):18. doi:10.5070/D3448655C6
10. Lockwood DNJ. Chronic aspects of leprosy-neglected but important. Trans R Soc Trop Med Hyg. 2019;113(12):813–817. doi:10.1093/trstmh/try131
11. Miyashiro D, Cardona C, Valente NYS, Avancini J, Benard G, Trindade MAB. Ulcers in leprosy patients, an unrecognized clinical manifestation: a report of 8 cases. BMC Infect Dis. 2019;19(1):1013. doi:10.1186/s12879-019-4639-2
12. Silva PES, Reis MP, Avila MP, et al. Insights into the skin microbiome dynamics of leprosy patients during multi-drug therapy and in healthy individuals from Brazil. Sci Rep. 2018;8(1):8783. doi:10.1038/s41598-018-27074-0
13. Bayal N, Nagpal S, Haque MM, et al. 16S rDNA based skin microbiome data of healthy individuals and leprosy patients from India. Sci Data. 2019;6(1):225. doi:10.1038/s41597-019-0232-1
14. Al-Mubarak R, Vander Heiden J, Broeckling CD, Balagon M, Brennan PJ, Vissa VD. Serum metabolomics reveals higher levels of polyunsaturated fatty acids in lepromatous leprosy: potential markers for susceptibility and pathogenesis. PLoS Negl Trop Dis. 2011;5(9):e1303. doi:10.1371/journal.pntd.0001303
15. Mayboroda OA, van Hooij A, Derks R, et al. Exploratory urinary metabolomics of type 1 leprosy reactions. Int J Infect Dis Apr. 2016;45:46–52. doi:10.1016/j.ijid.2016.02.012
16. Amaral JJ, Antunes LC, de Macedo CS, et al. Metabonomics reveals drastic changes in anti-inflammatory/pro-resolving polyunsaturated fatty acids-derived lipid mediators in leprosy disease. PLoS Negl Trop Dis. 2013;7(8):e2381. doi:10.1371/journal.pntd.0002381
17. Montezuma T, Vernal S, Andrade EN, Brandao JG, de Oliveira GLA, Gomes CM. Effectiveness and safety of multidrug therapy containing clofazimine for paucibacillary leprosy and clarithromycin for rifampicin-resistant leprosy: a systematic review and meta-analysis. Front Med Lausanne. 2023;10:1139304. doi:10.3389/fmed.2023.1139304
18. Serrano-Coll H, Cardona-Castro N. Neuropathic ulcers in leprosy: clinical features, diagnosis and treatment. J Wound Care. 2022;31(Sup6):S32–S40. doi:10.12968/jowc.2022.31.Sup6.S32
19. Herlemann DP, Labrenz M, Jürgens K, Bertilsson S, Waniek JJ, Andersson AF. Transitions in bacterial communities along the 2000 km salinity gradient of the baltic sea. Isme j. 2011;5(10):1571–1579. doi:10.1038/ismej.2011.41
20. Byrd AL, Belkaid Y, Segre JA. The human skin microbiome. Nat Rev Microbiol. 2018;16(3):143–155. doi:10.1038/nrmicro.2017.157
21. Loesche M, Gardner SE, Kalan L, et al. Temporal stability in chronic wound microbiota is associated with poor healing. J Invest Dermatol. 2017;137(1):237–244. doi:10.1016/j.jid.2016.08.009
22. Enamorado M, Kulalert W, Han SJ, et al. Immunity to the microbiota promotes sensory neuron regeneration. Cell. 2023;186(3):e17607–620e17. doi:10.1016/j.cell.2022.12.037
23. Di Domizio J, Belkhodja C, Chenuet P, et al. The commensal skin microbiota triggers type I IFN-dependent innate repair responses in injured skin. Nat Immunol. 2020;21(9):1034–1045. doi:10.1038/s41590-020-0721-6
24. SanMiguel AJ, Meisel JS, Horwinski J, Zheng Q, Grice EA. Topical antimicrobial treatments can elicit shifts to resident skin bacterial communities and reduce colonization by staphylococcus aureus competitors. Antimicrob Agents Chemother. 2017;61(9):17. doi:10.1128/AAC
25. Luo S, Zhao Y, Zhu S, et al. Flavonifractor plautii protects against elevated arterial stiffness. Circ Res. 2023;132(2):167–181. doi:10.1161/CIRCRESAHA.122.321975
26. Zhang R, Dong N, Shen Z, et al. Epidemiological and phylogenetic analysis reveals Flavobacteriaceae as potential ancestral source of tigecycline resistance gene tet(X). Nat Commun. 2020;11(1):4648. doi:10.1038/s41467-020-18475-9
27. Drago L, De Grandi R, Altomare G, Pigatto P, Rossi O, Toscano M. Skin microbiota of first cousins affected by psoriasis and atopic dermatitis. Clin Mol Allergy. 2016;14:2. doi:10.1186/s12948-016-0038-z
28. Fyhrquist N, Ruokolainen L, Suomalainen A, et al. Acinetobacter species in the skin microbiota protect against allergic sensitization and inflammation. J Allergy Clin Immunol. 2014;134(6):e111301–1309e11. doi:10.1016/j.jaci.2014.07.059
29. Chung Y, Ryu Y, An BC, et al. A synthetic probiotic engineered for colorectal cancer therapy modulates gut microbiota. Microbiome. 2021;9(1):122. doi:10.1186/s40168-021-01071-4
30. Liu C, Ponsero AJ, Armstrong DG, Lipsky BA, Hurwitz BL. The dynamic wound microbiome. BMC Med. 2020;18(1):358. doi:10.1186/s12916-020-01820-6
31. Elpa DP, Chiu HY, Wu SP, Urban PL. Skin metabolomics. Trends Endocrinol Metab. 2021;32(2):66–75. doi:10.1016/j.tem.2020.11.009
32. Berdyshev E, Goleva E, Bronova I, et al. Unique skin abnormality in patients with peanut allergy but no atopic dermatitis. J Allergy Clin Immunol. 2021;147(1):361–367 e1. doi:10.1016/j.jaci.2020.06.015
33. Bajaj I, Singhal R. Poly (glutamic acid)--an emerging biopolymer of commercial interest. Bioresour Technol. 2011;102(10):5551–5561. doi:10.1016/j.biortech.2011.02.047
34. Zeng C, Wen B, Hou G, et al. Lipidomics profiling reveals the role of glycerophospholipid metabolism in psoriasis. Gigascience. 2017;6(10):1–11. doi:10.1093/gigascience/gix087
35. Paul T, Ledderose S, Bartsch H, et al. Adrenal tropism of SARS-CoV-2 and adrenal findings in a post-mortem case series of patients with severe fatal COVID-19. Nat Commun. 2022;13(1):1589. doi:10.1038/s41467-022-29145-3
36. Zhang X, Yu D, Wu D, et al. Tissue-resident Lachnospiraceae family bacteria protect against colorectal carcinogenesis by promoting tumor immune surveillance. Cell Host Microbe. 2023;31(3):418–432 e8. doi:10.1016/j.chom.2023.01.013
37. Shook BA, Wasko RR, Mano O, et al. Dermal adipocyte lipolysis and myofibroblast conversion are required for efficient skin repair. Cell Stem Cell. 2020;26(6):880–895 e6. doi:10.1016/j.stem.2020.03.013
38. Eming SA, Murray PJ, Pearce EJ. Metabolic orchestration of the wound healing response. Cell Metab. 2021;33(9):1726–1743. doi:10.1016/j.cmet.2021.07.017
39. Supekar BB, Soni R, Bhushan R, Mukhi JI, Singh RP, Bhat D. Uncommon presentation of leprosy: a report of two cases. Indian J Dermatol. 2023;68(3):313–317. doi:10.4103/ijd.IJD_671_20
 © 2023 The Author(s). This work is published and licensed by Dove Medical Press Limited. The
full terms of this license are available at https://www.dovepress.com/terms
and incorporate the Creative Commons Attribution
- Non Commercial (unported, 3.0) License.
By accessing the work you hereby accept the Terms. Non-commercial uses of the work are permitted
without any further permission from Dove Medical Press Limited, provided the work is properly
attributed. For permission for commercial use of this work, please see paragraphs 4.2 and 5 of our Terms.
© 2023 The Author(s). This work is published and licensed by Dove Medical Press Limited. The
full terms of this license are available at https://www.dovepress.com/terms
and incorporate the Creative Commons Attribution
- Non Commercial (unported, 3.0) License.
By accessing the work you hereby accept the Terms. Non-commercial uses of the work are permitted
without any further permission from Dove Medical Press Limited, provided the work is properly
attributed. For permission for commercial use of this work, please see paragraphs 4.2 and 5 of our Terms.