Back to Journals » Risk Management and Healthcare Policy » Volume 14
Analysis of Food System Topics from the Consumers’ Perspective in a Developing Country Context: Key Insights from ANRS Metropolitan Cities, Ethiopia
Authors Mengesha ST ![]()
Received 17 May 2021
Accepted for publication 4 September 2021
Published 15 September 2021 Volume 2021:14 Pages 3883—3891
DOI https://doi.org/10.2147/RMHP.S318858
Checked for plagiarism Yes
Review by Single anonymous peer review
Peer reviewer comments 2
Editor who approved publication: Dr Jongwha Chang
Seyoum Teffera Mengesha
Department of Economics, College of Business and Economics, Bahir Dar University, Bahir Dar, Ethiopia
Correspondence: Seyoum Teffera Mengesha
Department of Economics, College of Business and Economics, Bahir Dar University, PO Box: 618, Addis Alem, Bahir Dar, Ethiopia
Tel +251 910194677
Email [email protected]; [email protected]
Background: The food system is an interdisciplinary global issue with substantial social and economic challenges. These challenges are most pronounced in developing countries, where chronic under-nutrition is prevalent. The long-standing notion has been to solve malnutrition and undernutrition primarily from the supply side through improving productivity and production. Nevertheless, addressing the nutrition paradox requires understanding consumers’ food choices and its drivers.
Methods: This study forms a part of a research project conducted in the ANRS, Ethiopia, in both urban and rural settings. To select study participants and collect data from the ANRS metropolitan cities, we used a household-based cross-sectional study and a multistage sampling technique. Data were collected using a structured questionnaire, and the study used a descriptive research method and a quantitative research approach in its analysis. PCA was used to identify which topics in the food system are most important to consumers.
Results: To identify widely held consumer interests, respondents were asked to report their interest in several relevant topics. The results show that food systems’ external impact, food safety, food nutrition, impact of other bodies on the food system, and food supply sustainability are the most crucial food topics where consumers are interested.
Conclusion: Concerned stakeholders who can help enhance household dietary practices in the study area; producers and other stakeholders who care about environmental sustainability and/or social values might use this information to adjust their production and marketing decisions to align with the food system topics that consumers identified as their priority.
Limitations: While the PCA allows for the reduction of multiple indices into a single composite index, it may restrict the targeting of a particular aspect of the food system topic. As a result, the indices’ meaning, and implications should be made while keeping the downsides in mind.
Keywords: food system topic, consumers, nutrition, Ethiopia
Introduction
A food systems approach is a valuable cross-disciplinary methodological structure for research and policy targeted at ensuring an adequate supply of nutritious food in the long run. The topic is highly relevant to the SDGs: SDG 1, SDG 2, SDG 12, SDG 14, and SDG 15, the implementation of the 2014 Rome Declaration on Nutrition, the subsequent UN Decade of Action on Nutrition, the fulfilment of the right to adequate food, and the Ethiopian national development goals of food and nutrition security in line with SDGs.1 The approach investigates the socioeconomic and environmental implications of the interactions between different segments of the food system and the consequences of activities inside the system.2 Food systems comprise the sum of actors and interactions along the food value chain that originate from input supply and livestock production, forestry, fisheries and aquaculture to transportation, processing, retailing, wholesaling, and preparation of foods to consumption as well as its impacts on environment, health, and society.3
Moreover, the food system is a worldwide issue with substantial socioeconomic concerns ranging from environmental, equity and business, to health and dietary issues.4,5 It involves the recognition that in the increasingly urbanized and globalized world in which we live in, feeding the world takes more than a simple “more food” approach, and that diet quality and nutrition, the environmental impact of food production and delivery, and the socioeconomic impacts of supply networks all demand special attention to address the burden of malnutrition.6 These challenges are most apparent in developing countries, where chronic under-nutrition is prevalent.7
The long-standing notion has been to solve malnutrition and undernutrition primarily from the supply side through improving productivity and production.8 Yet, addressing the nutrition paradox requires understanding the food choices of consumers and its drivers. Understanding the food choices of consumers and its drivers is central to understanding consumer behaviour and identifying essential leverage points for both marketing and health policymakers. Besides, it is crucial to know as much as possible about consumers since the primary outcome of food and nutrition security research is to contribute to healthier diets.9 Therefore, a comprehensive understanding of the consumer food choice drivers is needed in order to identify suitable entry points that can be levered for change to improve food and nutrition security.10
Recently, perspectives and approaches to end malnutrition are changing. Notably, more emphasis has started to be given to consumer behaviour and other factors to better understand the role of consumers behaviour in improving dietary outcomes.11 For instance, even if healthier foods are affordable, customers may not choose to buy them, and even if they do, targeted individuals may not consume them. This indicates that even when resources are scarce, improving nutrition outcomes can be achieved by shaping consumers’ dietary choices for better, more balanced diets. Therefore, a better understanding of consumers’ food preferences and consumption behaviours is needed to identify reliable methods and interventions to stimulate demand for healthier food products among food purchasers in households.12
Furthermore, developing countries have started offering a surging consumer market and an untapped market opportunity for both domestic and international businesses. Rapid urbanization and economic growth are thought to be powerful factors for the consumer industry because urbanites tend to have larger incomes, and their dense settlement also improves customer access to products to create more market opportunities. Thus, designing appropriate strategies and interventions to help consumers make informed food choices requires understanding their interests in relevant topics related to the food system. To date, there has been no comprehensive empirical study on the African consumer market.13 Notably, little research has been done from the consumers’ viewpoint to identify what they want to know about the food system. Here, we try to figure out what people want to know about the food system by defining the topics that customers are most interested in in the context of Ethiopia in general and ANRS in particular. This will be a vital contribution made by this study.12
This research aims to improve our understanding of how consumers make choices about food purchasing and consumption and the environment in which food choices are being made in a developing country context. In general, this paper aims to address the following primary research questions:
- What factors influence consumers’ food choices or purchases? Specifically, to what extent does consumers’ idea of a healthy diet is compared to scientifically validated perspectives and dietary recommendations?
- How can we take better advantage of a disaggregated understanding of consumers’ food choice behaviour to motivate healthy foods’ consumption by the poor and nutritionally challenged household members?
Thus, the overarching objective of this study was to assess the implication of consumers’ interest in food systems topics on stakeholder interventions to promote food and nutrition security in the case of Amhara National Regional State (ANRS), Ethiopia. The specific objectives include:
- to understand better the factors that determine the food choices of consumers;
- to provide customers with interpretive information to help them choose healthier food choices;
- to provide a disaggregation analysis of consumer behaviour to different population groups and different contexts to get a clear understanding of consumer behaviour; and
- to induce the food business to reconsider its products towards healthier alternatives.
This research is expected to contribute to the existing body of knowledge in a number of ways. First, it is the first study that attempts to shed light on the food choices of consumers and their implications for food and nutrition security in ANRS metropolitan cities, Ethiopia. Second, it is the first to study the drivers influencing consumers’ food choice behaviours in the food market of the ANRS metropolitan cities, Ethiopia.
The findings are expected to significantly contribute to policymakers at the global, national and municipal levels in designing and implementing appropriate policy and interventions. A better knowledge of food choice and its drivers of the urban consumers is helpful in guiding the design of intervention programs to tackle food and nutrition insecurity problems of the country. It will provide evidence for the design of food systems that provide consumers with access to nutritious, sustainable diets and contribute more broadly to development and well-being.
Data and Research Methodology
The study was conducted in Ethiopia, one of the poorest but the second-most populous country in Africa, next to Nigeria, and ranked 173rd out of 188 countries on the 2017 HDI.14 Also, several studies generally suggest that food and nutrition insecurity levels and intensity are high in the country due to a lack of sufficient physical, social, or economic access to food.15–18 Low dietary diversity and quality of food sit at the roots of the multiple malnutrition burdens of the country. Meanwhile, obesity levels, mainly among women are rising, with one in every three women in rapidly urbanizing areas is obese. The double burden of malnutrition is a term used to describe this situation.4
A cross-sectional study design was adopted for the study, and data were collected in the ANRS, the second-most populous region of the country, in northwestern Ethiopia, in 2017. The survey was conducted in three ANRS metropolitan cities (Bahir Dar, Gondar, and Dessie) to represent urban consumers and three rural districts surrounding these metropolitan cities in order to reduce agro-ecological differences in our comparison of urban and rural consumers. Therefore, the survey was designed to include both urban and rural households who were randomly sampled. However, this study forms part of the research project and for our data analysis, we only used data from urban households because they provide a better opportunity to study food choice and purchase behaviour. Besides, since rural households are mostly subsistence, information on food choice and purchasing behaviour of them is minimal. They are also found not to buy much food from the market.
Calculating the sample size is an important step in conducting research since it is not always feasible to study the whole population in areas where the population is sufficiently large. As a result, we used a single population proportion formula to select a set of participants (sample) from the population for our study19 based on the following assumptions: expected food insecurity prevalence rate of 30%, 95% confidence interval (5% level of significance, Z (α/2) = 1.96) and a 5% margin of error (absolute precision). Thus, our sample size included 187 households.
To get permission to recruit participants, we first contacted local officers from each Kebele. Then, in order to obtain written informed consent from participants, relevant information was provided to them, and sufficient time was given for them to review the consent document. We conducted a pilot test for our study to ensure the validity of our surveys and to determine their viability on a larger scale.
A quantitative research approach was used in the study to analyze the data. A quantitative approach typically entails gathering and translating data into a numerical form in order to perform statistical analyses and draw conclusions. In addition, descriptive statistics were used in the analysis of the study. Tables, graphs, and charts were used to discuss the factors that affect consumers’ food choices, as applicable in the paper. As food topics are diverse in their nature and so many issues are raised in the questionnaire, it is difficult to capture it with a single indicator.20 As a result, the principal component analysis was used to identify and categorize the various food system topics of interest to consumers. Principal Component Analysis (PCA) is a multivariate technique that helps to reduce and transform large, correlated multidimensional data into sets of linearly uncorrelated variables called principal components with a minimum loss of information.21–23
It is used when multiple measurements on an object are performed.24 The measurements are usually represented as a matrix X. Given an  data matrix X, where n is the total number of samples and p is the total number of variables in matrix X, PCA minimizes the sum of squares of
  in equation (1).

Where  represents the
  score matrix containing the projection of the observations into the k-dimensional space defined by the first k principal components;
  represents the
  matrix of the loadings, which are the coefficients of the linear combination of the original variables defining each principal component; matrix
  is the
  matrix that contains statistic residuals of the model, and k is the number of components selected for the PCA model of X.25
In a typical PCA analysis, two results are generated, loadings and score plots. The loading vectors explain the correlation between variables and components by measuring the specific effects of variables on the components, on the other hand, the score vectors define the trajectory of the principal components with respect to the observations.26 All factors whose eigenvalues (squared factor loadings that load on a factor taken together) exceed one, as well as the inflection point of a scree plot, are well-known standard criteria (graph of each eigenvalue against the respective factors) to determine the number of factors to be extracted. Theoretically, the first factor in PCA accounts for the maximum variation between the factors, and the subsequent components do not correlate with the previous PCs and express as much of the remaining information as possible.21,27 PCA is a helpful data visualization technique: since each object gets a score value on each PC, objects can be presented in score plots. Score plots can reveal patterns, trends, and outliers in the data.28
Furthermore, to test whether the partial correlations among the variables are significant enough to use PCA, the Kaiser-Meyer-Olkin (KMO) measure of sampling adequacy (MSA) was used. The KMO statistic specifies whether the other variables can explain the correlations between variables in the dataset.29,30 Such measures are based on a comparison of correlation and partial correlation coefficients using an index. KMO statistics can be calculated for multiple variables using equation (2).31
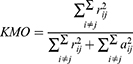
where rij is the simple correlation coefficient between variables i and j, and aij is the partial correlation coefficient between variables i and j.
Like correlations, the statistical values of KMO statistics range from 0 to 1. When the sum of the correlation coefficients is relatively large compared to the sum of the partial correlation coefficients, high values (approaching 1) are obtained. There are likely to be patterns of correlation in the data in this situation, meaning that a principal component analysis might be an appropriate technique to use. Specifically, values greater than 0.5 are generally considered acceptable, while values between 0.7 and 0.8 are considered good, and values between 0.8 and 0.9 are considered outstanding.
Results
Tables 1 and 2 contained detailed descriptive information about the characteristics of respondents. As shown in Table 1, only a small percent (8%) of the survey respondents were females. The survey reflects the paternalistic nature of Ethiopian households, with males accounting for the major share of the respondents, despite the fact that women and children are the most vulnerable in terms of food insecurity. In terms of religion, Orthodox Christians followers accounted for 83% of the respondents, while only 15% of the respondents had no access to formal literacy. Out of all the sample respondents, only 20% of them had received remittance payments from someone who was either in Ethiopia or elsewhere in the world.
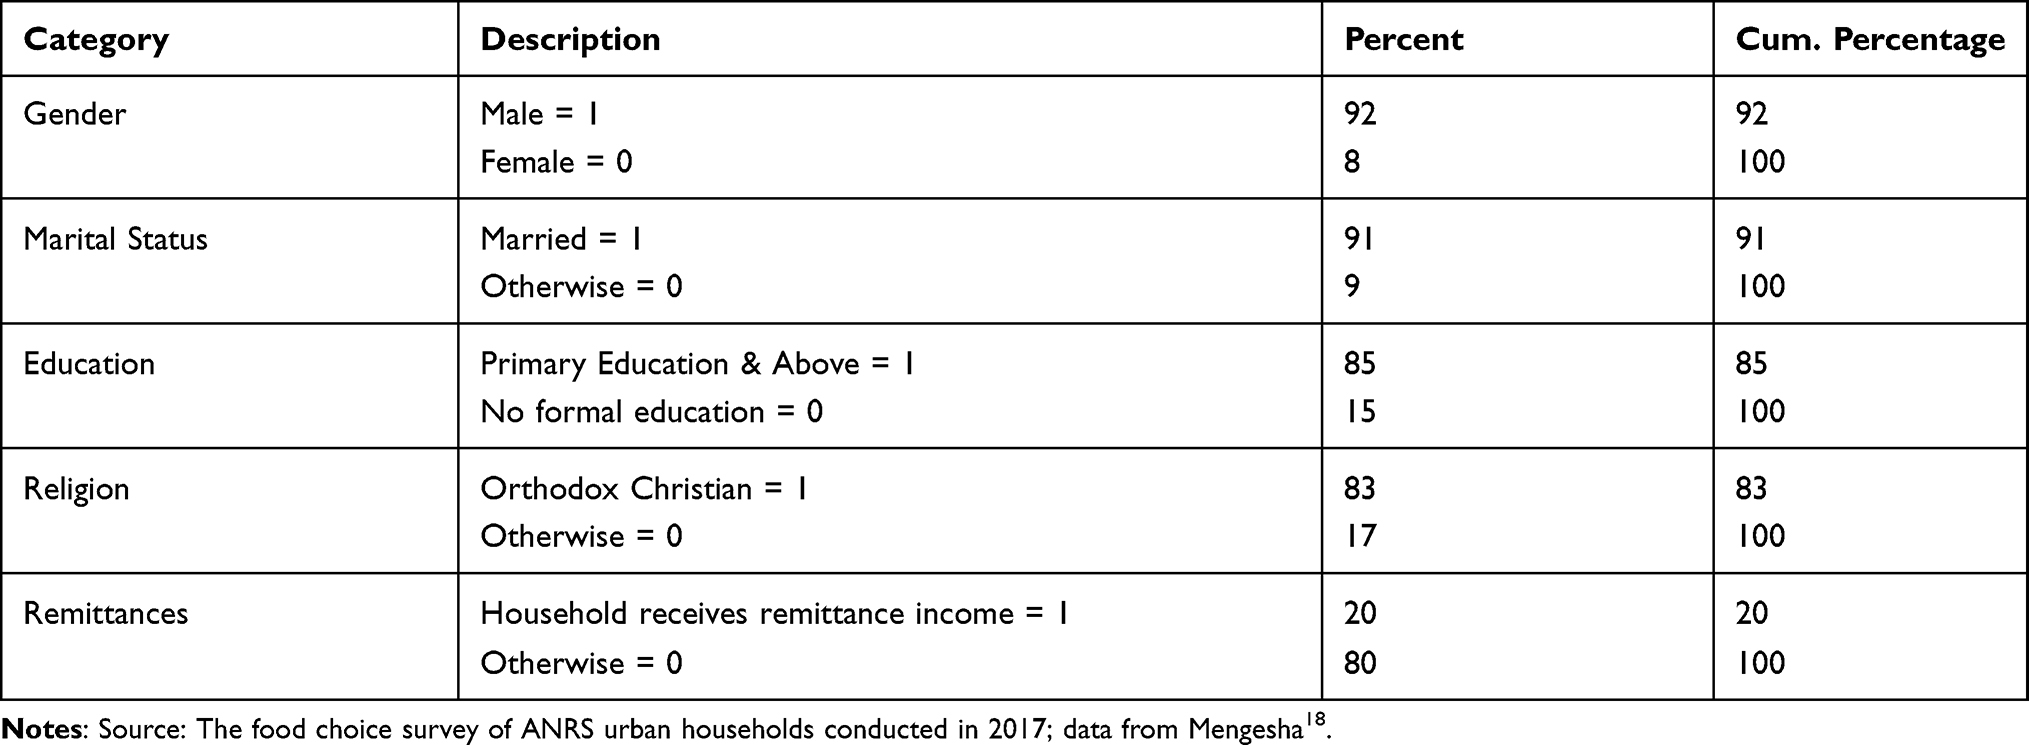 |
Table 1 Frequency Distribution of the Study Sample (N = 187) |
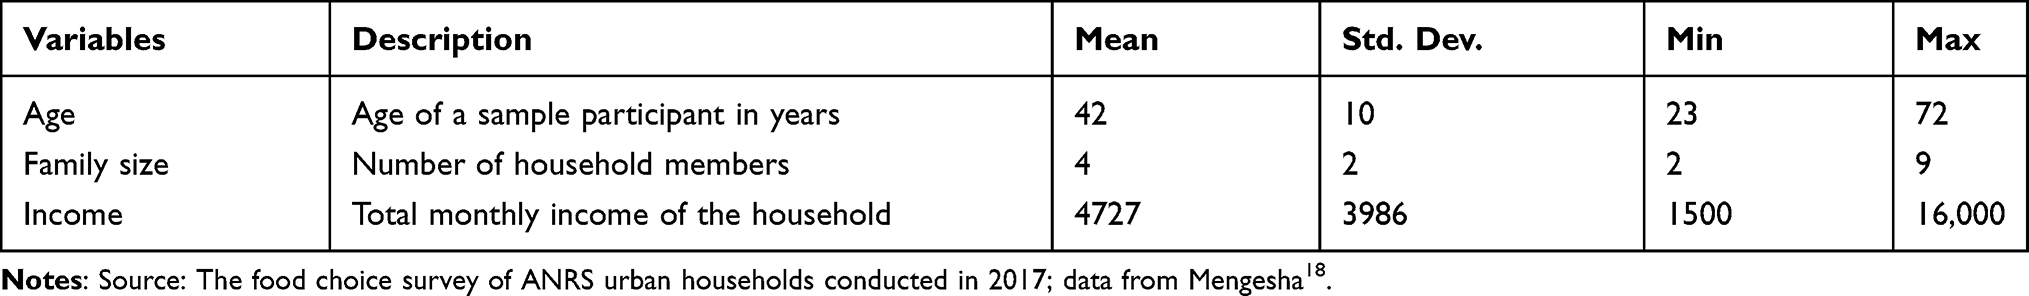 |
Table 2 Summary Statistics of the Study Sample (N = 187) |
As shown in Table 2, the average age of sample respondents was 42 and came from a family of four members. The average monthly household income is about 4700 Ethiopian Birr, but nearly 70% of the sample households received significantly less than this income.
Based on the important sociodemographic characteristics of study participants, we conducted a sub-sample analysis and comparisons as reported in Figure 1. The gender and education sub-samples are straightforward. The income sub-samples are generated by grouping data into categories.
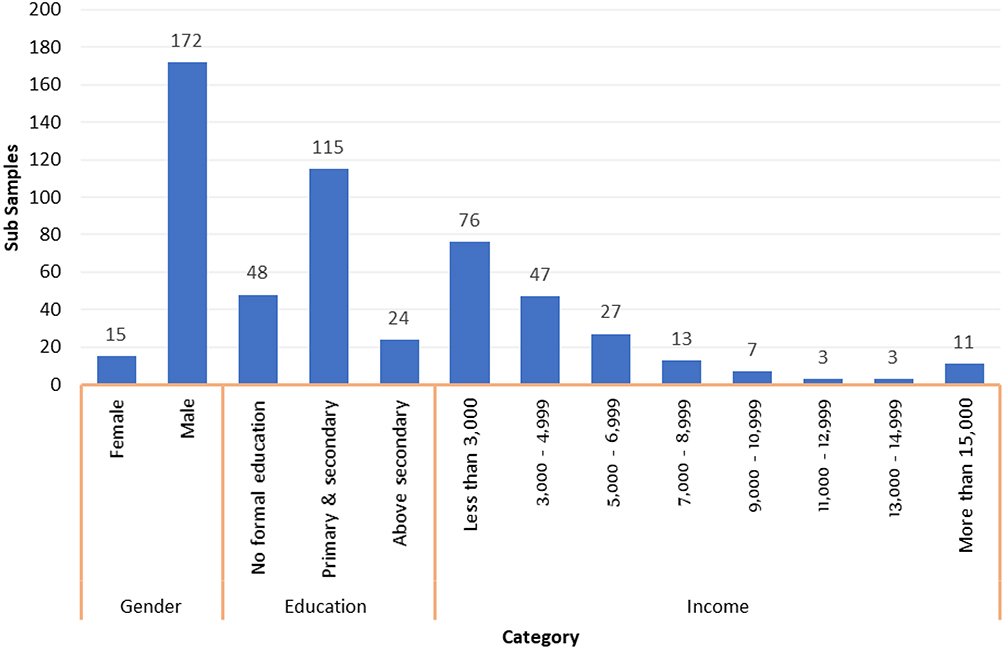 |
Figure 1 Distribution of observations in different sub-samples (N = 187). Notes: Source: The food choice survey of ANRS urban households conducted in 2017; data from Mengesha18. |
We must first engage the interests of customers in order to help them understand food system issues and make informed decisions. To identify widely held consumer interests, respondents were asked to report their interest in several relevant topics captured through nine statements about the food system’s different topics. An outline of the statements and the distribution of the Likert scale responses to each are presented in Table 3 below.
 |
Table 3 Food System Statements and the Distribution of the Responses, % (N = 187) |
It is clear that survey respondents reported the most interest in the safety, nutrition, sustainability, and stability of their food and the environmental impacts of how their food was produced.
The results have important policy and educational implications. By framing socially important subjects around problems that are more likely to be of concern to the target audience, it is possible to draw people in and help them build connections between them. Food safety and nutrition are universally appealing issues that are often addressed by health extension programs. Many people, however, are concerned about the potential implications of their food production (eg, effects on the environment, etc.). As a result, interventions should consider whether consumers are interested in a more in-depth discussion or exploration of these topics.
Furthermore, we find that the nine statement variables are highly correlated (the average correlation coefficient is 0.436). As a result, we reduce the household responses to these statements into a few essential topics using principal components analysis. The principal components analysis attempts to find components that account for most of the variation among these variables. Table 4 provides a more detailed description of the principal components analysis and the corresponding results. Table 5 shows the Eigenvalues for each of the nine components.
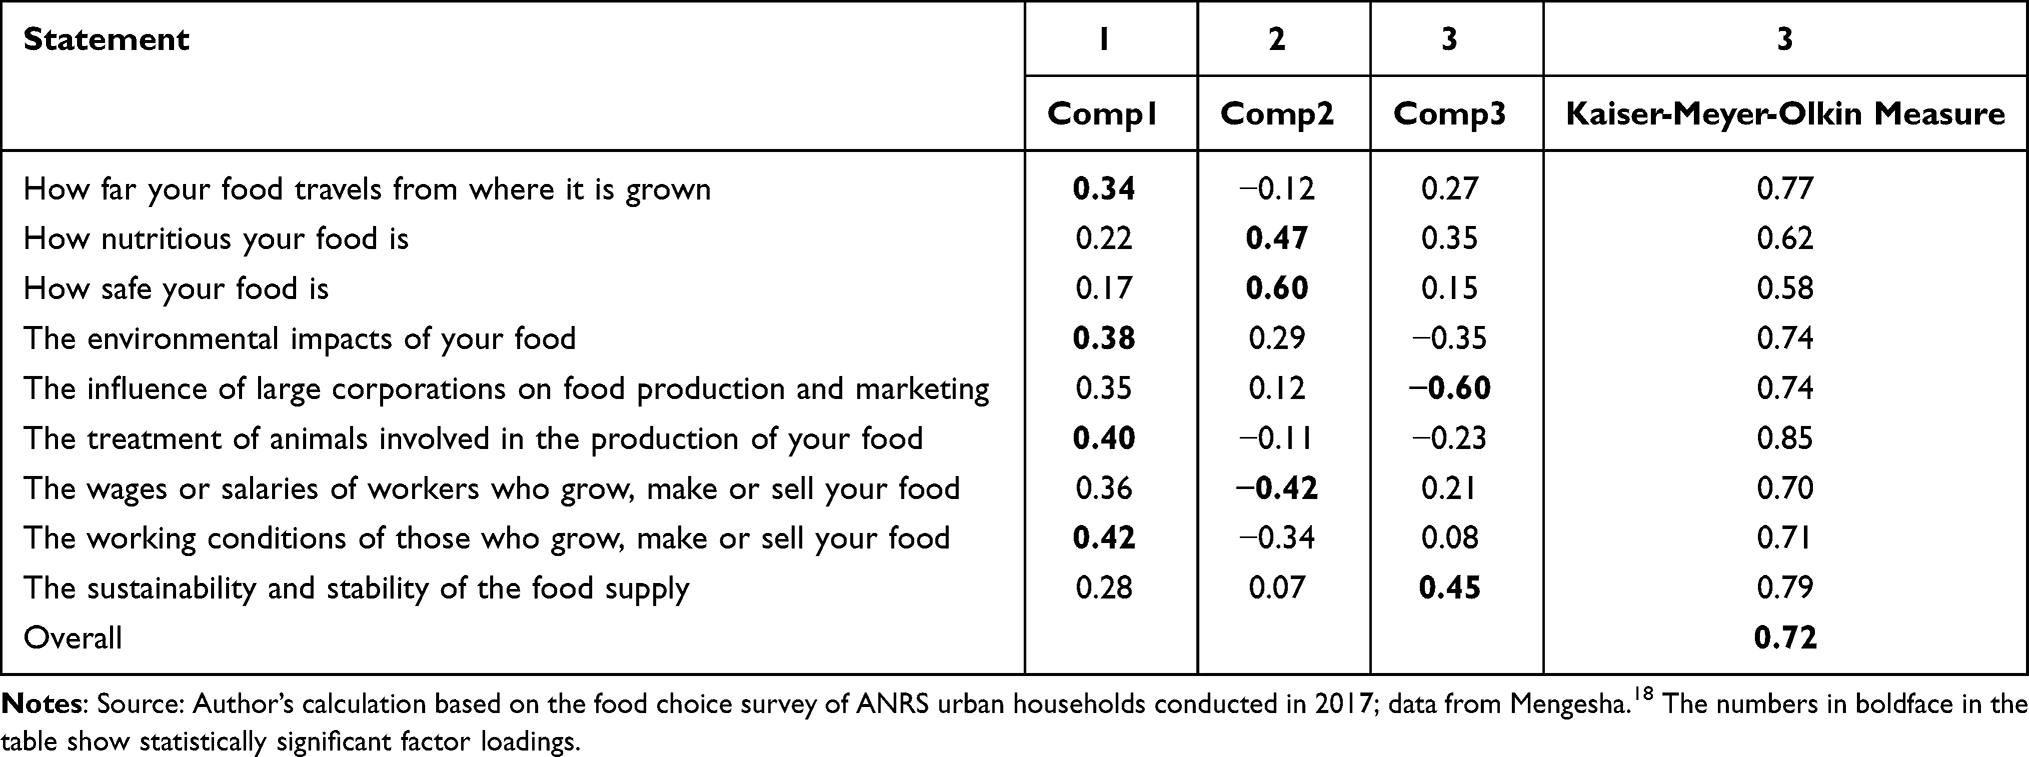 |
Table 4 Principal Component Loadings and Measure of Sampling Adequacy |
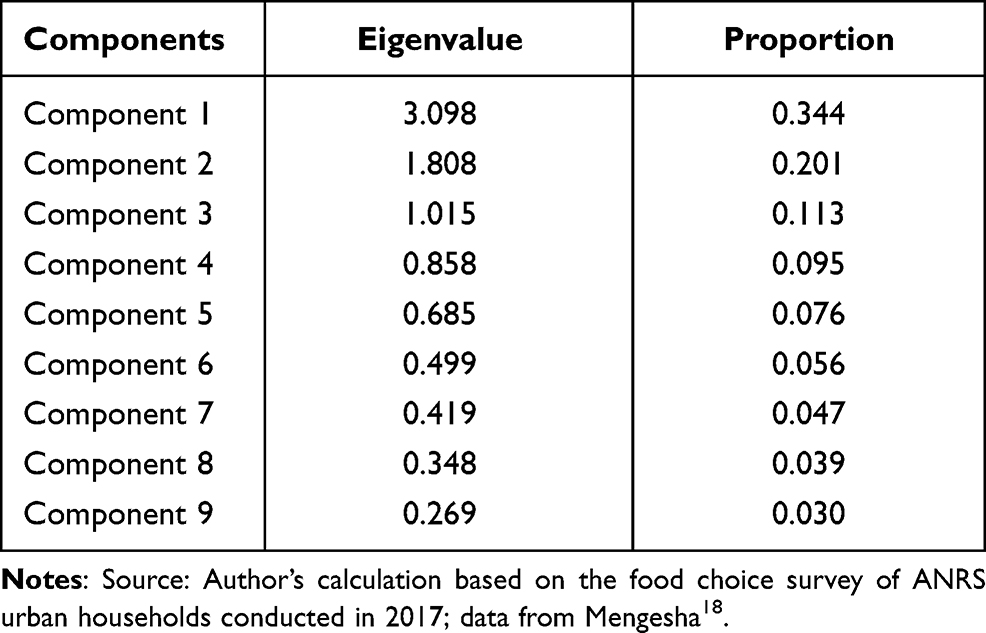 |
Table 5 Principal Components and Eigenvalues |
We see that the three components explain 66% of the variation in the data.
For the purpose of running a PCA is to reduce the set of variables down, a criterion for selecting the optimal number of components that is smaller than the total number of items would be helpful. Thus, following the Kaiser rule that states that only components that take an Eigenvalue larger than one should be retained, we retained these three components. We see that the first three components under Table 5 have an eigenvalue greater than 1. This result is confirmed by the Scree Plot of the Eigenvalues in Figure 2, which plots the eigenvalue (total variance explained) by the component number.31
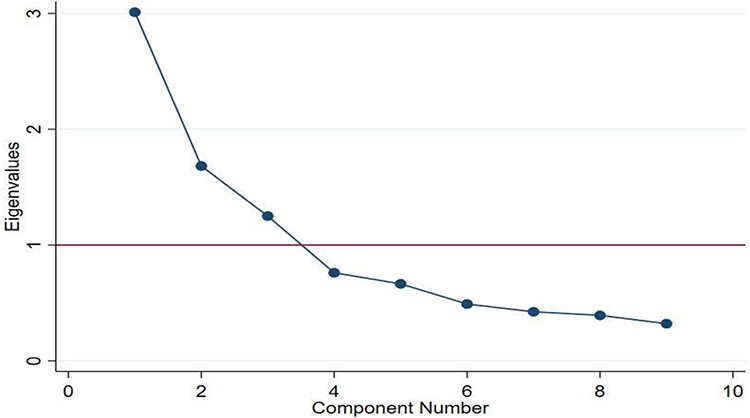 |
Figure 2 Scree plot of Eigenvalues after PCA. Notes: Source: Author’s calculation based on the food choice survey of ANRS urban households conducted in 2017; data from Mengesha18. |
Generally, the first component has the highest total variance, and subsequent components have decreased impact on the scores. In the scree plot curve, an Eigenvalue of one represents the marking point where it is not helpful to continue further component extraction. The scree plot showed an abrupt flattening of the curve (slower reduction in the eigenvalues) after the third component signifying that the subsequent components are not crucial to the analysis. Thus, using the scree plot, we also retained the first three components.
Columns 1, 2, and 3 in Table 4 give the principal component loadings based on the first three components. In column 4, the Kaiser-Meyer-Olkin (KMO) sampling adequacy measure is shown. The Kaiser-Meyer-Olkin (KMO) sampling adequacy test justifies the factor analysis, as all KMO values are effectively greater than 0.5, suggesting that the nine statement variables are indeed measuring a familiar construct.
Component 1 reflects the idea captured by four statements: How far your food travels from where it is grown, the environmental impacts of your food, the treatment of animals involved in the production of your food, and the working conditions of those who grow, make or sell your food. All these factors are related to the external impacts of food systems, and they appear to be consistent in their content.
The statements related to food safety, food nutrition, and the wages or salaries of workers who grow, make or sell food are loaded in component 2. Food safety and nutrition have positive coefficients, whereas workers’ wages or salaries, who grow, make or sell food, have a negative factor loading.
Component 3 captures two factors: the influence of large corporations on food production and marketing and the food supply’s sustainability and stability. This component indicates the impact of other bodies and the sustainability of the food supply.
Conclusion
The study of food system topics allows researchers to use market research techniques to determine the feasibility and commercial viability of new products, as well as to establish new methods for trying to bridge information gaps across producers and consumers. The following conclusions were drawn from the data analysis and findings of our study. The most determinant factors in consumers’ choice of retail outlets are the availability of healthy foods, food safety, a wide variety of foods offered, prices of food products, and convenience/nearby location. The study population clearly shows that consumers are interested in in shifting the direction of the food system to one that prioritizes the safety, nutrition, sustainability, and stability of their food and the environmental impacts of how it was produced. The principal component analysis is used to identify the most important topics of interest to customers. Accordingly, external impacts of food systems, food safety, food nutrition, influence of other bodies on the food system, and food supply sustainability are the areas that invite the intervention of stakeholders to improve the household dietary practices.
Producers who care about environmental sustainability and/or social values might use this information to adjust their production and marketing decisions to align with the food system topics that consumers identified in this study. Besides, more substantial improvements in the food system could be stimulated by greater participation of both producers and consumers in food system planning. Furthermore, incorporating additional explanatory variables and alternative food system measures may help in the development of a more sophisticated representation of food and nutrition security dynamics in developing countries.
Abbreviations
ANRS, Amhara National Regional State; HDI, Human Development Index; KMO, Kaiser-Meyer-Olkin; MSA, Measure of Sampling Adequacy; PCA, Principal Component Analysis; SDGs, Sustainable Development Goals.
Ethics and Consent
The study was conducted according to the Declaration of Helsinki principles and fulfilled the Ethiopian National Health Research and Ethics Guideline requirements. The Ethical Review Committee of Bahir Dar University also provided the study with their approval. Along with the questionnaire, each study participant received information and an informed consent form. Consequently, data were collected after each study participant signed a written informed consent form. Participation was entirely voluntary, including not responding to the questions after reading them. Anonymity was used to maintain data confidentiality by avoiding any personal identifiers. As a result, the data collection process was secured.
Disclosure
The author declares no conflicts of interest in this work.
References
1. Herrero M, Thornton PK, Mason-D’Croz D, et al. Articulating the effect of food systems innovation on the sustainable development goals. Lancet Planet Health. 2021;5(1):e50–e62. doi:10.1016/s2542-5196(20)30277-1
2. Van Berkum S, Dengerink J, Ruben R. The Food Systems Approach: Sustainable Solutions for a Sufficient Supply of Healthy Food. Wageningen Economic Research; 2018.
3. Von Braun J, Afsana K, Fresco L, Hassan M, Torero M. Food Systems–definition, concept and application for the UN food systems summit.
4. Lim SS, Vos T, Flaxman AD, et al. A comparative risk assessment of burden of disease and injury attributable to 67 risk factors and risk factor clusters in 21 regions, 1990–2010: a systematic analysis for the Global Burden of Disease Study 2010. Lancet. 2012;380(9859):2224–2260.
5. Gillespie S, van den Bold M. Agriculture, food systems, and nutrition: meeting the challenge. Glob Chall. 2017;1(3):1600002. doi:10.1002/gch2.201600002
6. Béné C, Prager SD, Achicanoy HAE, et al. Understanding food systems drivers: a critical review of the literature. Glob Food Secur. 2019;23:149–159. doi:10.1016/j.gfs.2019.04.009
7. Kennedy G, Razes M, Ballard T, Dop MC. Measurement of Dietary Diversity for Monitoring the Impact of Food Based Approaches; 2010. Available from: http://www.ipcinfo.org/fileadmin/user_upload/eufao-fsi4dm/docs/Dietary_Diversity_paper.pdf. Accessed September 10, 2021.
8. Ericksen PJ. Conceptualizing food systems for global environmental change research. Glob Environ Change. 2008;18(1):234–245. doi:10.1016/j.gloenvcha.2007.09.002
9. Covic N, Hendriks S, editors. Achieving a nutrition revolution for Africa: the road to healthier diets and optimal nutrition. ReSAKSS Annual Trends and Outlook Report 2015. Washington, DC: International Food Policy Research Institute (IFPRI); 2015. doi:10.2499/9780896295933
10. Kearney J. Food consumption trends and drivers. Philos Trans R Soc B Biol Sci. 2010;365(1554):2793–2807. doi:10.1098/rstb.2010.0149
11. McDermott J, Johnson N, Kadiyala S, Kennedy G, Wyatt AJ. Agricultural research for nutrition outcomes–rethinking the agenda. Food Secur. 2015;7(3):593–607. doi:10.1007/s12571-015-0462-9
12. Agenda G. Shaping the Future of Global Food Systems: A Scenarios Analysis. World Economic Forum; 2017.
13. Hattingh D, Russo B, Sun-Basorun A, Van Wamelen A. The Rise of the African Consumer. McKinsey Africa Consumer Insights Center, McKinsey and Company; 2012. Available from: https://www.mckinsey.com/industries/retail/our-insights/the-rise-of-the-african-consumer#:~:text=The%20continent's%20consumer%2Dfacing%20industries,largest%20business%20opportunity%2C%20by%202020.&text=In%20one%20of%20the%20first,focus%20on%20the%20largest%20cities. Accessed September 10, 2021.
14. United Nations Development Programme. Statistical Update 2018. Human development indices and indicators; 2018. Available from: http://hdr.undp.org/en/content/human-development-indices-indicators-2018-statistical-update.
15. Asefach A, Nigatu R. Correlates of household food security in densely populated areas of southern Ethiopia: does the household structure matter? Stud Home Comm Sci. 2007;1(2):85–91. doi:10.1080/09737189.2007.11885238
16. Kidane H, Alemu ZG, Kundhlande G. Causes of household food insecurity in Koredegaga peasant association, Oromiya zone, Ethiopia. Agrekon. 2005;44(4):543–560. doi:10.1080/03031853.2005.9523727
17. Bogale A, Shimelis A. Household level determinants of food insecurity in rural areas of Dire Dawa, Eastern Ethiopia. Afr J Food Agric Nutr. 2009;9(9):1914–1926.
18. Mengesha ST. Understanding the patterns and trends of food consumption in a developing country context: the case of Amhara Region, Ethiopia. Risk Manag Healthc Policy. 2021;14:1777–1784. doi:10.2147/RMHP.S299669
19. Daniel WW, Cross CL. Biostatistics: A Foundation for Analysis in the Health Sciences. Wiley; 2018.
20. Pinstrup-Andersen P. Food security: definition and measurement. Food Secur. 2009;1(1):5–7. doi:10.1007/s12571-008-0002-y
21. Field A. Discovering Statistics Using IBM SPSS Statistics. Sage; 2013.
22. Vasan KK, Surendiran B. Dimensionality reduction using principal component analysis for network intrusion detection. Perspect Sci. 2016;8:510–512. doi:10.1016/j.pisc.2016.05.010
23. Reig E. Food security in African and Arab countries: a review of the topic and some suggestions for building composite indicators with principal components analysis. Department of Applied Economics II, Universidad de Valencia Working Papers. 2012:1210.
24. Hoefsloot H, Vis D, Westerhuis JA, Smilde AK, Jansen J. Multiset Data Analysis: ANOVA Simultaneous Component Analysis and Related Methods. Elsevier; 2020:465–478.
25. Camacho J, Smilde AK, Saccenti E, Westerhuis JA. All sparse PCA models are wrong, but some are useful. Part I: computation of scores, residuals and explained variance. Chemom Intell Lab Syst. 2020;196:103907. doi:10.1016/j.chemolab.2019.103907
26. Cruz A, Carneiro S, Pontes S, et al. Optical Sensing Strategy Based on Carbon Quantum Dots. Elsevier; 2021.
27. Wold S, Esbensen K, Geladi P. Principal component analysis. Chimometrics and intelligent laboratory systems.
28. Stanimirova I, Daszykowski M, Walczak B. Dealing with missing values and outliers in principal component analysis. Talanta. 2007;72(1):172–178. doi:10.1016/j.talanta.2006.10.011
29. Kaiser HF. An index of factorial simplicity. Psychometrika. 1974;39(1):31–36. doi:10.1007/BF02291575
30. Mooi E, Sarstedt M. A Concise Guide to Market Research Berlin Heidelberg. Vol. 10. Germany: Springer-Verlag; 2011:978.
31. Hutcheson GD, Sofroniou N. The Multivariate Social Scientist: Introductory Statistics Using Generalized Linear Models. Sage; 1999.
 © 2021 The Author(s). This work is published and licensed by Dove Medical Press Limited. The
full terms of this license are available at https://www.dovepress.com/terms
and incorporate the Creative Commons Attribution
- Non Commercial (unported, 3.0) License.
By accessing the work you hereby accept the Terms. Non-commercial uses of the work are permitted
without any further permission from Dove Medical Press Limited, provided the work is properly
attributed. For permission for commercial use of this work, please see paragraphs 4.2 and 5 of our Terms.
© 2021 The Author(s). This work is published and licensed by Dove Medical Press Limited. The
full terms of this license are available at https://www.dovepress.com/terms
and incorporate the Creative Commons Attribution
- Non Commercial (unported, 3.0) License.
By accessing the work you hereby accept the Terms. Non-commercial uses of the work are permitted
without any further permission from Dove Medical Press Limited, provided the work is properly
attributed. For permission for commercial use of this work, please see paragraphs 4.2 and 5 of our Terms.