Back to Journals » International Journal of General Medicine » Volume 14
Analysis of Ferroptosis-Related Gene Expression and Prognostic Factors of Renal Clear Cell Carcinoma Based on TCGA Database
Authors Ma S, Zhao M, Fan J, Chang M, Pan Z, Zhang Z, Xue S, Li Q, Zhang Y
Received 5 June 2021
Accepted for publication 20 August 2021
Published 22 September 2021 Volume 2021:14 Pages 5969—5980
DOI https://doi.org/10.2147/IJGM.S323511
Checked for plagiarism Yes
Review by Single anonymous peer review
Peer reviewer comments 2
Editor who approved publication: Dr Scott Fraser
Sijia Ma,1 Mingming Zhao,1 Jiao Fan,1 Meiying Chang,1 Zhiyu Pan,1 Ziyan Zhang,1 Shunxuan Xue,1 Qi Li,2 Yu Zhang1
1Department of Nephrology, Xiyuan Hospital, China Academy of Chinese Medical Sciences, Beijing, People’s Republic of China; 2Department of Clinical Laboratory, Xiyuan Hospital, China Academy of Chinese Medical Sciences, Beijing, People’s Republic of China
Correspondence: Yu Zhang Email [email protected]
Introduction: Renal clear cell carcinoma (ccRCC) is a common tumor of the urinary system, most of which are primary malignant tumors with high metastatic rate and remaining incurable. Ferroptosis is a newly discovered form of iron-dependent programmed cell necrosis in recent years, which is inextricably linked to the occurrence and development of tumors progression. Due to the complexity of the interaction between genes in ccRCC, the research on the pathogenesis of ccRCC is still not remarkably accurate. Therefore, whether ferroptosis-related genes (FRGs) can play a role in predicting prognosis in ccRCC needs to be discussed.
Methods: We entered the Cancer Genome Mapping Project (TCGA) database and downloaded the relevant genes and clinical research data of ccRCC patients. Lasso Cox regression was used to construct a multi-gene prognostic model in the TCGA cohort. R language software was used for drawing pictures related to our study.
Results: Most of the genes involved in ferroptosis (86.2%) existing differences between the tumor and normal tissues in the TCGA public gene database. In terms of univariate Cox regression analysis, 20 differentially expressed genes (DEGs) were associated with prognosis and survival (P< 0.05). A prognostic model of 12 FRGs was constructed, and patients were segmented into two different groups depending on how risky they are. Considering overall survival, the high-risk group is dramatically lower than the low-risk group (P< 0.001). In multivariate Cox regression analysis, risk scores and stage turned out be an independent prognostic factor (P< 0.001). GO and KEGG analysis and ssGSEA analysis of DEGs revealed that these genes were related to immune-related pathways (P< 0.05).
Conclusion: This study established and identified the changes in FRGs expression and prognostic factors of ccRCC, which can be helpful for prognosis evaluation and clinical treatment of this disease.
Keywords: renal clear cell carcinoma, ferroptosis, TCGA database, the prognosis
Introduction
The incidence and mortality of renal cell carcinoma (RCC) are rising year after year recently, which seriously affects human health. RCC as a common and refractory malignant tumor of urinary, is among the 10 most common cancers in human,1 which comprises a diverse group of malignancies arising from the nephron, accounting for about 3% of all malignancies.2 The incidence of RCC varies regionally, Northern Europe and North America encountered with the highest rates whereas Asia and Africa with the lowest. Approximately 3–5% of the incidence of RCC is believed to be genetic.3 The main types of RCC are divided into three broad categories, including clear cell RCC (ccRCC), papillary RCC, and chromophobe RCC.4 The most familiar type of RCC is ccRCC, accounting for about 75% of the pathological types of renal carcinoma, and has the worst prognosis in the common epithelial neoplasms of the kidney.5 The incidence of RCC is rising year by year globally. Although early diagnosis and successful urological surgery with partial or total nephrectomy can save lives, only about 10% of patients with RCC show characteristic clinical symptoms. Unfortunately, more than 60% of patients are incidentally found on routine ultrasound.6 There are many causes for the high mortality rate in RCC, the main of them is that traditional chemotherapy and radiotherapy are unavailability to a large extent in treating all RCC subtypes.7 Therefore, tumor screening and prevention measures are largely dependent on the causes of tumor occurrence. Between 25% and 30% of ccRCC patients are found to have metastases at the time of their first visit. Although the mechanism of cancer occurrence and development has been deeply researched, the pathogenesis and carcinogenesis of ccRCC remain unclear.8 Therefore, given the high morbidity and mortality of ccRCC, exploration of molecular markers with prognostic value for immune response in patients with ccRCC, as well as finding the development of novel prognostic models remains critical.
Ferroptosis is a specific way of regulated cell death (RCD) that relies on oxidized iron, reactive oxygen species and lipid peroxidation products that can be accumulated to lethal levels in the process.9,10 As a newly discovered form of RCD, ferroptosis is involved in human development, immunity, aging, and various pathological processes, has a pivotal position in maintaining normal cell and tissue survival. Emerging evidence suggests that several carcinogenic pathways are involved in ferroptosis, which plays an important role in inhibiting tumorigenesis and being explored continuously as a new therapeutic approach to eliminate obstinate cancer cells.11 Ferroptosis also plays a key role in inhibiting tumorigenesis by removing cells from the environment that are deficient in nutrients or have been impaired by infections or suffered external pressures.12,13 In recent years, ferroptosis is inseparable from a variety of kidney diseases, such as acute kidney injury, polycystic kidney disease, and RCC.14 Research showed that RCC is particularly impressionable to ferroptosis, ccRCC can become sensitive to ferroptosis cell death by inhibiting glutathione synthesis and ultimately preventing tumor growth, such as silence of genes coding for glutathione peroxidases, GPX3 and GPX4.15 There has new evidence that immunotherapy is a premier treatment of choice for metastatic ccRCC. Studies have shown that increased ferroptosis and immune activation can be synergically enhanced in killing cancer cells. For example, depletion of NCOA4, an autophagosome gene involved in ferritin phagocytosis, can weaken ferroptosis by eliminating iron accumulation.15 However, reports about the role of FGRs in the prognosis of patients with ccRCC are still in the minority.
In this study, the mRNA gene expression profile of ccRCC patients in TCGA database was analyzed, and the influence of age, gender and other significantly differentially expressed genes related to ferroptosis on the prognosis of patients was explored. The purpose is to provide a new reference index for prognostic risk stratification, prognosis assessment and treatment strategy selection in patients with ccRCC.
Materials and Methods
Database
After login TCGA website, we organized a choice for kidney renal clear cell carcinoma (KIRC), which is equivalent to ccRCC, download as of February 1, 2021 (https://portal.gdc.cancer.gov), 530 cases of transcriptome patients with KIRC data. Perl software was used to convert the genetic data of related samples into matrix files. According to the Ensembl database (http://www.ensembl.org/) convert “Ensembl_Stable_id” into “Gene Symbol” in the mRNA file, and then organized it into a unique one. There involved 72 clinically relevant normal samples and 539 tumor samples. The samples were mainly from people with KIRC in America. Use normalized reads to count values. Since the TCGA database is publicly accessible to obtain open access data, no ethical review or approval is required for this study. TCGA’s data is publicly queryable. The study followed TCGA’s data access policy and publication guidelines.
Construction and Verification of a Novel Prognostic FRG Survival Model
A total of 60 genes related to ferroptosis were obtained by reading the literature.16–18 The “Limma” package of R language was applied to process the relevant data. We performed Wilcox differential analysis on FRGs from normal and tumor samples, and set false detection rates (FDR) as 0.05, Benjamini and Hochberg (BH) method was performed to estimate the FDR value. After the correction and adjustment of P value by BH method, the corrected threshold P. adj.<0.05, and the information of differentially expressed genes (DEGs) was preserved after filtering. The overall survival (OS) rates for different genes were calculated based on univariate Cox analysis, and the “Survival” of R language software was performed to establish a prognosis model. Used the “Venn” package in R language to draw the Venn map of ferroptosis-related DEGs and prognostic genes, as the same time preserved the related information of the intersection genes. Prognostic risk characteristics were assessed by using the “GLMnet” package and the “Survival” package of R language, based on the minimum absolute contraction and selection operator (Lasso) method.17 The formula of specific risk score is as follows: esum (the expression of the selected FRG × corresponding coefficient), the gene expression coefficients were output during cross validation after adjusting for minimum error points.16 Then, the risk score of each ccRCC patient was calculated on the basis of the formula, and the median score was taken as the cut-off value to divide them into low-risk and high-risk groups. “SurvMiner” and “Survival” of R language were used to analyze the data of patients in the high and low-risk groups, and survival curves were drawn to analyze whether there was a difference in survival rate between the two groups. The 3-year ROC curve was plotted with the “timeRoc” of R package to evaluate the accuracy of related genes in estimating patients’ survival time. Based on the different gene expression of patients in the two groups, the R packet “Rtsne” and “ggplot2” were used to reduce the dimension of the data, PCA and t-SNE analysis were performed to investigate whether there were distribution differences between the two risk groups of patients.
GO and KEGG Enrichment Analysis of Related Differential Genes
The software package “Clusterprofiler” of R was applied to perform gene ontology (GO) and Kyoto Encyclopedia of Genes and Genomes (KEGG) results for visualization of the different genes between the two different risk patients, and relevant graphs were drawn subsequently. The “GSVA” and “GSEABASE” of R package were used to score the relevant differential genes, explore the different immune cells and immune functions of the two groups, and draw the relevant graphs.19
Statistical Analysis
To determine whether there are differences in gene expression between tumor and normal tissues, we used Student’s t-test to analyse the corresponding tissue. We aimed to compare the difference of gene proportion among patients with different tissues by Chi-square test. SsGSEA scores of immune cells or pathways were compared between the two risk level groups by using Mann–Whitney test with adjusted P values after using BH method. The OS rate between the patients with different risk levels was identified by Kaplan–Meier method and bilateral Log rank test. In order to confirm the independent predictors of OS, univariate and multivariate Cox regression analyses were utilized. R software (Version 4.0) was used to complete the statistical analysis, the result was considered to statistically significant while P<0. 05, and all P values were double-tailed distribution.
Results
To systematically describe our study, we developed a flow chart (Figure 1). As a result, we enrolled a total of 537 KIRC patients from the TCGA-LIHC cohort finally. The detailed clinical features of these patients, such as age, sex, and tumor stage are introduced in Table 1.
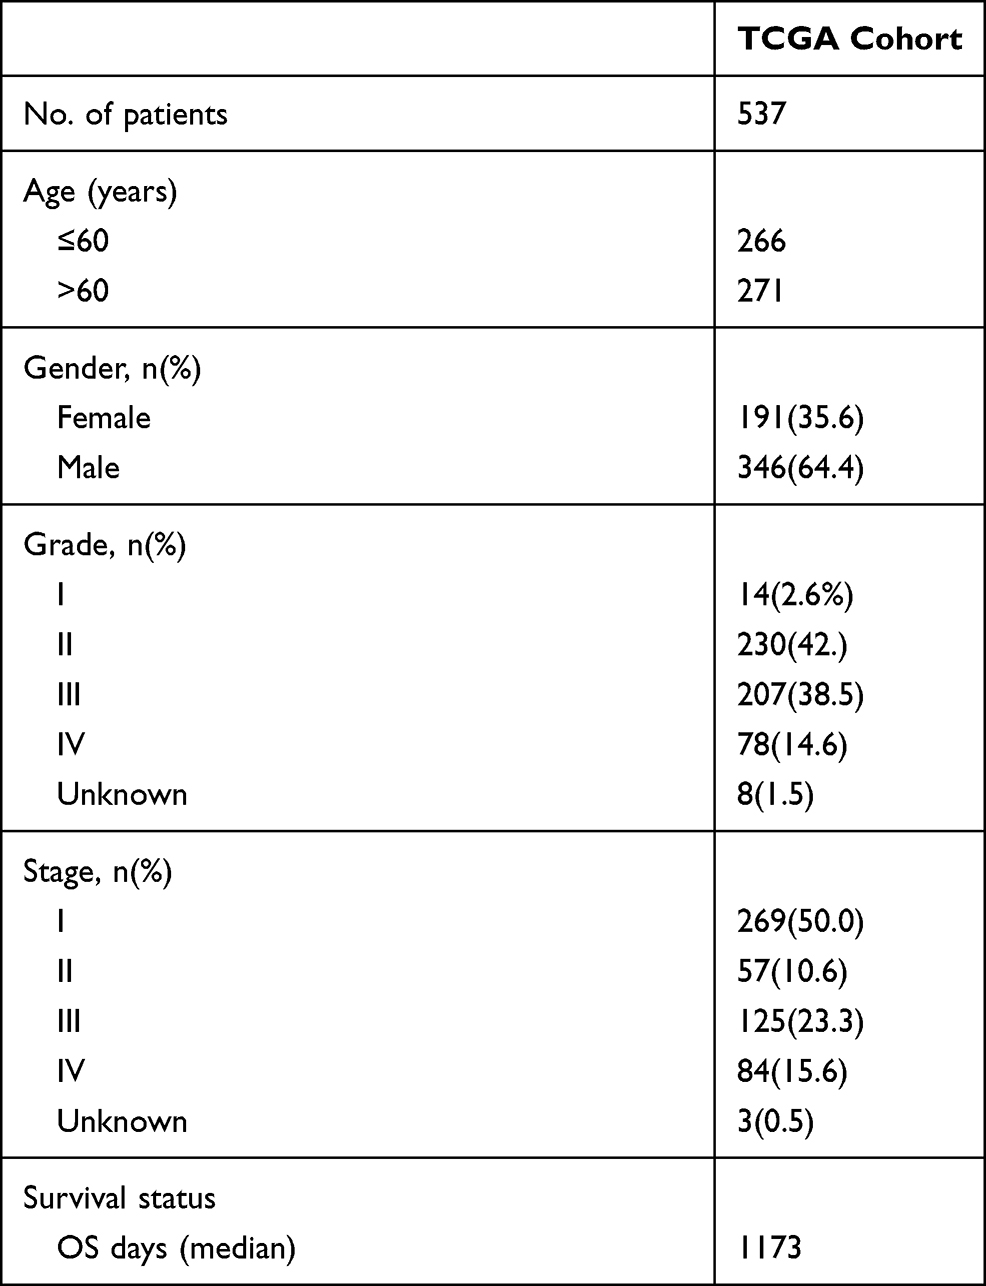 |
Table 1 Clinical Characteristics of Patients with KIRC Selected from the TCGA Cohort |
 |
Figure 1 Specific data collection and analysis flow chart. |
Identification of Differential Prognostic Genes Associated with Ferroptosis
According to various relevant indicators, the FRGs in the TCGA cohort were screened out and identified in Figure 2. Notably, the gene expression of FRGs was discrepantly expressed between tumor tissues and neighbouring normal tissues, which encountered statistical significance. Most of the genes associated with ferroptosis were differentially expressed (50/58, 86.2%) (Figure 2A), considering the criteria for FDR <0.05 and [log2 (fold change)]>1, we finally obtained 26 regulated FRGs, heatmaps of these FRGs between normal tissue and ccRCC were illustrated (Figure 2B), with blue squares representing the low expressed genes and red for the high expressed genes. After univariate Cox regression analysis, 26 genes of them were confirmed to be related to OS (Figure 2C). Therefore, these 26 genes were included in the subsequent prognostic analysis. The interaction network diagram among these genes hinted out ACACA, FADS2, HMGCR and ACSL3 as the central genes (obtained by MCC algorithm in Cytoscape software) (Figure 2D). Furthermore, Figure 2E shows the correlations between these genes.
 |
Figure 2 Identification of candidate FGRs in TCGA cohort. (A) The Venn diagram demonstrated the relationship between prognostic genes and DEGs. (B) The heat map shows the expression difference of 26 intersection genes in different tissues. (C) Univariate regression forest plot of 26 intersection gene expression. (D) The network of 26 candidate genes downloaded from STRING database, stray genes has been removed. (E) Demonstration of candidate gene-related networks, different colors represent different correlation coefficients. |
Construction of the TCGA Prognostic Model
According to the expression arrays of 26 genes obtained from the previous analysis, the prognosis model was established by Lasso Cox regression analysis. After regression analysis, the optimal 12 genes and their corresponding correlation coefficients were obtained (Figure 3). The risk score was expressed as the corresponding gene multiplied by its coefficient, such as (AKR1C1×-0.0527) + (CARS1×0.7691) + … + (NOX1× 0.2608). After removing samples with incomplete clinical data, patients were grouped into two different risk groups, according to the median risk score in the available data, both high- and low-risk groups involved 263 cases (Figure 3A). As illustrated in Figure 3B, patients with a high-risk score had shorter survival times but higher mortality rates than those with low-risk scores. When another survival analysis was performed, for instance, the likelihood of survival shown by the Kaplan–Meier curve, survival was significantly higher in the low-risk group than in the high-risk group (P<0.001, Figure 3C). The ROC curve was applied to evaluate the predictive property of the OS risk score. The area under the curve (AUC) was 0.782 within 1 year, 0.740 within 2 years, and 0.743 within 3 years (Figure 3D). After PCA and T-SNE analysis, FRGs were reduced their dimension, then we found that patients in different risk groups were distributed in two different orientations (Figure 3E and F).
 |
Figure 3 Construction of survival and prognosis of the 12FGRs in the TCGA cohort. (A) Risk score distribution of ccRCC patients. (B) The distributions of OS-related indicators. (C) Kaplan–Meier curves for different risk groups. (D) The time-dependent ROC curves of patients with different risk levels, AUC of the curves indicated that the model has high accuracy. (E) PCA plot and (F) t-SNE analysis of the prognosis model confirmed that the distribution of patients in the two risk groups was discrete. |
Independent Prognostic Analysis of 12 Genes
To determine whether risk score could be used as an overall prognostic predictor independent of survival, we utilized univariate and multivariate Cox regression analyses to evaluate existing clinical indicators. In univariate Cox regression analysis, age group (>65 vs ≤65 years) showed HR = 1.638, 95% CI = 1.210–2.218, P = 0.001; gender (male/female) group, HR = 0.945, 95% CI = 0.691–1.291, P = 0.721; grade group (G3/G4 vs G1/G2), HR = 2.647, 95% CI = 1.872–3.742; stage group (III/IV vs I/II, HR = 3.938, 95% CI = 2.854–5.432, P < 0.001; risk group (high vs low), HR=3.469, 95% CI = 2.764–4.356 (p<0.001, Figure 4A). In multivariate Cox regression analysis, age group (>65 vs ≤65 years) showed HR = 1.455, 95% CI = 1.073–1.971, P = 0.016; grade group (G3/G4 vs G1/G2), HR = 1.394, 95% CI = 0.959–2.026, P = 0.081; stage group (III/IV vs I/II), HR = 2.584, 95% CI = 1.835–3.640, P < 0.001; risk group (high vs low), HR = 2.624, 95% CI = 2.039–3.377 (P < 0.001, Figure 4B). In conclusion, after adjusting for other confounding factors, age, stage and risk scores can be confirmed as the independent prognostic factor.
 |
Figure 4 Cox regression analysis was performed to clarify the influence of many factors on the survival of ccRCC patients. (A) Univariate regression analysis. (B) Multivariate regression analysis. |
Functional Analysis
In order to understand the biological functions and mechanisms between DEGs and ccRCC, we used GO enrichment analysis and KEGG pathway analysis on the DEGs underlying the different risk groups in this study. GO enrichment analysis divided into three parts, including cellular component (CC), molecule function (MF) and biological processes (BP), and the main biological processes involved them include a series of immune responses as shown in Figure 5A. (P. adjust < 0.05). Results of the KEGG pathway analysis revealed that DEGs were most significantly enriched in the following several pathways: cytokine–cytokine receptor interaction, viral protein interaction with cytokine and cytokine receptor, IL-17 signaling pathway (Figure 5B, P. adjust <0.05). Among them, the IL-17 signaling pathway, complement and coagulation cascades, NF-kappa B signaling pathway are obviously related to the mechanism of inflammation and immune response.
 |
Figure 5 GO and KEGG analysis results in the TCGA cohort. (A) GO enrichment analysis revealed the biological processes and molecular functions involved in 26 prognostic-related FRGs; (B) KEGG analysis shown the signaling pathways involved in 26 prognostic-related FRGs. |
To explore whether there were differences in immune-related states between the two groups of patients at different risk, ssGSEA analysis was used to score different immune cells and related immune pathways similarly (Figure 6). In terms of antigen presentation process, there were significant differences in ADCs, Macrophages, Tfh, APC_CO_stimulation, Cytolytic_activity and inflammation-promoting between the two different risk groups, and the high-score group has higher immunization grades than the low-score group. Furthermore, on ssGSEA analysis, the high-risk group also has significantly higher scores of inflammation-promoting and parainflammation than those in the low-risk group, which correspond to the enrichment of KEGG in the three inflammation-related pathways. In conclusion, among the results with significant differences, except the scores of iDCs, Mast_cells and Type_II_IFN_Response in the high-risk group were less than those in the low-risk group, all other scores were higher in the former than those in the latter.
 |
Figure 6 The boxplot of ssGSEA scores. (A) Score of 16 immune cells in different risk patients with ccRCC. (B) Different expression in different risk level groups of 13 immune-related functions; blue represents low risk, red represents high risk; *P< 0.05; **P< 0.01; ***P< 0.001. |
Discussion
In the existing study, we integrated 60 ferroptosis-related genes (FRGs) through database mining and literature search, and systematically analysed the 60 FRGs expression in ccRCC tissue and its relationship with prognosis of survival through Cox and Lasso regression model, ultimately selected 12 pivotal FRGs related to prognosis, successfully build a ccRCC prognosis prediction model. The result demonstrates that the high-risk group encountered obviously lower OS time than the low-risk group, predicts ccRCC patients within 3 years of survival rate of the area under the ROC curve AUC were greater than 0.7, suggests the model has a valid sensitivity and specificity of ideal model. Prognostic models of 12 FRGs were constructed and validated in an external cohort.
In addition, immune related pathways were found to be enriched in functional analysis. Some genes may induce or inhibit ferroptosis in tumors by regulating certain inhibitors, but their relevance to patient survival outcomes remains unclear. Notably, more than three-quarters (86.2%) of FRGs had differential expression in ccRCC tissues and adjacent non-tumor tissues, and 52% of the DEGs were significantly differentially expressed in univariate regression Cox analysis related to survival prognosis. This suggests that ferroptosis has a potential role in ccRCC. Therefore, it is meaningful to model the prognosis of ccRCC by FRGs.
The prognosis model constructed in this study was composed of 12 FGRs, including AKR1C1, CARS1, CD44, DPP4, FANCD2, HMGCR, MT1G, NCOA4, SLC7A11, ACACA, NOX1, GOT1. There are relevant studies to confirm that AKR1C1 expression level is strongly correlated between AKR1C1 expression level, cell malignant transformation and resistance to cancer therapy, and AKR1C family serves as a new therapeutic target holding great promise in cancer treatment.20 CD44 expression has the effect of suppressed ferroptosis through relying upon OTUB1 manner in cancer cells.21 It is located in the basal membrane and lateral membrane of the kidney, and is a marker for cancer stem cell-like cells in RCC. In healthy individuals, CD44 is almost not expressed in the kidney, but is highly expressed in ccRCC, which may be related to the elevated expression levels of MMP2 and MMP9.22 Owing to DPP4 activity in human urine is positively correlated with a number of indicators for evaluating the renal function, such as serum creatinine levels, proteinuria, therefore DPP4 activity in urinary could be viewed as a biomarker to predict and judge the occurrence and progression of renal disease.23 Ferroptosis was inhibited when DPP4 activity was blocked by the tumor suppressor p53.24 As a nucleoprotein involved in DNA damage repair, FANCD2 can protect bone marrow stromal cells (BMSCs) from ferroptosis-mediated injury. Mechanically, FANCD2 mainly inhibits iron accumulation and lipid peroxidation during fertilization through transcription-dependent and non-dependent mechanisms. FANCD2-deficient BMSCs were more sensitive to ferroptosis induced by erastin and had increased DNA damage.25 The expression of MT1G in renal clear cell carcinoma cells was higher than that in other histologic tumor subtypes (P<0.05) and may be an important prognostic factor for ccRCC.26 It has been reported that when ferritin phagocytosis of NCO4-related genes in ccRCC is in a low expression state, it can reduce immune cell infiltration and lead to impaired IFN-γ receptor signaling pathway. Therefore, NCOA4 is expected to serve as a new biomarker to identify those patients who are potentially suitable for the ferroptosis-induction therapy or combined immunotherapy.15 Cysteine, as a precursor of glutathione, can be converted from cysteine transported into the cell by the Xc– system.27 This system is constituted of the light-chain subunit SLC7A11 and the heavy-chain subunit SLC3A2. Extracellular cystine is imported with intracellular glutamate release, on account of SLC7A11 is specific for the Xc– system, SLC7A11 act as an important transporter to maintain the homeostasis of cystine in cells.28 SLC7A11 also has been found to be overexpressed in renal collecting duct carcinoma compared with matched non-tumor tissues.29 Some studies have shown that high expression of FANCD2, CARS and SLC7A11, and low expression of HMGCR and NCOA4 are associated with high-risk ccRCC patients similarly, which is the same as the results of our study.30 In conclusion, these genes may promote or inhibit the progression of ccRCC to some extent, but whether all of these genes can influence the prognosis of ccRCC patients through ferroptosis mechanism remains to be further investigated.
The mechanism of tumor susceptibility to ferroptosis has been a hot research area in the past literature, but the potential regulatory mechanism between tumor immunity and ferroptosis still remains unclear. When GO and KEGG enrichment analysis on the differential risk DEG genes was performed, we found that a number of biological pathways and functions involved in immunity were associated with. Therefore, we can conclude that ferroptosis is tightly linked to tumor immunity, or ferroptosis may affect the progress of ccRCC through immune mechanism. Notably, in the ssGSEA analysis, we found significant differences in the antigen presentation process between the high- and low-risk groups, which may be caused by the ferroptosis cells releasing some signals to attract the antigen presenting cells; thus, the antigen presentation process occurs, leading to the activation of the immune stress response. Recent research also suggests that the immune system may prevent tumorigenesis in part through ferroptosis mechanisms.31 In addition, CD8+T cell, macrophages were remarkably higher in the high-risk group, which is possibly because CD8+T cell accumulation in RCC is associated with disease progression,32 CD8+ T cells play a central role in immunotherapy, and higher CD8+ T cell levels are associated with poorer prognosis in patients with ccRCC33; macrophage migration inhibitory factor (MIF), as a cytokine mediating the interaction between malignant cells and innate immune system, has attracted much attention in recent years for its role in tumorigenesis. Negative expression of MIF has been proved to be an independent prognostic marker in ccRCC patients.34 In addition, higher risk scores were strongly associated with inflammation. In KEGG functional analysis, FRGs were also enriched in some inflammation-related pathways, such as IL-17 and NF-kB signal pathway. Studies have shown that IL-17 gene and protein expression are significantly elevated in the blood and tumors of patients with ccRCC,35 and some genes promote the progression of ccRCC by regulating the NF-κB signaling pathway.36 Rhein has been confirmed that it has the ability to inhibit the proliferation of RCC cells through the NF-kB pathway and reduce the migration and invasion of RCC cells.37 In conclusion, CD8+T cell, macrophages, and inflammatory responses may be associated with the poor prognosis of ccRCC.
There are still some deficiencies in the process and method of this study. First, the establishment of this prognostic model established in our study is limited by race, region, sample size and other factors. Therefore, the robustness of the model needs to be further improved. Second, due to the limitation of clinical data, this study did not cover the subtypes of kidney renal clear cell carcinoma, so the significance of guiding the treatment strategies for specific subtypes remains to be further studied. In a word, 12 prognostic models of FRGs were constructed, and independent prognostic factors associated with ccRCC were discussed in this study. The potential mechanism of FRGs in ccRCC needs further experimental study and continuous improvement.
Ethical Approval
Our study did not involve any experiment on humans or animals; therefore, no ethical approval was obtained.
Funding
This work was supported by the National Natural Science Foundation of China (grant number 81873300); the Capital Health Research and Development of Special (grant number 2018-2-4173); and the Fundamental Research Funds for the Central public welfare research institutes (grant number ZZ11-023).
Disclosure
The authors declare no conflicts of interest in this work.
References
1. Akhtar M, Al-Bozom IA, Al Hussain T. Molecular and metabolic basis of clear cell carcinoma of the kidney. Adv Anat Pathol. 2018;25(3):189–196. doi:10.1097/PAP.0000000000000185
2. Luo Y, Shen D, Chen L, et al. Identification of 9 key genes and small molecule drugs in clear cell renal cell carcinoma. Aging. 2019;11(16):6029–6052. doi:10.18632/aging.102161
3. Jonasch E, Gao J, Rathmell WK. Renal cell carcinoma. BMJ. 2014;349:g4797.
4. Inamura K. Renal cell tumors: understanding their molecular pathological epidemiology and the 2016 WHO classification. Int J Mol Sci. 2017;18(10):2195. doi:10.3390/ijms18102195
5. Ljungberg B, Bensalah K, Canfield S, et al. EAU guidelines on renal cell carcinoma: 2014 update. Eur Urol. 2015;67(5):913–924. doi:10.1016/j.eururo.2015.01.005
6. Petejova N, Martinek A. Renal cell carcinoma: review of etiology, pathophysiology and risk factors. Biomed Pap Med Fac Univ Palacky Olomouc Czech Repub. 2016;160(2):183–194. doi:10.5507/bp.2015.050
7. Makhov P, Joshi S, Ghatalia P, Kutikov A, Uzzo RG, Kolenko VM. Resistance to systemic therapies in clear cell renal cell carcinoma: mechanisms and management strategies. Mol Cancer Ther. 2018;17(7):1355–1364. doi:10.1158/1535-7163.MCT-17-1299
8. Xu WH, Xu Y, Wang J, et al. Prognostic value and immune infiltration of novel signatures in clear cell renal cell carcinoma microenvironment. Aging. 2019;11(17):6999–7020. doi:10.18632/aging.102233
9. Liang C, Zhang X, Yang M, Dong X. Recent progress in ferroptosis inducers for cancer therapy. Adv Mater. 2019;31(51):e1904197. doi:10.1002/adma.201904197
10. Hirschhorn T, Stockwell BR. The development of the concept of ferroptosis. Free Radic Biol Med. 2019;133:130–143. doi:10.1016/j.freeradbiomed.2018.09.043
11. Mou Y, Wang J, Wu J, et al. Ferroptosis, a new form of cell death: opportunities and challenges in cancer. J Hematol Oncol. 2019;12(1):34. doi:10.1186/s13045-019-0720-y
12. Hassannia B, Vandenabeele P, Vanden Berghe T. Targeting ferroptosis to iron out cancer. Cancer Cell. 2019;35(6):830–849. doi:10.1016/j.ccell.2019.04.002
13. Bebber CM, Müller F, Prieto Clemente L, Weber J, von Karstedt S. Ferroptosis in cancer cell biology. Cancers. 2020;12(1):164. doi:10.3390/cancers12010164
14. Tang S, Xiao X. Ferroptosis and kidney diseases. Int Urol Nephrol. 2020;52(3):497–503. doi:10.1007/s11255-019-02335-7
15. Mou Y, Wu J, Zhang Y, Abdihamid O, Duan C, Li B. Low expression of ferritinophagy-related NCOA4 gene in relation to unfavorable outcome and defective immune cells infiltration in clear cell renal carcinoma. BMC Cancer. 2021;21(1):18. doi:10.1186/s12885-020-07726-z
16. Liang JY, Wang DS, Lin HC, et al. A novel ferroptosis-related gene signature for overall survival prediction in patients with hepatocellular carcinoma. Int J Biol Sci. 2020;16(13):2430–2441. doi:10.7150/ijbs.45050
17. Liu HJ, Hu HM, Li GZ, et al. Ferroptosis-related gene signature predicts glioma cell death and glioma patient progression. Front Cell Dev Biol. 2020;8:538. doi:10.3389/fcell.2020.00538
18. Jiang Y, Mao C, Yang R, et al. EGLN1/c-Myc induced lymphoid-specific helicase inhibits ferroptosis through lipid metabolic gene expression changes. Theranostics. 2017;7(13):3293–3305. doi:10.7150/thno.19988
19. Wang Y, Yin C, Geng L, Cai W. Immune infiltration landscape in clear cell renal cell carcinoma implications. Front Oncol. 2020;10:491621. doi:10.3389/fonc.2020.491621
20. Zeng CM, Chang LL, Ying MD, et al. Aldo-keto reductase AKR1C1-AKR1C4: functions, regulation, and intervention for anti-cancer therapy. Front Pharmacol. 2017;8:119. doi:10.3389/fphar.2017.00119
21. Liu T, Jiang L, Tavana O, Gu W. The deubiquitylase OTUB1 mediates ferroptosis via stabilization of SLC7A11. Cancer Res. 2019;79(8):1913–1924. doi:10.1158/0008-5472.CAN-18-3037
22. Lee YM, Kim JM, Lee HJ, Seong IO, Kim KH. Immunohistochemical expression of CD44, matrix metalloproteinase2 and matrix metalloproteinase9 in renal cell carcinomas. Urol Oncol. 2019;37(10):742–748. doi:10.1016/j.urolonc.2019.04.017
23. Benetti A, Martins FL, Sene LB, et al. Urinary DPP4 correlates with renal dysfunction, and DPP4 inhibition protects against the reduction in megalin and podocin expression in experimental CKD. Am J Physiol Renal Physiol. 2021;320(3):F285–F296. doi:10.1152/ajprenal.00288.2020
24. Xie Y, Zhu S, Song X, et al. The tumor suppressor p53 limits ferroptosis by blocking DPP4 activity. Cell Rep. 2017;20(7):1692–1704. doi:10.1016/j.celrep.2017.07.055
25. Song X, Xie Y, Kang R, et al. FANCD2 protects against bone marrow injury from ferroptosis. Biochem Biophys Res Commun. 2016;480(3):443–449. doi:10.1016/j.bbrc.2016.10.068
26. Maleckaite R, Zalimas A, Bakavicius A, Jankevicius F, Jarmalaite S, Daniunaite K. DNA methylation of metallothionein genes is associated with the clinical features of renal cell carcinoma. Oncol Rep. 2019;41(6):3535–3544.
27. Ding C, Ding X, Zheng J, et al. miR-182-5p and miR-378a-3p regulate ferroptosis in I/R-induced renal injury. Cell Death Dis. 2020;11(10):929. doi:10.1038/s41419-020-03135-z
28. Lin W, Wang C, Liu G, et al. SLC7A11/xCT in cancer: biological functions and therapeutic implications. Am J Cancer Res. 2020;10(10):3106–3126.
29. Wang J, Papanicolau-Sengos A, Chintala S, et al. Collecting duct carcinoma of the kidney is associated with CDKN2A deletion and SLC family gene up-regulation. Oncotarget. 2016;7(21):29901–29915. doi:10.18632/oncotarget.9093
30. Wu G, Wang Q, Xu Y, Li Q, Cheng L. A new survival model based on ferroptosis-related genes for prognostic prediction in clear cell renal cell carcinoma. Aging. 2020;12(14):14933–14948. doi:10.18632/aging.103553
31. Stockwell BR, Jiang X. A physiological function for ferroptosis in tumor suppression by the immune system. Cell Metab. 2019;30(1):14–15. doi:10.1016/j.cmet.2019.06.012
32. Qi Y, Xia Y, Lin Z, et al. Tumor-infiltrating CD39(+)CD8(+) T cells determine poor prognosis and immune evasion in clear cell renal cell carcinoma patients. Cancer Immunol Immunother. 2020;69(8):1565–1576. doi:10.1007/s00262-020-02563-2
33. Lin J, Yu M, Xu X, et al. Identification of biomarkers related to CD8(+) T cell infiltration with gene co-expression network in clear cell renal cell carcinoma. Aging. 2020;12(4):3694–3712. doi:10.18632/aging.102841
34. An HJ, Koh HM, Lee JS, Song DH. Prognostic role of macrophage migration inhibitory factor in patients with clear cell renal cell carcinoma. Medicine. 2020;99(50):e23277. doi:10.1097/MD.0000000000023277
35. Guan X, Liu Z, Zhang J, Jin X. Myeloid-derived suppressor cell accumulation in renal cell carcinoma is correlated with CCL2, IL-17 and IL-18 expression in blood and tumors. Adv Clin Exp Med. 2018;27(7):947–953. doi:10.17219/acem/70065
36. Wang Y, Su J, Wang Y, et al. The interaction of YBX1 with G3BP1 promotes renal cell carcinoma cell metastasis via YBX1/G3BP1-SPP1- NF-κB signaling axis. J Exp Clin Cancer Res. 2019;38(1):386. doi:10.1186/s13046-019-1347-0
37. Ma YL, Chen F, Shi J. Rhein inhibits malignant phenotypes of human renal cell carcinoma by impacting on MAPK/NF-κB signaling pathways. Onco Targets Ther. 2018;11:1385–1394. doi:10.2147/OTT.S153798
 © 2021 The Author(s). This work is published and licensed by Dove Medical Press Limited. The
full terms of this license are available at https://www.dovepress.com/terms
and incorporate the Creative Commons Attribution
- Non Commercial (unported, 3.0) License.
By accessing the work you hereby accept the Terms. Non-commercial uses of the work are permitted
without any further permission from Dove Medical Press Limited, provided the work is properly
attributed. For permission for commercial use of this work, please see paragraphs 4.2 and 5 of our Terms.
© 2021 The Author(s). This work is published and licensed by Dove Medical Press Limited. The
full terms of this license are available at https://www.dovepress.com/terms
and incorporate the Creative Commons Attribution
- Non Commercial (unported, 3.0) License.
By accessing the work you hereby accept the Terms. Non-commercial uses of the work are permitted
without any further permission from Dove Medical Press Limited, provided the work is properly
attributed. For permission for commercial use of this work, please see paragraphs 4.2 and 5 of our Terms.