Back to Journals » Diabetes, Metabolic Syndrome and Obesity » Volume 15
Analysis of Blood Pressure and Ventilation Efficiency in Different Types of Obesity Aged 40–60 Years by Cardiopulmonary Exercise Test
Authors Hao X ![]() , He H, Tao L
, He H, Tao L ![]() , Wang H, Zhao L
, Wang H, Zhao L ![]() , Ren Y, Wang P
, Ren Y, Wang P ![]()
Received 24 June 2022
Accepted for publication 11 October 2022
Published 19 October 2022 Volume 2022:15 Pages 3195—3203
DOI https://doi.org/10.2147/DMSO.S379897
Checked for plagiarism Yes
Review by Single anonymous peer review
Peer reviewer comments 2
Editor who approved publication: Prof. Dr. Antonio Brunetti
Xiaoyan Hao, Honghai He, Liyuan Tao, Hongli Wang, Lili Zhao, Yi Ren, Peng Wang
Medical Examination Center, Peking University, Third Hospital, Beijing, People’s Republic of China
Correspondence: Peng Wang, Medical Examination Center, Peking University, Third Hospital, North Garden Road & 49, Beijing, People’s Republic of China, Tel +86-10-82266969, Fax +86-21-82265999, Email [email protected]
Purpose: This study investigated blood pressure and ventilation efficiency by cardiopulmonary exercise test (CPX) in different types of obesity aged 40– 60 years.
Material and Methods: The inclusion criteria of this cross-sectional study were adults aged 40– 60 years underwent health checks. CPX was measured according to the relevant standards. According to different body mass index (BMI), there were 3 groups, BMI< 24 (kg/m2), 24≤BMI< 28 (kg/m2) and BMI≥ 28 (kg/m2). There were two groups in male, waist circumference≥ 90 (cm) and waist circumference< 90 (cm). Similarly, there were two groups in female, waist circumference≥ 85 (cm) and waist circumference< 85 (cm).
Results: There were 543 individuals (64.6% male and 35.4% female) aged 40– 60 years in this study. The resting blood pressure (BP) and peak BP have the significant differences in different BMI groups (p < 0.001) and male or female groups (p < 0.001). However, the resting DBP (77.70± 9.45 vs 81.16± 8.80, p < 0.001) and peak DBP (85.67± 10.21 vs 89.03± 9.94, p = 0.002) have the significant differences in different male waist circumference groups, and the resting BP (SBP 113.76± 14.29 vs 121.86± 15.54, p = 0.001, DBP 71.95± 10.83 vs 77.27± 11.42, p = 0.005) has the significant differences in different female waist circumference groups. Carbon dioxide Ventilation equivalent (VE/VCO2) has the significant differences in different male waist circumference groups (26.84± 3.10 vs 27.68± 2.93, p = 0.009), but it has not the significant differences in different BMI groups and different female waist circumference groups. The oxygen pulse (VO2/HR) is slightly higher in female group than male group (0.93± 0.15 vs 0.89± 0.15, p = 0.001). Breathing reserve has the statistical significance in BMI ≥ 28 group compared with the BMI < 24 group (0.52± 0.13 vs 0.46± 0.17, ηp2=0.021).
Conclusion: We found that the blood pressure and ventilation efficiency of CPX were different between the obesity and normal. This will provide a basis for accurate cardiopulmonary assessment of obesity.
Keywords: resting blood pressure, peak blood pressure, carbon dioxide ventilation equivalent, central obesity
Introduction
The prevalence of obesity continues to rising in the worldwide rates.1–4 Obesity could cause the most metabolic diseases, such as diabetes, hypertension, metabolic syndrome, sleep apnea, cardiovascular disease, and eventually decreases the lifespan.5 Similarly, obesity has reached epidemic proportions in China, with 16.4% of Chinese adults had obesity (BMI 28.0kg/m2 or higher) and another 34.3% were overweight (24·0–27.9 kg/m2).6 Waist circumference is often used as a measure of central obesity, which complements the utility of BMI.7 The literature reports that there is a causal relationship between the increase of waist circumference and the risk of coronary heart disease.8 CPX is a well-established method for evaluating cardiopulmonary diseases,9–11 which provides an objective assessment of maximal aerobic capacity, peak blood pressure, resting blood pressure, electrocardiogram (ECG), VE/VCO2, VO2/HR, and respiratory reserve indexes.12 Compared with healthy controls, the maximal oxygen uptake measured is different in obese people.13 CPX has found important value in the assessment of heart, pulmonary and musculoskeletal disease/disorders.14,15 It is reported that exercise SBP would be a stronger predictor of future SBP, DBP rather than BP at rest in middle-aged men.16 VE/VCO2 general response ventilatory efficiency, the ventilation associated with eliminating a given level of metabolically produced CO2 as pulmonary CO2 output.17,18 However, the results of cardiopulmonary assessment are rarely reported in the literature in different types of obese people aged 40–60 years. This study sought to clarify the blood pressure and ventilation efficiency of cardiopulmonary assessment data in different types of obesity aged 40–60 years.
Materials and Methods
Subjects
Data were collected from May 2021 to July 2021 at the Medical Examination Center of Peking University Third Hospital. This study was conducted in accordance with the Declaration of Helsinki. All subjects provided written informed consent prior to participation in the study. Protocols involving human participants were reviewed and approved by the Institutional Ethics Committee of Peking University Third Hospital (project:M2021661). All subjects underwent cardiopulmonary exercise test assessment, including pulmonary function test, echocardiography at rest, and cardiopulmonary exercise test combined with exercise echocardiography, which was performed using the same equipment by the same experienced doctors and nurses. Obesity was diagnosed according to relevant guidelines and regulations.6,19,20 According to different BMI, there were 3 groups, BMI<24 (kg/m2), 24≤BMI<28 (kg/m2) and BMI≥28 (kg/m2).
Waist circumference is a key factor of central obesity, and it is also a measure of abdominal obesity.21 According to the criteria of abdominal adiposity,6,21 there were two groups in male, waist circumference≥90 (cm) and waist circumference<90 (cm). Similarly, there were two groups in female, waist circumference≥85 (cm) and waist circumference<85 (cm). Subjects were excluded if they had the following conditions,22,23 such as, severe arrhythmia, severe hypertension, hyperthyroidism, cardiac and cerebrovascular surgery (within 1 year), respiratory infectious diseases, gout, electrolyte disturbance, uncontrolled diabetes, heart failure. Therefore, the inclusion criteria were that adults aged 40–60 years underwent a physical examination.
Measurement of Cardiopulmonary Exercise Test
A physical examination, history, and CPX measurements were performed by a single trained health-care provider. Subject histories included family history, drug history, smoking status, and alcohol intake. The cardiopulmonary exercise test was performed according to the relevant standards24 using exercise cardiopulmonary tester (Quark PFT4 ergo, Cosmed, Italy).
CPX Instrument includes the following equipment: includes mass flow sensor, sensor cable, sample line, directional sense line, span 1 gas cylinder (16%O2, 5%CO2, balance N2), span 2 gas cylinder (21% O2, CH4 0.3%, CO 0.3%, balance nitrogen), 3L calibration syringe (Cosmed, Italy), 12-lead ECG and exercise stress testing system (Quark T12X, Cosmed, Italy), Cycle ergometer (Cosmed, Italy). Exercise testing was performed with a bicycle ergometer and breath-by-breath respiratory gas analysis system (Quark PFT4 ergo, Cosmed, Italy). Before the test, the male subjects shaved off the chest hair, and the female subjects avoided the menstrual period. Subjects were allowed to eat a bland diet for two hours before the test. The CPX environment is set as follows: room temperature 25–26°C, humidity 43–50%. Set the evaluation parameter standard: incremental power per minute (W) = [peak VO2 (mL/min) - unloaded VO2 (mL/min)]/100. Heart rate, blood pressure, electrocardiogram and pulmonary function test were monitored before exercise, and this blood pressure was the resting SBP, resting DBP. The above indicators needed to be tested during exercise: 3 minutes of rest, 3 minutes of warm-up period (no load), and load exercise (Borg score greater than 16 points) to the point where the cycling frequency cannot be maintained. The blood pressure was the peak SBP and peak DBP at the 15 second before stopping. After stopping exercise, the indicators were monitored in the recovery period for 1, 2, 4, and 6 minutes.
The following are obtained by cardiopulmonary assessment instrument, blood pressure (resting BP, peak BP), electrocardiogram (ECG), VE/VCO2 (anaerobic threshold), VO2/HR, respiratory reserve, VO2/WR. Respiratory reserve is the absolute value of the difference between MVV and maximum load exercise ventilation (VE). The average time for data smoothing is 10 second. According to the relevant standards and guidelines,25–27 the exercise test should be terminated if the following events occur: typical angina pectoris; obvious symptoms and signs, including dyspnea, pallor, cyanosis, dizziness, vertigo, unsteady gait, ataxia, ischemic claudication; increased discomfort or pain in the lower extremities with exercise; electrocardiogram ST-segment horizontal or downslope ≥0.15 mV or ST-segment elevation ≥2.0 mV; serious arrhythmias such as ventricular tachycardia, ventricular fibrillation, supraventricular tachycardia, frequent multifocal premature ventricular beats, atrial fibrillation; SBP does not increase or decrease during exercise >10 mmHg; SBP > 220 mmHg; exercise-induced intraventricular block; subject request termination due to feeling tired.
Measurement of Clinical Parameters
Body weight (kg) has been measured by using a digital weight scale. Standing height (m) has been measured with a wall mounted digital stadiometer. Waist circumference (cm) were measured by using a tape measure at the uppermost lateral border of the hip ilium. BMI was calculated as weight in kilograms divided by height in meters squared (kg/m2). 5mL of the subject’s blood was collected in a fasted state. Fasting plasma glucose (FPG), total cholesterol (TC), high-density lipoprotein (HDL), triglycerides (TG), Low-density lipoprotein-cholesterol (LDL-C), alanine aminotransferase (ALT), aspartate transaminase (AST) were using an autoanalyzer (Cobas c 501 autoanalyzer, Roche Diagnostics, Germany).
Statistical Analysis
Spss26.0 was used for statistical analysis. The measurement data conforming to the normal distribution were expressed by means ± standard deviation, and independent sample t-test or were used for inter group comparison. The measurement data that do not conform to the normal distribution are expressed by the median (quartile), and the Mann Whitney U-test or Kruskal–Wallis test are used for the comparison between groups. For the normal distribution test, the graphical method combined with the nonparametric test method (Kolmogorov-Smirnov test) was used to judge the normal distribution. Combined with statistical test and graphic method, the graphic method shows that it deviates from the normal distribution, and it is judged as not obeying the normal distribution. The counting data were expressed by the number of cases (percentage), and the chi square test was used for the comparison between groups. Partial eta-squared and 95% confidence interval was used to calculate effect size. Bonferroni corrections were applied for multiple comparisons. P-values <0.05 were considered statistically significant.
Results
Clinical Characteristics
A total of 573 adults participated in this study. Among these, 30 subjects were excluded for the following reasons: 3 did not sign an informed consent form, 5 did not provide a completed questionnaire, and 5 participants had inadequate blood samples, 17 did not have the BMI, blood pressure (Figure 1). A total of 543 adults aged 40–60 years (351 male, 192 female) were ultimately included in this study. The average ages were 49.06±5.82 years, and the average BMI was 24.61±3.02 kg/m2. The average FPG was 5.29±0.75 mmol/L. The average resting SBP, resting DBP, peak SBP, peak DBP were 120.56±14.93 mmHg, 77.14±10.40 mmHg, 177.00±24.99 mmHg, 85.30±11.23 mmHg, respectively. There were VE/VCO2, respiratory reserve, VO2/HR, ALT, AST, TC, TG, HDL-C, LDL-C in Table 1.
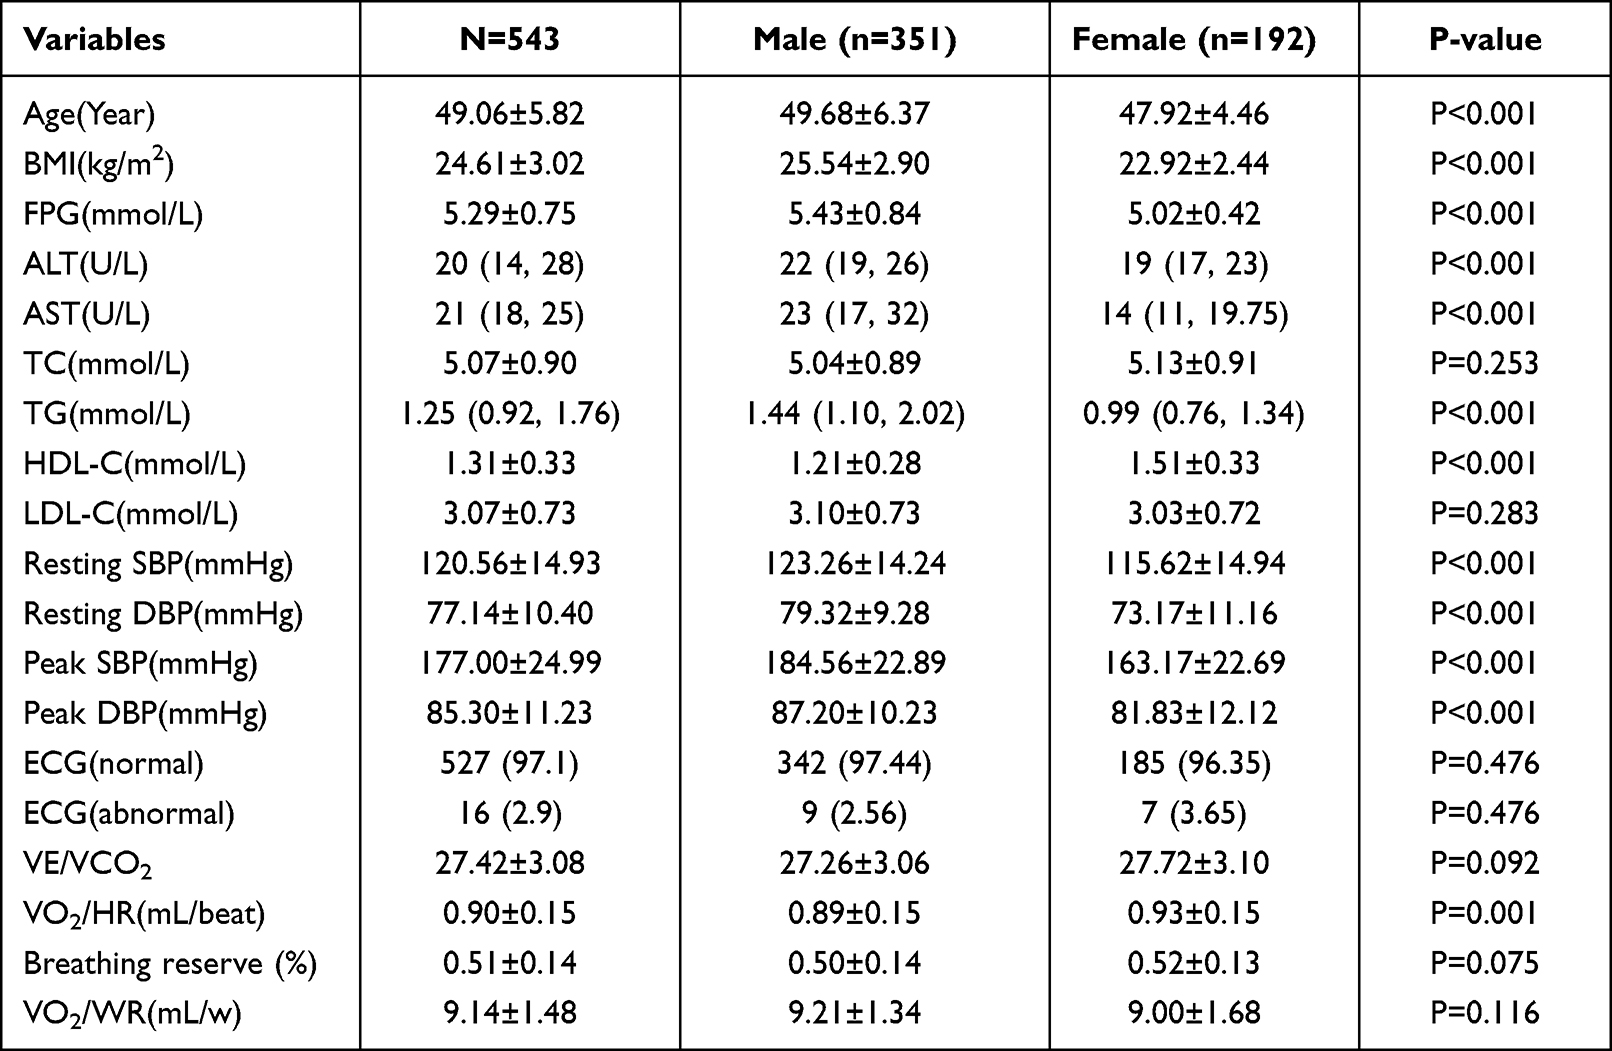 |
Table 1 Clinical Characteristics of the Study Subjects |
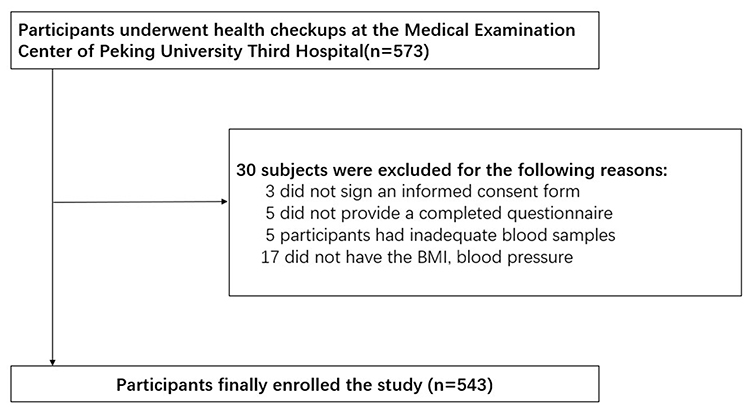 |
Figure 1 Flowchart for selection of study participants. |
Clinical Characteristics Between Male and Female
As shown in Table 1, the average ages of male and female were 49.68±6.37 and 47.92±4.46 years, respectively. The BMI of male and female were 25.54±2.90, 22.92±2.44 kg/m2, respectively. There were significant differences in age, BMI, FPG, ALT, AST, TG, HDL-C, resting SBP, resting DBP, peak SBP, peak DBP, VO2/HR between male and female groups (Table 1). Conversely, there was no statistical significance in TC, LDL-C, ECG, VE/VCO2, respiratory reserve and VO2/WR between the two groups.
Clinical Characteristics in Different BMI Groups
As shown in Table 2, there were 234 adults in BMI<24 group, 246 in 24≤BMI<28 group, 63 in BMI ≥28 group. There were significant differences in FPG, ALT, AST, TG, HDL-C, resting SBP, resting DBP, peak SBP, peak DBP, VO2/HR, respiratory reserve, VO2/WR in different BMI groups. The FPG in BMI groups were 5.15±0.60 mmol/L, 5.31±0.72 mmol/L, 5.69±1.13 mmol/L, respectively. Compared with the BMI<24 group, there have the statistical significance in ALT, AST, TG, HDL-C, resting SBP, resting DBP, peak SBP, peak DBP in other two groups. Evidently, the level of ALT and TG is increased with the increase of BMI. Moreover, breathing reserve has the statistical significance in BMI≥28 group compared with the BMI<24 group. VO2/WR in BMI groups were 9.13±1.54 mL/w, 9.15±1.49 mL/w, 9.12±1.22 mL/w, respectively. According to the eta-squared results, VO2/WR has not the significant differences in different BMI groups. Conversely, there was no statistical significance in age, TC, LDL-C, ECG, VE/VCO2, VO2/HR, VO2/WR in different BMI groups.
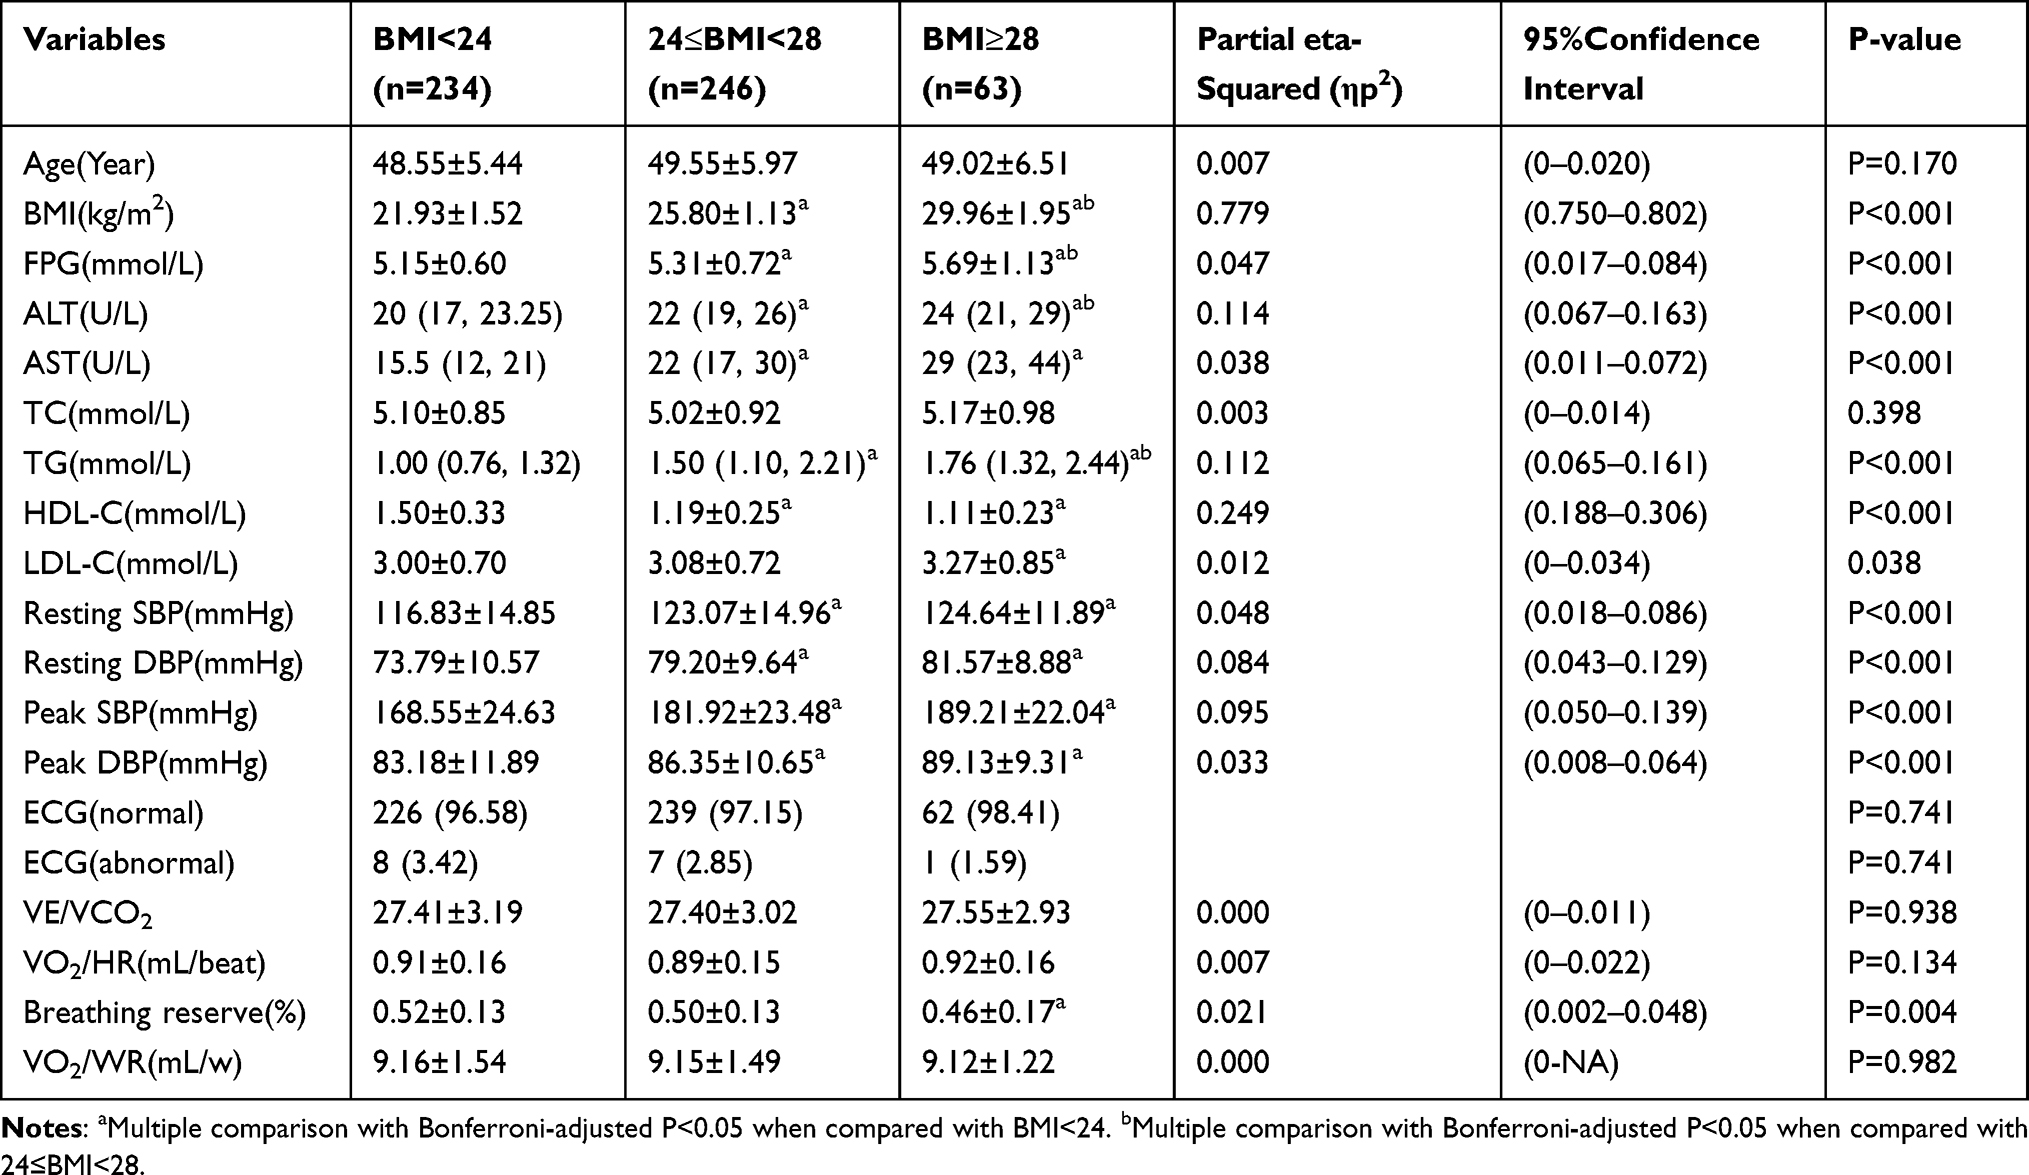 |
Table 2 Clinical Characteristics in Different BMI Groups |
Clinical Characteristics in Different Male Waist Circumference Groups
Table 3 shows the clinical characteristics in different male waist circumference groups. There were significant differences in BMI, resting DBP, peak DBP, VE/VCO2 in different waist circumference groups. The resting DBP in waist circumference groups (waist circumference <90 cm and waist circumference ≥90 cm) were 77.70±9.45 cm, 81.16±8.80 cm, respectively. The resting DBP is slightly higher in waist circumference ≥90 cm group than waist circumference <90 cm group. On the contrary, there was no statistical significance in resting SBP, Peak SBP, ECG, VO2/HR, respiratory reserve, VO2/WR in different waist circumference groups (Table 3).
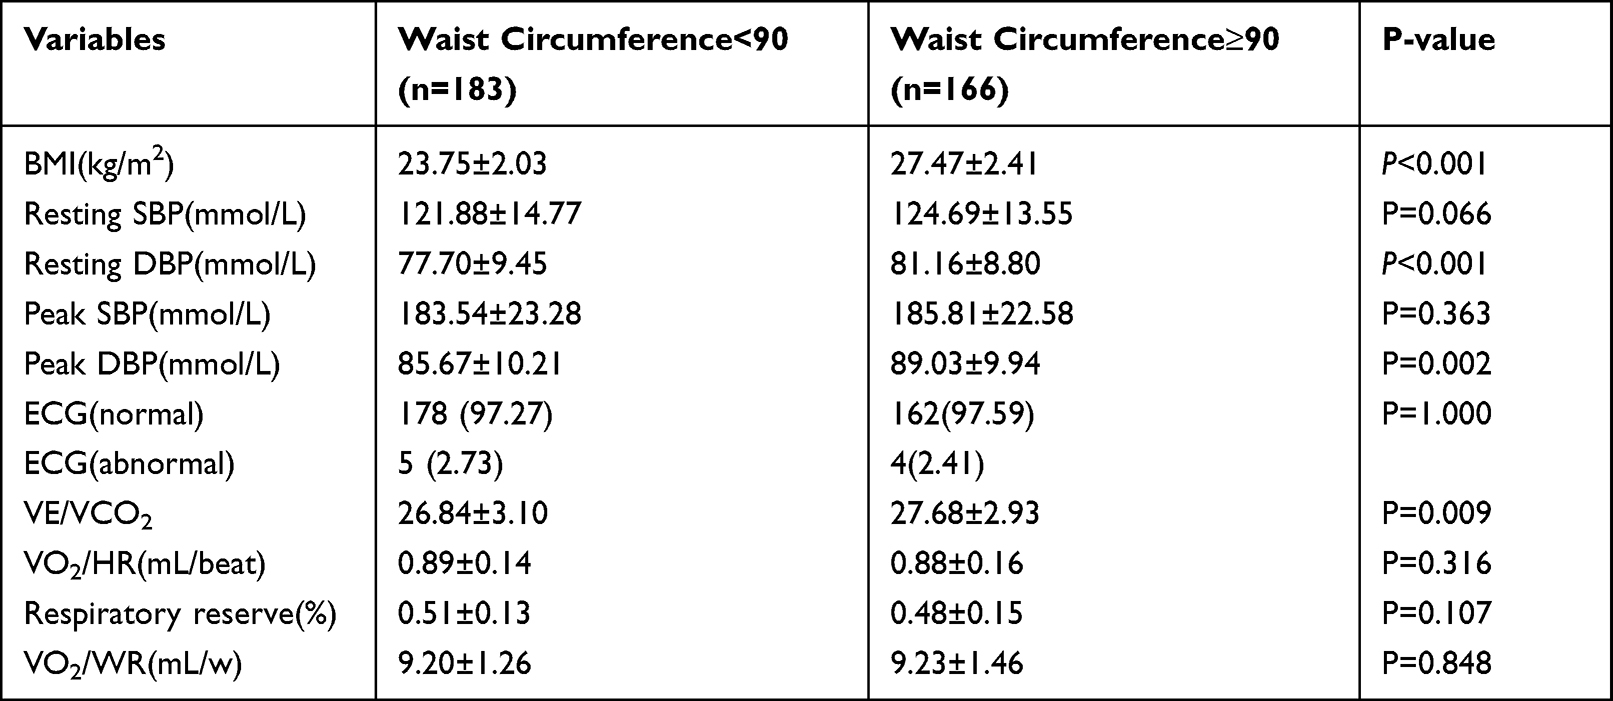 |
Table 3 Clinical Characteristics in Different Male Waist Circumference Groups |
Clinical Characteristics in Different Female Waist Circumference Groups
Table 4 shows the clinical characteristics in different female waist circumference groups. There were significant differences in BMI, resting SBP, resting DBP in different waist circumference groups. The resting DBP and resting SBP in waist circumference groups (waist circumference <85 cm and waist circumference ≥85 cm) were slightly different. The resting blood pressure is slightly higher in waist circumference ≥85 cm group than waist circumference <85 cm group. On the contrary, there was no statistical significance in peak BP, ECG, VE/VCO2, VO2/HR, respiratory reserve, VO2/WR in different waist circumference groups (Table 4).
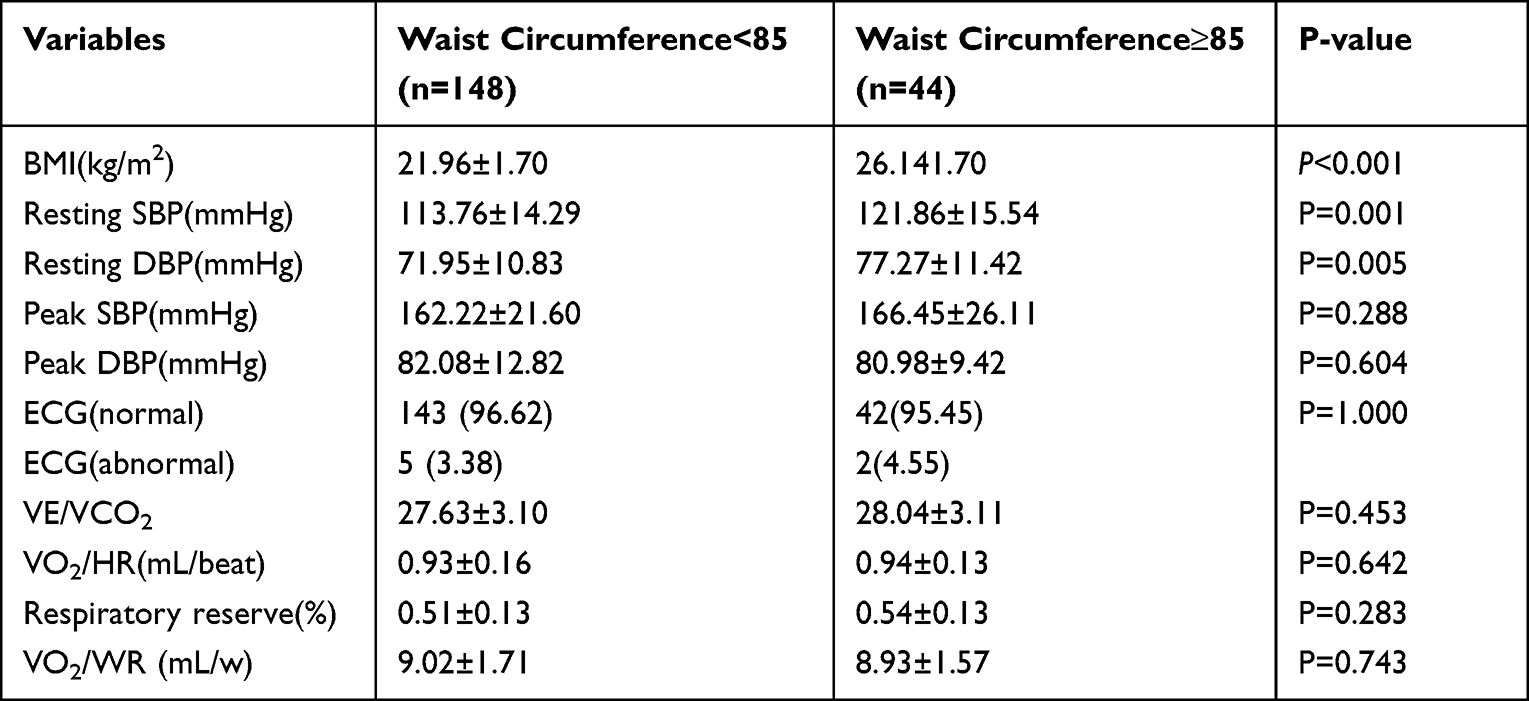 |
Table 4 Clinical Characteristics in Different Female Waist Circumference Groups |
Discussion
Our results indicate that blood pressure and ventilation efficiency have some differences in different types of obesity aged 40–60 years. Firstly, the average BMI was 24.61±3.02 kg/m2, which further suggest that adults aged 40–60 years have a higher BMI. Literatures reported that BMI was increased in individuals aged 40–60 years compared with those aged less than 40 years.28–30 The average FPG was 5.29±0.75 mmol/L in this study, and FPG is increased with the increase of BMI. Prior literature has reported that FPG is significantly increased in obese persons,31 and it was consistent with our research results. The reason may be that obesity was related with the progressive defect in insulin secretion progressive rise in insulin resistance.32 There were significant differences in HDL-C in different BMI groups and male or female groups. The HDL-C is decreased with the increase of BMI. Recent studies have shown that obesity alters the metabolism of HDL-C, which resulted the functional changes, eventually that reduces the HDL-C levels.33 In our study, the level of ALT and TG is increased with the increase of BMI. Previous literatures reported that the level of ALT and TG were associated with higher BMI,34,35 which were further supports our research results.
Secondly, the resting BP and peak BP have the significant differences in different BMI groups and male or female groups. However, the resting DBP and peak DBP have the significant differences in different male waist circumference groups, and the resting BP has the significant differences in different female waist circumference groups. Compared with the normal group, there have the statistical significance in resting SBP, resting DBP, peak SBP, peak DBP in other two obesity groups. It was reported that obesity and high blood pressure often coexist,36 which supports our results. The concomitant presence of obesity and hypertension is associated by a sympathetic activation.37 We speculate that sympathetic activation may be the pathophysiological mechanism linking obesity and hypertension.
Our results found that resting DBP have the statistically significant in the waist circumference groups. Previous literatures are supported our results, which are reported that resting DBP is related to the Metabolic diseases.38–41 There is a direct correlation between sympathetic activation and waist circumference, and the degree of sympathetic activation is greater in adults with visceral body fat distribution.37,42 The above related pathophysiological mechanisms may support our findings. It is clear that waist circumference is strong associated with metabolic diseases.43,44 VE/VCO2 has the significant differences in different male waist circumference groups, but it has not the significant differences in different BMI groups and different female waist circumference groups. Similarly, VE/VCO2 is slightly higher in waist circumference ≥90 cm group than waist circumference <90 cm. It is reported that the VE/VCO2 ratio at the anaerobic threshold analogous to the lowest VE/VCO2 ratio.45 Previous literature reported that the lowest VE/VCO2 ratio during exercise was the most reproducible and stable response relative to other indices of ventilatory inefficiency.46 Other literatures reported that VE/VCO2 ratio has the best capability to predict chronic thromboembolic pulmonary hypertension or heart failure.47,48 Therefore, the reason for different VE/VCO2 ratio in different types of obesity which is not known and warrant further studies. The VO2/HR is slightly higher in female group than male group. The VO2/HR is one of the commonly used indexes to evaluate cardiac function.49 It is reported that the highest maximal VO2/HR was observed in the 3 age groups among men and women, with no significant difference between these age groups (20–29 years, 30–39 years, 40–49 years).50 Previous report material on VO2/HR in healthy populations is based upon small studies in athletes.51 Therefore, the reason for different in VO2/HR between female group and male group which is not known and warrant further studies. The breathing reserve has the significant differences in different BMI groups. Our results found that breathing reserve has the statistical significance in BMI ≥28 group compared with the BMI <24 group. It is reported that breathing reserve was decreased in obesity, because obesity with impaired respiratory compliance may have ventilation defects, which will affect the respiratory reserve.52 These are consistent with our results. Collectively, obesity due to different BMI could affect the cardiopulmonary function, such as resting BP, peak BP, breathing reserve. Abdominal obesity could affect the VE/VCO2 and resting BP. These results indicate that normal BMI and waist circumference could maintain good ventilation efficiency and blood pressure.
Limitations
Our results should be considered in the context of several limitations. First, compared with BMI<24 group and 24≤BMI<28 group, BMI≥28 group sample size was small. Therefore, this heterogeneity may have influenced the absence of a significant difference in some variables, such as: VE/VCO2, VO2/HR, VO2/WR, LDL-C, TC. We will expand the sample size in the future. Second, obesity is intimately associated with metabolic function, and we will study the link between metabolism function, obesity, blood pressure and ventilation efficiency in the future.
Conclusions
Our results demonstrate that the blood pressure and ventilation efficiency of CPX is different between the obesity and normal. Obesity could affect the cardiopulmonary function. This will provide a theoretical basis for the health guidance of improving cardiopulmonary function in obese people.
Acknowledgments
We thank all study participants for their cooperation.
Funding
This study was funded by the National Key R&D Program of China (2018YFC1704400).
Disclosure
The authors declare no conflicts of interest in this work.
References
1. Mokdad AH, Ford ES, Bowman BA, et al. Prevalence of obesity, diabetes, and obesity-related health risk factors, 2001. JAMA. 2003;289(1):76–79. doi:10.1001/jama.289.1.76
2. Wyatt HR. The prevalence of obesity. Prim Care. 2003;30(2):267–279. doi:10.1016/S0095-4543(03)00006-X
3. Al-Sendi AM, Shetty P, Musaiger AO. Prevalence of overweight and obesity among Bahraini adolescents: a comparison between three different sets of criteria. Eur J Clin Nutr. 2003;57(3):471–474. doi:10.1038/sj.ejcn.1601560
4. Gillison FB, Killen V, Grey EB, Standage M, Watson D, Kremers SPJ. Influence of obesity prevalence on social norms and weight control motivation: a cross-sectional comparison of the Netherlands and the UK. Psychol Health Med. 2022;27(5):987–998. doi:10.1080/13548506.2020.1829654
5. Ng M, Fleming T, Robinson M, et al. Global, regional, and national prevalence of overweight and obesity in children and adults during 1980–2013: a systematic analysis for the Global Burden of Disease Study 2013. Lancet. 2014;384(9945):766–781. doi:10.1016/S0140-6736(14)60460-8
6. Zeng Q, Li N, Pan XF, Chen L, Pan A. Clinical management and treatment of obesity in China. Lancet Diabetes Endocrinol. 2021;9(6):393–405. doi:10.1016/S2213-8587(21)00047-4
7. Ross R, Neeland IJ, Yamashita S, et al. Waist circumference as a vital sign in clinical practice: a consensus statement from the IAS and ICCR Working Group on Visceral Obesity. Nat Rev Endocrinol. 2020;16(3):177–189. doi:10.1038/s41574-019-0310-7
8. Chen Q, Li L, Yi J, et al. Waist circumference increases risk of coronary heart disease: evidence from a Mendelian randomization study. Mol Genet Genomic Med. 2020;8(4):e1186. doi:10.1002/mgg3.1186
9. Franco V. Cardiopulmonary exercise test in chronic heart failure: beyond peak oxygen consumption. Curr Heart Fail Rep. 2011;8(1):45–50. doi:10.1007/s11897-010-0042-4
10. Correale M, Passero T, Totaro A, et al. Cardiopulmonary exercise test predicts sustained ventricular arrhythmias in chronic heart failure. Neth Heart J. 2013;21(1):36–43. doi:10.1007/s12471-012-0339-x
11. Agostoni P, Dumitrescu D. How to perform and report a cardiopulmonary exercise test in patients with chronic heart failure. Int J Cardiol. 2019;288:107–113. doi:10.1016/j.ijcard.2019.04.053
12. Levett DZH, Jack S, Swart M, et al. Perioperative cardiopulmonary exercise testing (CPET): consensus clinical guidelines on indications, organization, conduct, and physiological interpretation. Br J Anaesth. 2018;120(3):484–500. doi:10.1016/j.bja.2017.10.020
13. Gruchala-Niedoszytko M, Niedoszytko P, Kaczkan M, et al. Cardiopulmonary exercise test and bioimpedance as prediction tools to predict the outcomes of obesity treatment. Polish Archiv Internal Med. 2019;129(4):225–233. doi:10.20452/pamw.4480
14. Guazzi M, Adams V, Conraads V, et al. EACPR/AHA scientific statement. Clinical recommendations for cardiopulmonary exercise testing data assessment in specific patient populations. Circulation. 2012;126(18):2261–2274. doi:10.1161/CIR.0b013e31826fb946
15. Guazzi M, Arena R, Halle M, Piepoli MF, Myers J, Lavie CJ. 2016 focused update: clinical recommendations for cardiopulmonary exercise testing data assessment in specific patient populations. Circulation. 2016;133(24):e694–e711. doi:10.1161/CIR.0000000000000406
16. Ito K, Iwane M, Miyai N, et al. Exaggerated exercise blood pressure response in middle-aged men as a predictor of future blood pressure: a 10-year follow-up. Clin Exp Hypertens. 2016;38(8):696–700. doi:10.1080/10641963.2016.1200597
17. American Thoracic S; American College of Chest P. ATS/ACCP statement on cardiopulmonary exercise testing. Am J Respir Crit Care Med. 2003;167(2):211–277.
18. Ward SA. Ventilation/carbon dioxide output relationships during exercise in health. Eur Respir Rev. 2021;30(160):200160. doi:10.1183/16000617.0160-2020
19. Abrantes MM, Lamounier JA, Colosimo EA. Prevalência de sobrepeso e obesidade nas regiões Nordeste e Sudeste do Brasil [Overweight and obesity prevalence in Northeast and Southeast Regions of Brazil]. Rev Assoc Med Bras. 2003;49(2):162–166. Portuguese. doi:10.1590/S0104-42302003000200034
20. Daumit GL, Clark JM, Steinwachs DM, Graham CM, Lehman A, Ford DE. Prevalence and correlates of obesity in a community sample of individuals with severe and persistent mental illness. J Nerv Ment Dis. 2003;191(12):799–805. doi:10.1097/01.nmd.0000100923.20188.2d
21. Jayedi A, Soltani S, Zargar MS, Khan TA, Shab-Bidar S. Central fatness and risk of all cause mortality: systematic review and dose-response meta-analysis of 72 prospective cohort studies. BMJ. 2020;370:m3324. doi:10.1136/bmj.m3324
22. White RD, Evans CH. Performing the exercise test. Prim Care. 2001;28(1):29–53,vi. doi:10.1016/S0095-4543(05)70006-3
23. Berry NC, Manyoo A, Oldham WM, et al. Protocol for exercise hemodynamic assessment: performing an invasive cardiopulmonary exercise test in clinical practice. Pulm Circ. 2015;5(4):610–618. doi:10.1086/683815
24. Glaab T, Taube C. Practical guide to cardiopulmonary exercise testing in adults. Respir Res. 2022;23(1):9. doi:10.1186/s12931-021-01895-6
25. Gibbons RJ, Balady GJ, Beasley JW, et al. ACC/AHA Guidelines for Exercise Testing. A report of the American College of Cardiology/American Heart Association Task Force on Practice Guidelines (Committee on Exercise Testing). J Am Coll Cardiol. 1997;30(1):260–311. doi:10.1016/s0735-1097(97)00150-2
26. Gibbons RJ, Balady GJ, Bricker JT, et al. ACC/AHA 2002 guideline update for exercise testing: summary article. A report of the American College of Cardiology/American Heart Association Task Force on Practice Guidelines (Committee to Update the 1997 Exercise Testing Guidelines). J Am Coll Cardiol. 2002;40(8):1531–1540. doi:10.1016/S0735-1097(02)02164-2
27. Albouaini K, Egred M, Alahmar A, Wright DJ. Cardiopulmonary exercise testing and its application. Postgrad Med J. 2007;83(985):675–682. doi:10.1136/hrt.2007.121558
28. Liu Y, Zou J, Qian Y, et al. The association between obesity indices and obstructive sleep apnea is modified by age in a sex-specific manner. Sleep Breath. 2021;25(1):189–197. doi:10.1007/s11325-020-02083-4
29. Japas C, Knutsen S, Dehom S, Dos Santos H, Tonstad S. Body mass index gain between ages 20 and 40 years and lifestyle characteristics of men at ages 40–60 years: the Adventist Health Study-2. Obes Res Clin Pract. 2014;8(6):e549–e557. doi:10.1016/j.orcp.2013.11.007
30. Mir IA, Soni R, Srivastav SK, et al. Obesity as an important marker of the COVID-19 pandemic. Cureus. 2022;14(1):e21403. doi:10.7759/cureus.21403
31. Akter R, Nessa A, Husain MF, et al. Effect of obesity on fasting blood sugar. Mymensingh Med J. 2017;26(1):7–11.
32. Golay A, Ybarra J. Link between obesity and type 2 diabetes. Best Pract Res. 2005;19(4):649–663. doi:10.1016/j.beem.2005.07.010
33. Stadler JT, Marsche G. Obesity-related changes in high-density lipoprotein metabolism and function. Int J Mol Sci. 2020;21(23). doi:10.3390/ijms21238985
34. Park HK, Hwang JS, Moon JS, Lee JA, Kim DH, Lim JS. Healthy range of serum alanine aminotransferase and its predictive power for cardiovascular risk in children and adolescents. J Pediatr Gastroenterol Nutr. 2013;56(6):686–691. doi:10.1097/MPG.0b013e31828b4e67
35. Lewis GF, O’Meara NM, Soltys PA, et al. Postprandial lipoprotein metabolism in normal and obese subjects: comparison after the vitamin A fat-loading test. J Clin Endocrinol Metab. 1990;71(4):1041–1050. doi:10.1210/jcem-71-4-1041
36. Ben-Dov I, Grossman E, Stein A, Shachor D, Gaides M. Marked weight reduction lowers resting and exercise blood pressure in morbidly obese subjects. Am J Hypertens. 2000;13(3):251–255. doi:10.1016/S0895-7061(99)00190-9
37. Seravalle G, Grassi G. Obesity and hypertension. Pharmacol Res. 2017;122:1–7. doi:10.1016/j.phrs.2017.05.013
38. Bryan S, Saint-Pierre Larose M, Campbell N, Clarke J, Tremblay MS. Resting blood pressure and heart rate measurement in the Canadian Health Measures Survey, cycle 1. Health Rep. 2010;21(1):71–78.
39. Nagaya T, Yoshida H, Takahashi H, Kawai M. Resting heart rate and blood pressure, independent of each other, proportionally raise the risk for type-2 diabetes mellitus. Int J Epidemiol. 2010;39(1):215–222. doi:10.1093/ije/dyp229
40. Green S, Egana M, Baldi JC, Lamberts R, Regensteiner JG. Cardiovascular control during exercise in type 2 diabetes mellitus. J Diabetes Res. 2015;2015:654204. doi:10.1155/2015/654204
41. Chockalingam A, Linden MA, Dellsperger KC, Thomas TR. Correlation of normal diastolic cardiac function with VO in the metabolic syndrome. Prev Cardiol. 2009;12(3):163–168. doi:10.1111/j.1751-7141.2009.00027.x
42. Grassi G, Dell’Oro R, Facchini A, Quarti TF, Bolla GB, Mancia G. Effect of central and peripheral body fat distribution on sympathetic and baroreflex function in obese normotensives. J Hypertens. 2004;22(12):2363–2369. doi:10.1097/00004872-200412000-00019
43. Nilsson PM, Tuomilehto J, Ryden L. The metabolic syndrome - what is it and how should it be managed? Eur J Prev Cardiol. 2019;26(2_suppl):33–46. doi:10.1177/2047487319886404
44. Ponnalagu SD, Bi X, Henry CJ. Is waist circumference more strongly associated with metabolic risk factors than waist-to-height ratio in Asians? Nutrition. 2019;60:30–34. doi:10.1016/j.nut.2018.09.005
45. MacGowan GA, Janosko K, Cecchetti A, Murali S. Exercise-related ventilatory abnormalities and survival in congestive heart failure. Am J Cardiol. 1997;79(9):1264–1266. doi:10.1016/S0002-9149(97)00097-0
46. Sun XG, Hansen JE, Garatachea N, Storer TW, Wasserman K. Ventilatory efficiency during exercise in healthy subjects. Am J Respir Crit Care Med. 2002;166(11):1443–1448. doi:10.1164/rccm.2202033
47. Myers J, Arena R, Oliveira RB, et al. The lowest VE/VCO2 ratio during exercise as a predictor of outcomes in patients with heart failure. J Card Fail. 2009;15(9):756–762. doi:10.1016/j.cardfail.2009.05.012
48. Xi Q, Zhao Z, Liu Z, Ma X, Luo Q, Liu W. The lowest VE/VCO(2) ratio best identifies chronic thromboembolic pulmonary hypertension. Thromb Res. 2014;134(6):1208–1213. doi:10.1016/j.thromres.2014.09.025
49. Akinci Ozyurek B, Savas Bozbas S, Aydinalp A, Bozbas H, Ulubay G. Value of cardiopulmonary exercise testing in the diagnosis of coronary artery disease. Tuberk Toraks. 2019;67(2):102–107. doi:10.5578/tt.68200
50. Loe H, Rognmo O, Saltin B, Wisloff U, Lucia A. Aerobic capacity reference data in 3816 healthy men and women 20–90 years. PLoS One. 2013;8(5):e64319. doi:10.1371/journal.pone.0064319
51. Sharma S, Elliott PM, Whyte G, et al. Utility of metabolic exercise testing in distinguishing hypertrophic cardiomyopathy from physiologic left ventricular hypertrophy in athletes. J Am Coll Cardiol. 2000;36(3):864–870. doi:10.1016/S0735-1097(00)00816-0
52. Lin CK, Lin CC. Work of breathing and respiratory drive in obesity. Respirology. 2012;17(3):402–411. doi:10.1111/j.1440-1843.2011.02124.x
 © 2022 The Author(s). This work is published and licensed by Dove Medical Press Limited. The
full terms of this license are available at https://www.dovepress.com/terms
and incorporate the Creative Commons Attribution
- Non Commercial (unported, 3.0) License.
By accessing the work you hereby accept the Terms. Non-commercial uses of the work are permitted
without any further permission from Dove Medical Press Limited, provided the work is properly
attributed. For permission for commercial use of this work, please see paragraphs 4.2 and 5 of our Terms.
© 2022 The Author(s). This work is published and licensed by Dove Medical Press Limited. The
full terms of this license are available at https://www.dovepress.com/terms
and incorporate the Creative Commons Attribution
- Non Commercial (unported, 3.0) License.
By accessing the work you hereby accept the Terms. Non-commercial uses of the work are permitted
without any further permission from Dove Medical Press Limited, provided the work is properly
attributed. For permission for commercial use of this work, please see paragraphs 4.2 and 5 of our Terms.