Back to Journals » ClinicoEconomics and Outcomes Research » Volume 11
An iron triangle ROI model for health care
Authors van der Goes DN ![]() , Edwardson N
, Edwardson N ![]() , Rayamajhee V
, Rayamajhee V ![]() , Hollis C, Hunter D
, Hollis C, Hunter D
Received 22 February 2017
Accepted for publication 15 August 2018
Published 10 May 2019 Volume 2019:11 Pages 335—348
DOI https://doi.org/10.2147/CEOR.S130623
Checked for plagiarism Yes
Review by Single anonymous peer review
Peer reviewer comments 3
Editor who approved publication: Professor Giorgio Colombo
David N van der Goes,1 Nicholas Edwardson,2 Veeshan Rayamajhee,1 Christine Hollis,3 Dawn Hunter4
1Department of Economics, University of New Mexico, Albuquerque, NM, USA; 2School of Public Administration, University of New Mexico, Albuquerque, NM, USA; 3New Mexico Coalition for Health Care Value, Albuquerque, NM, USA; 4Office of Policy and Accountability, New Mexico Department of Health, Santa Fe, NM, USA
Objective: Few, if any, return on investment (ROI) analyses of health programs make systematic considerations of patient access, instead focusing principally on gains related to cost and quality. The objective of this study was to develop an open-source model that adds an estimation of gains in patient access to a traditional ROI analysis. A classification system for quantifying gains in patient access is proposed.
Materials and methods: An Excel-based ROI model was built that not only incorporated traditional ROI considerations – cost savings and patient cases avoided – but also addressed changes in patient access. The model was then applied in a case study using New Mexico Medicaid data and two proposed initiatives – a statewide health information exchange (HIE) and a community health worker (CHW) program that focused on chronic disease patients. Savings, Health, Outreach, and Access estimates were derived from the literature. ROI estimates were produced that also incorporated relative gains in patient access.
Results: Combined, the HIE and CHW programs are predicted to generate a positive ROI by the fourth year, growing to 45% by the program’s tenth year. Total estimated cumulative cost for both programs after 10 years is $9,555,226. Total estimated cumulative saving for both programs after 10 years is $11,332,899. Access-related costs begin moderately in year 1 at $122,766 and grow to $1,858,274 by year 10. The model estimates an Access score of 19 in year 1. This figure grew to 380 by year 10.
Conclusion: Our model shows that a rough estimation of gains in to patient access can be incorporated to traditional ROI analyses. The results of our case study suggest that a CHW program and statewide HIE can generate a positive ROI for the state’s Medicaid program.
Keywords: return on investment, patient access, community health workers, health information exchange
Introduction
The iron triangle of health care describes how the three competing priorities of health care delivery – cost, quality, and access – are engaged in a zero-sum game. Each of the triangle’s corners has set angles. In order to increase the angle of one priority, say, to improve access, one must decrease the angle of one or both of the remaining corners, save for instances of major gains in efficiency.1 This issue of tradeoffs is well documented. Programs and policies aimed at improving access can be costly.2 The same goes for quality improvement initiatives.3 Conversely, cost-reduction efforts may come at the expense of quality or access.4 These zero-sum game outcomes are seldom acknowledged by policymakers.5
With the recent increased focus on health care expenditures in the USA, many state and local health programs are now being evaluated from a business case perspective. Leatherman et al6 defined a business case as an event where an investing entity “realizes a financial return on its investment in a reasonable time frame, using a reasonable rate of discounting” (p. 18). The intrigue of this approach is that health institutions will not voluntarily adopt policies or programs that lack a strong business case. Stated differently, mandated policies that lack a business case are likely to be met with resistance, be unsustainable, or both. The business case approach asks policymakers and researchers to evaluate health programs from a return on investment (ROI) perspective,7,8 an approach that is not historically common in the health care industry, but is gaining interest.9,10 Interventions with positive ROI, according to the business case model, are potentially low-hanging fruit for health care payers and providers.
But despite the strong logic behind and increasing attention to the business case framework, the approach largely ignores the iron triangle. As discussed earlier, a cost reduction or quality improvement intervention may ignore or come at the expense of improved patient access. The business case does not intend to take the perspective of society, nor does it incorporate strategic reasons for implementing a program that may yield negative ROI.11 Furthermore, business case analyses are “purposively myopic”.11 Short-time horizons are required because “patients move in and out of programs of care or in and out of a geographic region where a particular intervention is employed”.7
But what of programs and interventions that will certainly not yield a positive ROI in the short term, but are still necessary for strategic or even ethical considerations? And what of programs that improve patient access or quality over the long term, but are quite costly in the short term? Existing analytical tools used to build ROI models for such programs would only produce a less negative to more negative ROI scalar result. These models rely heavily on either near-term net present value calculations or benefit–cost ratios.7 But what if an ROI model could not only generate net present value, but also incorporate gains in patient access? Such a model would produce a more nuanced evaluation of health programs and policies. Policymakers could use model output to better understand negative ROI programs. This would enable programs to be ranked by more than just their financial return. Instead, negative ROI programs could also be graded by their impacts on patient access.
In this article, we introduce a new open-source ROI model that incorporates program costs, quality, and access – an iron triangle ROI model. This model also allows for either “a priori or post hoc” analyses. The objective of this project is to create a multifaceted model that moves a step beyond the relative straightforwardness of the business case approach. The model not only incorporates traditional ROI considerations – cost savings and patient cases avoided – but also requires its users to contemplate and even estimate changes in patient access (Figure 1). The model is also unique in that it allows the user to assume varying degrees of implementation effectiveness (for ex-ante analyses) and costing can be applied to either specific disease areas or across a general population.
 | Figure 1 Theoretical model. Notes: The first section begins by describing the empirical design of the iron triangle ROI model. In this section, an empirical framework for incorporating gains in patient access is proposed. The first section concludes by outlining all the variables that the “user” (the person performing an economic analysis using the model) can input and select for analysis. The second section of the article then describes a case study of the model using New Mexico Medicaid data and two proposed initiatives – a statewide HIE and a CHW program focused on chronic disease patients. Abbreviations: CHW, community health worker; HIE, health information exchange; ROI, return on investment. |
Materials and methods
Section I: Model design
An Excel-based model was built that incorporated a wide array of inputs that could comprise either historical data or data drawn from the literature. This first section outlines all the variables that the “user” (the person performing an economic analysis using the model) can input and select for analysis. The spreadsheet used for this study and detailed user instructions can be found by visiting (http://healthpolicy.unm.edu/ROI-Toolkit).
Patient expenditures
The first major input component of the model allows the user to input historical, patient-level expenditure data (for post hoc analyses) or average patient expenditures across an array of classifications (for a priori analyses). While the user is not required to know or input expenditures for each of the following categories, the more granular the data, the more detailed the output will be in later sections when the user can choose between per capita costing or per patient subpopulation costing. More granular expenditure data will also allow the user to later choose how different programs may have different effect sizes across an array of patient subpopulations (eg, rural vs urban, female vs male, etc). Many targeted programs, such as a women’s health program or a colonoscopy program targeted at African-American males, will require this type of stratified data. In the following section, we briefly describe each of the variables available to the user.
Disease area
The disease area component of the model allows the user to create up to four disease areas within a general population to be analyzed. Stratifying by disease allows the user to conduct an ROI analysis for key disease areas (eg, diabetes, obesity, etc). The user can also select and analyze all four disease areas simultaneously.
Race and ethnicity
The model utilizes the 1997 Office of Management and Budget Standard Groupings to collect and report data on race and ethnicity. Though race and ethnicity are separate constructs, there is a significant overlapping between them and they are often seen as interchangeable. For simplicity, generalizability, and a proper representation of diverse patient populations, the model divides race and ethnicity into the following five major categories: White non-Hispanic, Black/African-American, American Indian, Hispanic, and Other. The user can also select and analyze all five categories simultaneously.
Age group
The model uses a three-group classification of individuals based on age: under age 25; 25–64; 65 and over. The reasons for adopting this classification system are the following:
- Under 25: Individuals in the sample/population who are below 25 years of age. These individuals are generally thought of as not being directly in the labor force since it includes children and young adults who are of school/college attendance ages. However, the threshold is not a strict cutoff for labor force participation.
- Age 25–64: This group refers to individuals within the 25–64 years of age. These individuals are of working age.
- 65 and above: This group includes those individuals who are of age 65 or above. This age group is of retirement age and eligible for Medicare.
The user can also select and analyze all three categories simultaneously.
Geography
The model allows the user to classify patient expenditures at the county level into four groups, metro, small metro, mixed urban/rural, and rural, based on the National Center for Health Statistics Urban–Rural Classification Scheme for Counties. This scheme allows the user to make population density considerations that may prove important when considering program implementation. For example, a community health worker (CHW) program that calls for in-home contact with patients may require more resources or time in rural counties. The user can also select and analyze all four geographic categories simultaneously.
Gender
The model includes three gender groups from which to choose: male, female, and other. The user can also select and analyze all three categories of gender simultaneously.
Program costs
The second major input component of the model relates to the costs of up to three health programs. Here the user may input historical program costs (for post hoc analyses) or expected program costs and (for a priori analyses). The user may input these data, whether realized or projected, for up to 10 years.
Costs
Program costs are assumed to fall into one of two categories: technical or human capital. Technical programs are typically designed with major capital outlays followed by annual maintenance and operation costs. Examples of such programs would include a statewide health information exchange (HIE) or electronic health record implementation. Expanding or reducing the scope of such technical project does not necessarily result in a linear growth or reduction in costs. Human capital programs, on the other hand, are labor intense and output is typically constrained to full-time equivalent ratios. Example of human capital programs would include a CHW program or a home health program. Complex programs such as a major telehealth initiative may require the use of both cost categories, which is allowable in the model.
Per capita costing
The model requires that the user decide whether the program costs will be spread over every beneficiary – a per-member-per-year cost approach – or not. If the user chooses per-member-per-year, the program beneficiaries (those being analyzed) will pay the per-enrollee average cost of that portion of program costs – their “fair share”. The user can select either “yes” or “no” as a choice in this domain. Selecting “yes” calculates the share of the program cost borne by the beneficiaries of the program or programs as selected (per capita costing). For example, if the user selects a group of Medicaid enrollees that represents 10% of the total Medicaid enrollment, this group is assumed to pay 10% of the program costs. If the user chooses the category “no”, the selected group is assumed to bear 100% of the program costs. This selection option, however, only applies to technical programs. Human capital programs are only calculated based on costs being distributed to targeted groups, since non-targeted patients do not receive any direct benefit from such programs.
Program effects
The model allows the user to estimate up to four types of program effects: Savings, Health, Outreach, and Access. Each of these effects introduces different, and sometimes opposing, moderation effects on ROI. These program effects are presented via a conceptual model in Figure 2.
 | Figure 2 Conceptual model of the effects of the HIE and CHW programs on ROI. Abbreviations: CHW, community health worker; HIE, health information exchange; ROI, return on investment. |
Savings effect
This effect is the gain in efficiency from any reduction in unnecessary emergency department (ED) use or admissions, medication errors, diagnostic duplication, and the like.12 The Savings effect does not include any changes from improved health status, as when a pre-diabetes diagnosis does not progress to one of diabetes. The Savings effect is calculated as the difference between the total cost of care to a payer if user-selected programs are implemented and that of the total cost of care without the program(s).
Health effect
This effect encompasses gains from changing health outcomes, such as improved case management, slowed progression of disease, or case avoidance (eg, helping someone quit smoking to avoid lung cancer). The number of cases avoided – or well-managed cases (eg, patients handled so well that they do not progress to a more serious disease state) – is calculated as the annual percentage change in the Health effect for each program multiplied by the number of beneficiaries in the user-selected population group. For example, if there were 100 beneficiaries in the selected population group, and the health effect generated from use of a health program was 2%, then two fewer individuals would remain in the group (eg, a tobacco user quits smoking, a diabetic’s A1C falls to pre-diabetic range, etc) or they would have their status switched from “poorly managed” to “well managed” after 1 year. From the model’s perspective, this movement from “poorly managed” to “well managed” assumes that those individuals will no longer result in medical expenditures at the 98th percentile, but instead at the mean level of expenditures for patients in that disease area. By default, the model is set up to target individuals at or above the 98th percentile of spenders within a disease area and considers the mean spending level within that disease area to be a “well managed” level of care. However, the user can change these two defaults if necessary. The model also takes a conservative approach and assumes there is no patient replacement. That is, if a program succeeds in reducing a selected population group from 100 to 98 after 1 year, the second year’s analysis is conducted on 98 individuals. This mechanism results in programs reducing the total number of affected lives annually, despite maintaining the same level of effectiveness and costs.
Outreach effect
This effect is the percentage of beneficiaries, out of a larger population, who are actually “reached” or affected by the program(s). This effect changes with geography (assuming this patient cost variable was inputted by the user). For example, a CHW in a frontier area may only be able to reach 20% of his/her designated patient population, while a CHW in a more highly populated urban area may reach 60% of beneficiaries.13 Another example is when a patient assigned to a CHW may not be easy for the CHW to locate (eg, the patient moved or changed phone numbers), but over time, the more experienced CHW will be able to locate and help a larger percentage of his/her patient list. In this case, the Outreach effect may be low during a program’s initial years, but improves as the program matures. Still another consideration for Outreach effect may be the probability of actually filling all of the required full-time equivalents for a particular program. For programs or a region where occupational vacancies are commonplace, or turnover is high, the Outreach effect can be used as a downward moderator for a program’s overall impact.
Access effect
We define access here as having the timely use of personal health services to achieve the best health outcomes.14 Programs designed to improve health care access can be categorized as either “entrance” programs or “effectiveness” programs. “Entrance” programs are designed to remove barriers that prevent individuals from gaining access to the health care system. These programs serve as Outreach to underserved and disenfranchised populations who are either unaware of or hesitant to utilize entry points to the USA health care system other than EDs. These programs traditionally seek to identify and enroll patients prior to high-cost health events. “Effectiveness” programs, on the other hand, are designed to improve the consumption efficiency of needed services.15 These programs aim to improve care coordination and outcomes for existing patients who are inefficient consumers of health care due to cultural, financial, and/or educational barriers.
To further quantify access, we use a substitution-vs-expansion framework taken from the pharmacoeconomics literature.16,17 This framework argues that new technologies – or in our case, health programs – may result in either a substitution effect or an expansion effect. With a substitution effect, a new health program results in patients replacing a traditional source or process of care with more efficient or effective (or both) means of care. For example, a Patient-Centered Medical Home (PCMH) program will ideally enable a patient to see a primary care provider instead of presenting in the ED for non-emergent causes. In this case, the PCMH substitutes for ED utilization. Conversely, with an expansion effect, a health program makes it possible for patients to receive additional needed care that they might not have otherwise received. This occurs due to providers diagnosing and treating diseases more frequently when patients are more likely to follow treatment protocol. Patients also seek additional care when therapy is more effective.17 Expansion effects frequently result in improved health outcomes, but higher total expenditures in the short term.17,18
Whether a program is an entrance program or an effectiveness program and whether it produces a substitution effect or an expansion effect has obvious implications for ROI. For example, an entrance program with expansion effect could increase the total costs at alarming rates despite improving health care access. Conversely, an effectiveness program with substitution effect could dramatically drive down costs, while simultaneously improving access and outcomes. Finally, we note that neither all entrance programs nor do all expansion effects necessarily produce higher total costs. For example, the advent of selective serotonin reuptake inhibitors led to a dramatic increase in depression diagnoses (an expansion effect); but given the unprecedented effectiveness of this drug class and its relative low cost, the benefits (quality-adjusted life years, ability to work and produce more, etc) far exceed the costs.17
With regards to our ROI model, gains in certain combinations of access are already incorporated into the model’s inputs – specifically through the Health and Savings effects. For example, if we consider an effectiveness program with a substitution effect, these gains are already being captured in the Health effect and the Savings effect columns, respectively. A specific example will help illustrate this mechanism. Let us make the case that a PCMH is an effectiveness program in that it “actively supports patients in learning to manage and organize their own care at the level the patient chooses” while “understanding and respecting each patient’s unique needs, culture, values, and preferences”.19 In this case, the PCMH is improving the efficiency of consumption of needed services, as has been consistently demonstrated in the literature.20 This specific type of improvement is already being captured in the ROI model through the Health effect consideration. Let us also make the case that a PCMH produces a substitute effect given their demonstrated reductions in costly inpatient and ED utilizations.20 This savings-related improvement is also already being captured in the ROI model through the Savings effect consideration. Thus, we conclude that a program that is categorized as an effectiveness program with a substitute effect is already fully incorporated into the ROI model.
That leaves us with estimating the impact of programs that are either entrance programs, have expansion effects, or meet both the criteria. In these scenarios, these programs are likely in the short term – and possibly in the long term – to increase total health care spending by the following:
- providing care to individuals who previously did not have any access points into the health care system (an entrance program);
- providing additional needed care to patients who might not have otherwise received it (an expansion effect); or
- some combination of both.
In these three instances, the ROI model ought to incorporate a downward moderating effect on total ROI. While these programs may generate benefits in health, they are likely to increase the total costs at a higher rate in the short term, and thus decrease ROI. Thus, the percentages that are inputted by the user in the Access effect column create additional costs to the program. Specifically, the percentage is an assumption made by the user of the new patients added to the total program subpopulation (an entrance effect) or of additional services consumed due to the program’s encouragement of additional health care consumption (an expansion effect). So, for example, a CHW who is tasked with reaching high-cost diabetic patients in order to improve medication adherence – an expansion effect – may also unintentionally inform a neighbor or family member about how to access similar health care services – an entrance effect.21 This newly reached individual now may have access to care (a benefit), but also introduces a cost to the program. Note that only programs deemed by the user to be entrance programs or have expansion effects ought to receive a percentage score entered in the Access effect column. For programs that are effectiveness programs or produce substitute effects, the user ought to leave Access effect cells blank since, as noted above, these programs’ Access effects have already been captured in the Savings and Health effects columns.
Finally, we note that the access-related output of the model is a positive integer score that can be interpreted in one of two ways, depending on whether the program is entrance based or expansion based. For the former, the integer is to be interpreted as the number of individuals who have gained access to the health care system (eg, a patient develops a regular source of care for the first time). The model at baseline assumes these individuals are brought into the health system at the mean level of patient expenditures, though the user can alter this. For the latter, the integer is to be interpreted as the dollar amount attributed to treatment expansion (eg, a patient loses significant weight through exercise, but now needs a knee transplant). The Access effect is cumulatively measured. That is, if a new patient enters via an expansion program or experiences treatment expansion, those new annual costs are held constant and counted in each subsequent year.
Discount rate
The discount rate represents how much the user values projected future savings vs savings that occur in the present. For example, the user may feel that saving $1 million 10 years from now is worth less than saving $1 million today, especially in terms of ROI, because people prefer to receive benefits quickly. The greater the discount rate, the less the user values future savings. The selection range in the analysis is between 0% and 10% as an integer. The default discount rate is 3%. The default rate was chosen based on market interest rates (eg, the prime rate, bank savings account annual percentage rates, and mortgage rates) both historical and projected, and from health care program evaluation and cost-effectiveness literature.22,23
Calculations
ROI is determined using the following equation:
|

In the above equation, t refers to time, in this case, year. “Total costs” refers to the present value of all costs, including those related to entrance and expansion effects, of implementing the proposed programs up to and including year t, and not the current or projected costs of providing care. That is, it is the cost to the institution of implementing the program(s). The “Net benefits” are derived based on the use of assumed Health and Savings effects applied in the analysis. Net benefits are also the accumulated benefits up to and including year t.
Total costs for the HIE are calculated as follows:
|

where capital and labor can vary by year. For example, server purchases may be high in the first year, while labor costs for server administrators may be higher in later years to maintain larger and more complex systems.
Total costs for the CHW program are all variable costs by assumption. They are calculated as follows:
|
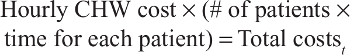
where hourly CHW cost includes wages, fringe benefits, and overhead. CHWs are assumed to work 2,000 hours per year. Fringe benefit and overhead rates are calculated using the University of New Mexico fringe and overhead rates.
The numerator is calculated as follows:
|
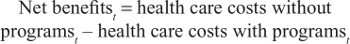
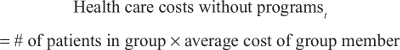
where health care costs without programs are calculated as follows:
|
Health care costs with programs are calculated as follows:
|
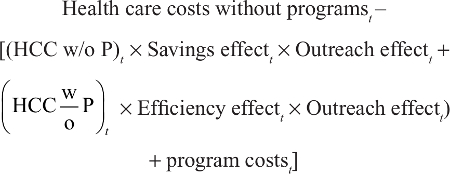
where all costs and effects can vary by year.
Section II: Model case study
In this section, we describe a case study of the ROI model using the New Mexico Medicaid population and two programs identified by the state’s Health System Innovation (HSI) project. All data used in this study were provided by the New Mexico Human Services Department (HSD) in cooperation with the New Mexico Department of Health in support of the state’s HSI for the fiscal year 2013. All data were de-identified by the New Mexico HSD. The institutional review board of University of New Mexico determined that the study was exempt from federal regulations on the basis that the study did not include any access to identifiable private information (Ref. #19917). The fiscal year 2013 was the last year New Mexico used fee-for-service for Medicaid reimbursement.
The HSI project first identified the following four disease areas as key health priorities for the state’s Medicaid population:
Behavioral health
Behavioral health refers to an array of conditions, including substance abuse, related to the mental well-being of individuals, the deterioration of which can have severe health consequences, physical or otherwise. Behavioral health is inextricably linked with other chronic diseases including diabetes, heart disease, and cancer.24 This category includes individuals with depression and dysthymia. Also, this disease area only includes adults (aged 19 and over) in the analysis. ICD9 code list: 296.20, 296.21, 296.22, 296.23, 296.24, 296.25, 296.30, 296.31, 296.32, 296.33, 296.34, 296.35, 298.0, 311
Diabetes
Diabetes is a disease characterized by above normal glucose levels in blood. Diabetes can lead to heart disease, blindness, kidney failure, and lower-extremity amputations.25 ICD9 code list: 648, 648.03, 648.01, 648.02, 648.04, 366.41, 362.07, 362.01, 250.71, 250.73, 250.23, 250.21, 250.11, 250.13, 250.61, 250.63, 250.31, 250.51, 250.53, 250.33, 250.81, 250.83, 250.43, 250.41, 250.91, 250.93, 250.01, 250.03, 250.7, 250.72, 250.22, 250.2, 250.1, 250.12, 250.6, 250.62, 250.3, 250.5, 250.52, 250.32, 250.8, 250.82, 250.42, 250.4, 250.9, 250.92, 250, 250.02, 362.04, 362.05, 357.2, 362.03, 362.02, 362.06
Obesity
The Centers for Disease Control and Prevention classification of obesity uses body mass index to identify individuals within the obese range. Individuals with a body mass index reading of 30.0 or higher are identified as being within the obese range.26 ICD9 code list: 278.0, 278.00, 278.01, 278.03
Tobacco
The Centers for Disease Control and Prevention identifies tobacco use as the single most preventable cause of death and disease. In New Mexico, leading causes of tobacco-related death include chronic airway obstruction, lung cancer, ischemic heart disease, other heart disease, and bronchitis/emphysema.27 All forms of tobacco use were included in the analysis. ICD9 code list: 305.1, 305.1, 305.11, 305.12, 305.13, 649, 649.01, 649.02, 649.03, 649.04, 989.84
With these four disease areas identified, we then input patient costs into the model. The Medicaid patient and disease data were provided by the Medicaid database managed by the Medical Assistance Division, New Mexico HSD. These data represent the actual total spending on beneficiaries from CY2013 (adjusted to 2016 dollars). The cost data provided were within disease cost categories, not total utilization of health care services by a patient with that diagnosis.
We adjusted these data by using national averages of total utilization and disease-specific spending to also account for patient spending “outside” of the disease diagnosis area. For example, the American Diabetes Association provides data on health care costs within diabetes and outside of diabetes for diabetics,28 in addition to information on the difference in spending between diabetics and non-diabetics. These adjustments were made because the two HSI programs (discussed below) affect both within diagnosis and outside of diagnosis spending.29 For example, poorly managed depression may cause a patient to also have poorly managed hypertension and hyperlipidemia.30 Managing depression may “increase” behavioral health costs, but the offsetting reduction in costs from avoided myocardial infarctions or strokes is much larger, contributing to net cost saving. Therefore, “outside of diagnosis” costs are extremely important to the analysis and production of accurate results.
The HSI project identified the following two health programs to be evaluated for their respective ROIs. (The HSI project called for a third program – a statewide implementation of PCMH – to be included in the evaluation. However, for brevity, we opted against including it in this article’s description. We have, however, left the data for the PCMH program in the example ROI model.
CHW program
CHWs are viewed as being fully integrated into primary care teams, serving as care coordinators and providing direct outreach to patients. Outreach may include, but is not limited to phone call follow-ups after office visits, helping patients navigate the health care or social service system, attending scheduled appointments, accompanying patients to pick up prescriptions, and teaching patients how to manage their chronic disease. Using our access categorization method, we contend that a CHW program, as defined here, can serve as both an effectiveness and entrance program, and that it can lead to both substitution and expansion effects. A CHW is an effectiveness program in that it encourages patients to be more efficient consumers of health care through improved coordination and protocol adherence. However, a CHW program can also serve as an entrance program. CHWs are often highly integrated in their communities and, while caring for one patient, may encounter and engage other potential patients who need similar care.31 Evaluations of CHW programs have yielded both substitution and expansion effects.31,32
Health information exchange
The HIE is an active repository of the state’s health care data, much from electronic health records. These data include but are not limited to patient encounters, diagnostics, prescriptions, and the like. The data can be accessed through a portal, and “alerts” can be sent to physicians who have recently seen or will be seeing the patient. Advanced analytics performed by an HIE might stimulate the provision of preemptive alerts to providers, who can then reach out to a patient before a high-cost care event is likely to occur. The literature indicates HIEs can reduce ED visits, readmissions, duplicate diagnostics, and medication errors and may lead to a reduction in health care utilization.12 Using our access categorization method, we contend that HIE is an effectiveness (vs entrance) program and will likely lead to substitution effects (eg, a reduction in redundant lab orders), but not expansion effects. As a result, we left all Access effect cells blank as the HIE’s impact on access is already being captured in the Health effect and Savings effect calculations.
The “program costs” (presented in Table 1) for the HIE were drawn from a 5-year cost report by IATRIC Systems in 2016 (SIM Project-Phase 2, Final Deliverables) for the HSI project. CHW program costs are based on Bureau of Labor Statistics salary data and additional fringe and overhead calculations. CHW costs are calculated on an hourly basis and vary by the size of the population group being analyzed. In general, the assumption is that each CHW costs $84,000 per year (salary, fringe, and overhead).33
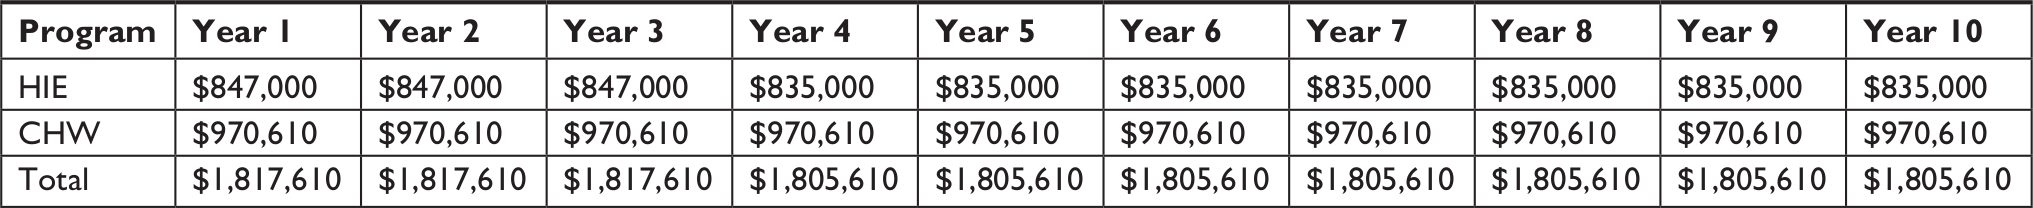 | Table 1 Program costs Abbreviations: CHW, community health worker; HIE, health information exchange. |
The IATRIC Systems cost estimates were produced based on projections covering the first 5 years of both programs’ implementation. The economic analysis assumes that the maintenance costs of these programs in the last 5 years of the 10 years projected will remain the same as the rollout cost of the last, or the fifth year of rollout. The CHW costs are calculated for the patient beneficiary group in the first year of implementation and are then assumed to neither decrease nor increase as patients move out of the group due to improved health status (eg, becoming a “case avoided”).
Whereas the patient cost data were historical for this case study, the programs’ Savings, Health, Outreach, and Access effect estimates were based on a review of the literature – both peer-reviewed articles and reliable white paper/technical report-style papers. The literature indicated a range of effects for both the programs. The effect sizes used in this analysis were the most conservative (smallest) estimates found in the literature (see Table 2).
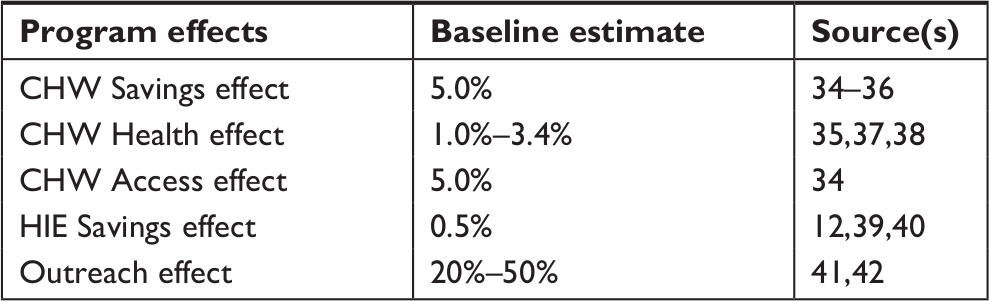 | Table 2 Model baseline estimates Abbreviations: CHW, community health worker; HIE, health information exchange. |
We could find few data that suggest the degree of patient access improvement related to CHW programs. This is due both in part to the general lack of patient access-related ROI research – the impetus for this study – and also the varying forms and scope of CHW programs. For example, a scan of the literature reveals a wide array of designed job functions for CHWs, ranging from enrollment, to patient navigation, to health education.32 A CHW program may be designed to focus on one or some combination of functions, though the intended purpose of a CHW program will have obvious impacts on patient access as we have defined it here. For example, the entrance effect of a CHW program solely tasked with enrolling patients in Medicaid will be much larger than that of a CHW program primarily tasked with the management of HIV infection in an urban community. Thus, for this portion of the model, we chose a starting point of 5% and re-ran the model at both 1% and 10%. An Access effect of 5% suggests that a CHW program serving 100 patients during a year will introduce five new patients into the health care system (an entrance effect) or will lead to an increase in health services consumption by the mean amount of expenditures for five existing patients (an expansion effect). The interpretation of this Access score depends on whether the user is assuming an entrance effect or an expansion effect. Increasing this variable introduces new costs to the program, thereby decreasing ROI in the short term. As noted earlier, the analysis assumes that the HIE will only produce a Savings effect and Health effect, whereas the CHW program will produce a Savings effect, Health effect, and Access effect.
The Outreach effect is assumed to be similar for both programs and is a function of geography for the CHW program and clinician adoption for the HIE program. For the CHW program, we assume that outreach will be relatively low in the program’s first year (20%) as the program will face difficulty in filling positions and reaching targeted patients. We assume the program will experience marginal outreach improvements and be able to reach 50% of patients by the program’s tenth year (see Table 3).
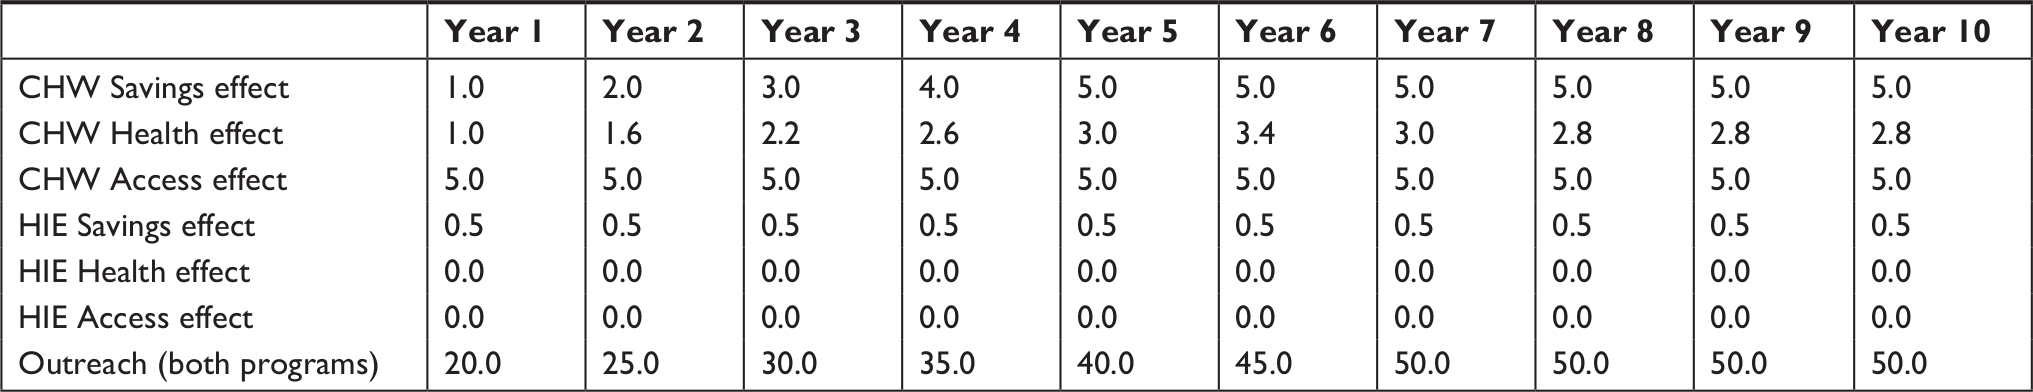 | Table 3 Effect sizes – weighted average effect across all four priority disease areas Note: Data shown as %. Abbreviations: CHW, community health worker; HIE, health information exchange. |
For the HIE program, we assume that the outreach will also be relatively low in the program’s first year (20%) as the program will likely only be used by early adopters. We assume the program will experience marginal outreach improvements (or in this case, adoption rate among providers) and will be adopted by 50% of the state’s providers by the program’s tenth year.
Results
The findings presented in Table 4 have been analyzed using New Mexico Medicaid beneficiaries with a diagnosis of at least one of the four identified diseases areas (n=96,291). This subpopulation comprised ~23% of the state’s entire Medicaid population. The mean annual expenditure for a patient with at least one of these diseases was $10,751. The mean annual expenditure for a patient in the 98th percentile of this population was $41,233. Also, 1,926 patients were identified within 98th percentile. The results reported here are with per capita costing turned off. That is, the 96,291 patients are assumed to bear all the costs for both the CHW program and the HIE program.
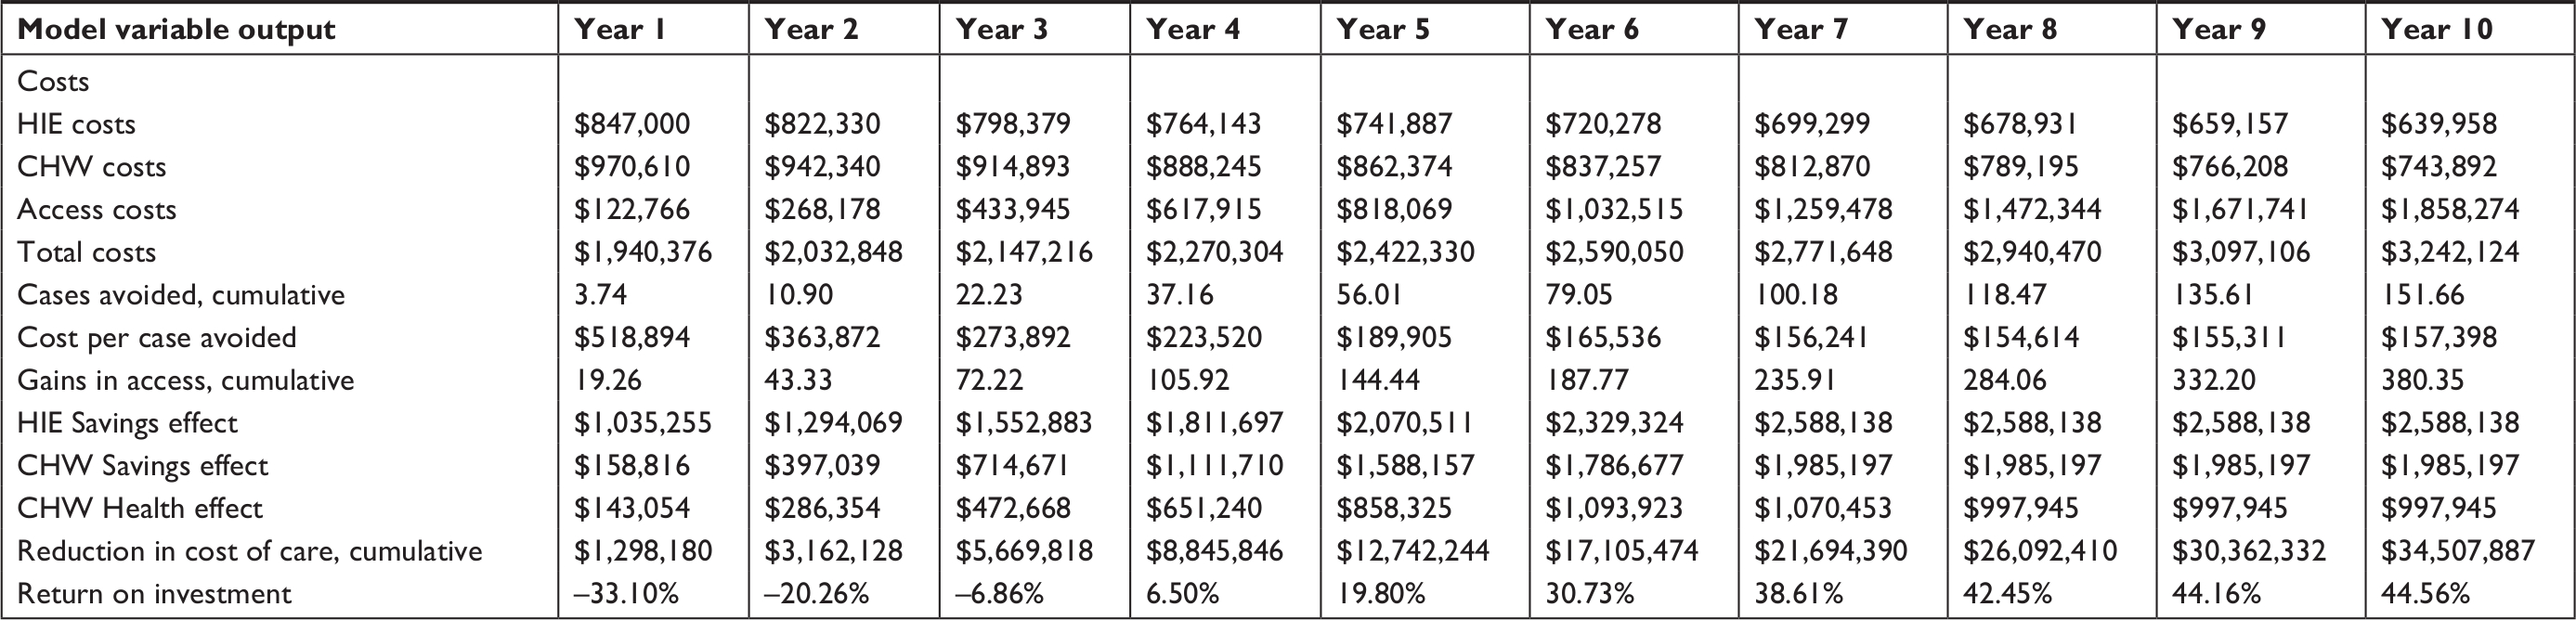 | Table 4 Iron triangle ROI model results Abbreviations: CHW, community health worker; HIE, health information exchange. |
Using our baseline cost data and estimates of Health, Savings, and Access effects, the CHW program is predicted to generate a total Savings effect of $158,816 in its first year by generating $412 in average savings for 385 total patients from the 98th percentile of Medicaid spenders. This figure grows to $1,985,197 by the program’s tenth year by generating $2,062 in average savings for 963 total patients (approximately half of those identified in the 98th percentile). These improvements from the program’s first year compared to its tenth year are generated by a combined improvement from within patient performance (an estimated 1% Savings effect in year 1 to a 5% savings by year 10) and among patient performance (an estimated 20% Outreach effect in year 1 to a 50% Outreach effect by year 10).
The CHW program is predicted to generate a total Health effect of $143,054 in its first year by yielding 3.85 cases avoided (eg, a smoker successfully quitting, a patient’s status switched from “poorly managed” to “well managed”, etc), with each individual case resulting in a savings to Medicaid of $37,141. This figure is arrived at by calculating the savings generated by moving a patient from the 98th percentile of health care consumption costs to the mean level of expenditure for patients in the same disease area. The CHW Health effect grows to $997,945 by the program’s tenth year by yielding 26.87 cases avoided, with each individual case still resulting in a savings to Medicaid of $37,141 per affected beneficiary. These improvements from the program’s first year compared to its tenth year are generated by a combined improvement by CHWs’ within patient performance (an estimated 1% Health effect in year 1 to a 2.79% Health effect by year 10) and among patient performance (an estimated 20% Outreach effect in year 1 to a 50% Outreach effect by year 10). We note that the Health effect for the CHW program peaks in in the program’s fifth year at 3.4% before declining to 2.79% in the program’s eighth, ninth, and tenth years. This occurs because as the total number of patients belonging to the targeted subpopulation is reduced over time (eg, fewer smokers enrolled in smoking cessation programs), the program is unable to maintain the same effect rate in absolute terms, all else held equal.
The HIE is predicted to generate a total Savings effect of $1,035,255 in its first year by generating 0.5% savings annually for every patient with at least one of the identified disease areas (n=96,291). This equates to an average annual savings of $11 for patients at the mean level of spending and $41 for patients at the 98th percentile of spending. This total figure grows to $2,588,138 by the program’s tenth year. This improvement is generated solely by an assumed increase in the Outreach effect, which begins at 20% in year 1 and ends at 50% by year 10. The assumed Savings effect of the HIE is held constant at 0.5% for all 10 years. No Health effects were estimated for the HIE program.
The results related to costs comprise those related to the two programs’ operating costs and those related to the gains in patient access, be they through new patients brought into the system or treatment expansion effects. Access-related costs begin moderately in year 1 at $122,766 and grow to $1,858,274 by year 10. The model estimates an Access score of 19 in year 1. That figure grows to 380 by year 10. We note here that this is a cumulative score. That is, the 19 patients who either gain initial access to health care or experience a treatment expansion effect of $10,751 in year 1 are assumed to remain captured by the system in each subsequent year at the same mean level of expenditures.
Taken together, both programs are predicted to generate a positive ROI by the fourth year. The ROI grows to 45% by the program’s tenth year. Total estimated cumulative cost for both programs after 10 years is $9,555,226. Total estimated cumulative saving for both programs after 10 years is $11,332,899.
Sensitivity analysis
We conducted a univariate sensitivity analysis of the model at various levels of access to determine the degree of impact on total costs and ROI. When the CHW program’s Access effect was adjusted down to 1% (from the baseline of 5%), the total access score fell from 19 to 4 in year 1 and from 380 to 76 in year 10. As expected, this then reduced access-related costs from $122,766 to $24,553 in year 1 and from $1.9 million to $414,485 in year 10. These reduced costs resulted in the programs generating a positive ROI earlier. Whereas the programs did not generate a positive ROI until year 4 under the base rate assumption of a 5% Access effect, the programs generated a positive ROI by year 3 under an assumption of only a 1% Access effect.
When the CHW program’s Access effect was adjusted up to 10%, the total access score rose from 19 to 39 in year 1 and from 380 to 761 in year 10. As expected, this then grew access-related costs from $122,766 to $245,532 in year 1 and from $1.9 million to $3.7 million in year 10. At a 10% Access effect, the programs did not generate a positive ROI until year 6.
Discussion
We began this study by highlighting the tension between the business case perspective of health care policy evaluation and the zero-sum nature of health care’s iron triangle. As policymakers become more attuned to ROI and the business case approach, careful attention must be paid to ROI-generating models and their consideration of the iron triangle’s three anchors: cost, quality, and access. This study attempted to incorporate access through a novel approach that allows users to estimate how a program either introduces new patients and, thus, costs, to health care or how it may result in treatment expansion. These estimates create a downward moderating pressure on ROI. For example, our model estimates an additional $1,858,274 in additional care consumed because of the CHW program improving patient access. This indirect cost more than doubles the program’s operating costs over 10 years. Without this consideration, the model would have predicted a positive ROI in the first year instead of the fourth year.
The model also produces a patient access score, which can be considered by policymakers when dealing with negative ROI projects or having to choose among programs with similar ROI. In this study, the CHW program yielded a patient access score of 380 by the project’s tenth year. This score could be compared later to other programs if the goal of policymakers was to maximize patient access.
Regarding the model’s estimated sources and amount of savings, our case study’s results are within parameters found elsewhere in the literature. Whitley et al’s34 9-month ROI evaluation of a CHW program yielded per patient savings of $507, which is slightly greater than our model’s per patient savings estimate of $412 after the program’s first year. Whitley et al’s study also demonstrated an increase in total health care utilization after the CHW intervention, as total visits grew from 5,211 to 6,630. This supports our model’s inclusion of a treatment expansion metric. It is plausible that the CHW program in Whitley et al’s evaluation also had some entrance effects, though the authors did not report on these individuals, as their evaluation was a pre–post design.
Other ROI evaluations of CHW programs yield similar results. That is, our model’s estimates come in slightly lower than that of others, which is likely a result of our access and outreach mechanisms having a downward moderating effect on estimated savings. For example, Fedder et al36 reported a per patient Savings effect of $2,240 through reduced ED and inpatient encounters after 27 months. Our model estimates per patient savings of $928 after 27 months. Similarly, Krieger et al35 found a Savings effect ranging from $57 to $80 per patient only after 2 months. Our model estimates per patient savings of $69 after 2 months.
Our model’s HIE-related estimates also fall within the parameters found in the literature, though empirical demonstrations of HIE-related savings are scant. Overhage et al39 found a savings of $26 per encounter for ED care after a 1 year randomized control trial. Our model estimates per patient savings of $11 after the HIE program’s first year and $27 after the program’s tenth year. Other studies have found a range of per patient savings ranging from $38840 to $2,700,12 both of which are well above our model’s estimates.
Taken together, our estimates suggest that the HIE and CHW programs will generate positive ROI for the New Mexico Medicaid program after 4 years and would cumulatively save over $34 million dollars, discounted, after 10 years. Given the Outreach effect and Access effect considerations of our model, it is likely that these estimates are conservative. For the CHW program, most of the costs are tied to improvements in patient access. These gains in patient access, despite their costs, should be encouraging for state policymakers. As has been demonstrated elsewhere, despite short-term increases in health care utilization and costs, net savings can be realized in the long term through more efficient consumption of health care.17,18,34,40
Limitations
There are limitations to our model and case study. Although our expenditure and program cost data were drawn from actual New Mexico Medicaid data and program implementation costs, our case study’s Health effect, Access effect, and Outreach effect were based on estimates. Although these estimates were drawn from the literature where available, and despite our results being within parameters found elsewhere in the literature, our estimates could be invalid. However, this weakness of the case study points to one of the strengths of the model – that the user can update these estimates with real data as they arrive and evaluate resulting changes in ROI. In this sense, the model can be regarded as a program implementation tool. As a program is implemented, the user can compare the model’s ex-ante estimates with real data to ensure that key indicators are being met.
Another limitation of our model is its extended time horizon makes it susceptible to patient churn – where patients switch health insurers, be they public or private, or experience gaps in their health insurance coverage. Because of churn, the funders of large programs (such as those covered in our case study) often incur the financial burden of treating patients early, but do not reap the benefits of healthier patients years later. This threat is certainly present in our case study as Medicaid patients – whose eligibility can be easily affected by even small changes in income – are particularly prone to churn. Nearly one-third of Medicaid patients in any given year are likely to churn between all coverage options.43,44
Conclusion
Few, if any, ROI analyses of health programs make systematic considerations of patient access, instead focusing on gains related to cost and quality. Our model shows that a rough estimation of gains in patient access can be incorporated in traditional ROI analyses. The results of our case study suggest that a CHW program and statewide HIE can generate a positive ROI for the state’s Medicaid program. By using a ROI model such as ours, state policymakers can look beyond just the business case of a health program and ask how it will also improve patient access.
Acknowledgment
This research was funded in part by the US Department of Health and Human Services, Centers of Medicare and Medicaid Services under Funding Opportunity Number CMS-1G1-14-001.
Disclosure
The authors report no conflicts of interest in this work.
References
Kissick WL. Medicine’s Dilemmas: Infinite Needs versus Finite Resources: Yale University Press; 1994. | ||
Edwardson N, Bolin JN, Mcclellan DA, Nash PP, Helduser JW. The cost-effectiveness of training US primary care physicians to conduct colorectal cancer screening in family medicine residency programs. Prev Med. 2016;85:98–105. | ||
Edwardson N, Kash BA, Janakiraman R. Measuring the impact of electronic health record adoption on charge capture. Med Care Res Rev. 2017;74(5):582–594. | ||
Bazzoli GJ, Lee W, Hsieh HM, Mobley LR. The effects of safety net hospital closures and conversions on patient travel distance to hospital services. Health Serv Res. 2012;47(1 Pt 1):129–150. | ||
Carroll A. The “iron triangle” of health care: access, cost, and quality. JAMA Forum. 2012. | ||
Leatherman S, Berwick D, Iles D, et al. The business case for quality: case studies and an analysis. Health Aff. 2003;22(2):17–30. | ||
Reiter KL, Kilpatrick KE, Greene SB, Lohr KN, Leatherman S. How to develop a business case for quality. Int J Qual Health Care. 2007;19(1):50–55. | ||
Institute of Medicine. Creating a Business Case for Quality Improvement Research: Expert Views: Workshop Summary. Washington, DC: The National Academies Press; 2008. | ||
Menachemi N, Brooks RG. Reviewing the benefits and costs of electronic health records and associated patient safety technologies. J Med Syst. 2006;30(3):159–168. | ||
Kilpatrick KE, Lohr KN, Leatherman S, et al. The insufficiency of evidence to establish the business case for quality. Int J Qual Health Care. 2005;17(4):347–355. | ||
Greene SB, Reiter KL, Kilpatrick KE, Leatherman S, Somers SA, Hamblin A. Searching for a business case for quality in Medicaid managed care. Health Care Manage Rev. 2008;33(4):350–360. | ||
Carr CM, Gilman CS, Krywko DM, Moore HE, Walker BJ, Saef SH. Observational study and estimate of cost savings from use of a health information exchange in an academic emergency department. J Emerg Med. 2014;46(2):250–256. | ||
Eyster L, Bovbjerg R. Promising Approaches to Integrating Community Health Workers into Health Systems: Four Case Studies. Washington DC: Urban Institute. December 2013. | ||
Millman M. Committee on Monitoring Access to Personal Health Care Services. Washington, DC: National Academy Press; 1993. | ||
Agency for Healthcare Research and Quality. National Healthcare Disparities Report. In: Services UDaHH, ed. Rockville, Marlyand; 2008. | ||
Civan A, Köksal B. The effect of newer drugs on health spending: do they really increase the costs? Health Econ. 2010;19(5):581–595. | ||
Cutler DM, Mcclellan M. Is technological change in medicine worth it? Health Aff. 2001;20(5):11–29. | ||
Shapiro I, Shapiro MD, Wilcox D. Measuring the value of cataract surgery. Medical Care Output and Productivity. University of Chicago Press; 2001:411–438. | ||
Agency for Healthcare Research and Quality. Defining the PCMH. In: Services UDoHH, ed. Rockville, MD; 2016. | ||
Grumbach K, Grundy P. Outcomes of implementing patient centered medical home interventions. Wash DC Patient-Centered Prim Care Collab. 2010. | ||
Swider SM. Outcome effectiveness of community health workers: an integrative literature review. Public Health Nurs. 2002;19(1):11–20. | ||
H.15 Selected interest rates. 2015, 2015. | ||
Andrew Briggs MS, Claxton K. Decision Modelling for Health Economic Evaluation. Oxford: Oxford University Press; 2006. | ||
Brownson RC, Haire-Joshu D, Luke DA. Shaping the context of health: a review of environmental and policy approaches in the prevention of chronic diseases. Annu Rev Public Health. 2006;27:341–370. | ||
Forjuoh SN, Ory MG, Jiang L, Vuong AM, Bolin JN. Impact of chronic disease self-management programs on type 2 diabetes management in primary care. World J Diabetes. 2014;5(3):407–414. | ||
The Healthcare Costs of Obesity; 2015. Available from: http://stateofobesity.org/healthcare-costs-obesity/. Accessed April, 2016. | ||
ACS. Tobacco: the true cost of smoking; 2015. Available from: http://www.cancer.org/research/infographicgallery/tobacco-related-healthcare-costs. Accessed April 3, 2016. | ||
ADA. The cost of diabetes; 2015. Available from: http://www.diabetes.org/advocacy/news-events/cost-of-diabetes.html. Accessed April 3, 2016. | ||
New Mexico Department of Health. Health system innovation for a healthier New Mexico. Presented at New Mexico stakeholder summit; August 19, 2015; Albuquerque, NM. | ||
Butler M, Kane RL, Mcalpine D, et al. Does integrated care improve treatment for depression? A systematic review. J Ambul Care Manage. 2011;34(2):113–125. | ||
Rosenthal EL, Brownstein JN, Rush CH, et al. Community health workers: part of the solution. Health Aff. 2010;29(7):1338–1342. | ||
Perry HB, Zulliger R, Rogers MM. Community health workers in low-, middle-, and high-income countries: an overview of their history, recent evolution, and current effectiveness. Annu Rev Public Health. 2014;35(1):399–421. | ||
Community Health Workers. Occupational Employment and Wages; 2015. Available from: http://www.bls.gov/oes/current/oes211094.htm#nat. Accessed February 22, 2017. | ||
Whitley EM, Everhart RM, Wright RA. Measuring return on investment of outreach by community health workers. J Health Care Poor Underserved. 2006;17(1 Suppl):6–15. | ||
Krieger JW, Takaro TK, Song L, Weaver M. The Seattle-King County Healthy Homes Project: a randomized, controlled trial of a community health worker intervention to decrease exposure to indoor asthma triggers. Am J Public Health. 2005;95(4):652–659. | ||
Fedder DO, Chang RJ, Curry S, Nichols G. The effectiveness of a community health worker outreach program on healthcare utilization of west Baltimore City Medicaid patients with diabetes, with or without hypertension. Ethn Dis. 2003;13(1):22–27. | ||
Prezio EA, Cheng D, Balasubramanian BA, Shuval K, Kendzor DE, Culica D. Community Diabetes Education (CoDE) for uninsured Mexican Americans: a randomized controlled trial of a culturally tailored diabetes education and management program led by a community health worker. Diabetes Res Clin Pract. 2013;100(1):19–28. | ||
Sweet MA, Appelbaum MI. Is home visiting an effective strategy? A meta-analytic review of home visiting programs for families with young children. Child Dev. 2004;75(5):1435–1456. | ||
Overhage JM, Dexter PR, Perkins SM, et al. A randomized, controlled trial of clinical information shared from another institution. Ann Emerg Med. 2002;39(1):14–23. | ||
Frisse ME, Johnson KB, Nian H, et al. The financial impact of health information exchange on emergency department care. J Am Med Inform Assoc. 2012;19(3):328–333. | ||
Furukawa MF, King J, Patel V, Hsiao CJ, Adler-Milstein J, Jha AK. Despite substantial progress In EHR adoption, health information exchange and patient engagement remain low in office settings. Health Aff. 2014;33(9):1672–1679. | ||
Community Health Worker National Workforce Study. 2007. | ||
Buettgens M, Nichols A, Dorn S. Churning Under the ACA and State Policy Options for Mitigation. Urban Institute; 2012. | ||
Guerra V, Mcmahon S. Minimizing care gaps for individuals churning between the marketplace and Medicaid: key state considerations. Center for Health Care Strategies Issue Brief. 2014. |
 © 2019 The Author(s). This work is published and licensed by Dove Medical Press Limited. The
full terms of this license are available at https://www.dovepress.com/terms
and incorporate the Creative Commons Attribution
- Non Commercial (unported, 3.0) License.
By accessing the work you hereby accept the Terms. Non-commercial uses of the work are permitted
without any further permission from Dove Medical Press Limited, provided the work is properly
attributed. For permission for commercial use of this work, please see paragraphs 4.2 and 5 of our Terms.
© 2019 The Author(s). This work is published and licensed by Dove Medical Press Limited. The
full terms of this license are available at https://www.dovepress.com/terms
and incorporate the Creative Commons Attribution
- Non Commercial (unported, 3.0) License.
By accessing the work you hereby accept the Terms. Non-commercial uses of the work are permitted
without any further permission from Dove Medical Press Limited, provided the work is properly
attributed. For permission for commercial use of this work, please see paragraphs 4.2 and 5 of our Terms.