
Back to Journals » Drug Design, Development and Therapy » Volume 20
An Immune Model Incorporating NK Cells and IL-12 to Predict the Efficacy of the Initial Treatment Cycle of Efgartigimod in Generalized Myasthenia Gravis
Authors Xin H, Zhong Y  , Zhang M, Wu L, Li Q, Li X , Wu Y, Zhang L, Peng J, Xie C, Zhu D , Hao Y, Guan Y, Wang K
Received 25 January 2026
Accepted for publication 12 May 2026
Published 18 May 2026 Volume 2026:20 598742
DOI https://doi.org/10.2147/DDDT.S598742
Checked for plagiarism Yes
Review by Single anonymous peer review
Peer reviewer comments 2
Editor who approved publication: Professor Tamer Ibrahim
Hanyu Xin,1,* Yuan Zhong,1,* Mengze Zhang,2 Lianshuang Wu,1 Qiuju Li,1 Xia Li,3 Yanan Wu,3 Lu Zhang,3 Jing Peng,2 Chong Xie,2 Desheng Zhu,2 Yong Hao,2 Yangtai Guan,1 Kan Wang1,2
1Department of Neurology, Punan Branch of Renji Hospital, Shanghai Jiao Tong University School of Medicine (Punan Hospital in Pudong New District), Shanghai, 200125, People’s Republic of China; 2Departments of Neurology, Renji Hospital, School of Medicine, Shanghai Jiao Tong University, Shanghai, 200127, People’s Republic of China; 3Department of Neurology, Anhui No. 2 Provincial People’s Hospital, Hefei, 230041, People’s Republic of China
*These authors contributed equally to this work
Correspondence: Yangtai Guan, Department of Neurology, Punan Branch of Renji Hospital, Shanghai Jiao Tong University School of Medicine (Punan Hospital in Pudong New District, Shanghai), Shanghai, 200125, People’s Republic of China, Email [email protected] Kan Wang, Department of Neurology, Renji Hospital, School of Medicine, Shanghai Jiao Tong University, Shanghai, 200127, People’s Republic of China, Email [email protected]
Background: Efgartigimod (EFG), a neonatal Fc receptor (FcRn) antagonist for generalized myasthenia gravis (gMG), exhibits variable treatment responses. This study aimed to investigate the associations of baseline clinical characteristics and multidimensional immune profiles with the clinical response to EFG in patients with acetylcholine receptor antibody-positive (AChR+) gMG, and develop a predictive model.
Methods: This multicenter retrospective observational study enrolled 35 AChR+ gMG patients who received at least one cycle of EFG. Responders were defined as those achieving a Myasthenia Gravis Activities of Daily Living (MG-ADL) score reduction of ≥ 2 points that was sustained for ≥ 1 month. After univariable screening, three models (Clinical, Immune, Integrated) were constructed using a complete-case modeling subset of 26 patients via multivariable logistic regression, least absolute shrinkage and selection operator (LASSO), and random forest algorithms. The optimal model was selected via leave-one-out cross-validation (LOOCV) and translated into a clinical risk score and an online calculator.
Results: Among 35 patients, 25 responded (68.6%). Non-responders had significantly higher baseline NK cell counts (p = 0.013) and showed a trend toward lower IL-12p70 levels (p = 0.095). Both NK cell (OR = 0.985) and IL-12p70 (OR = 11.657) were independent predictors of EFG response. The Immune Model (NK cells + IL-12p70) demonstrated robust discrimination (AUC = 0.861), outperforming the Clinical Model (AUC = 0.625, p = 0.021) and the Integrated Model (AUC = 0.847, p = 0.782). It showed good calibration and clinical utility. Bootstrap validation confirmed robustness (corrected AUC = 0.872, optimism=0.017). A derived clinical risk score stratified patients into high (100%), moderate (80.0%), and low (33.3%) response probability groups. An online prediction calculator was developed.
Conclusion: Baseline NK cell counts and IL-12p70 levels may predict EFG response in AChR+ gMG. The dual-biomarker Immune Model demonstrates robust performance, and has been translated into an online tool but yet requires validation in prospective, larger cohorts.
Keywords: myasthenia gravis, natural killer cells, interleukin-12, biomarkers, predictive model
Introduction
Myasthenia gravis (MG) is an autoimmune disease mediated by pathogenic autoantibodies targeting components of the neuromuscular junction (NMJ). Among these, IgG antibodies against the acetylcholine receptor (AChR) represent the primary pathogenic factor in generalized myasthenia gravis (gMG).1 These antibodies disrupt the postsynaptic membrane structure and impair normal neuromuscular signal transmission through mechanisms such as complement activation, antigenic modulation, and functional blockade, leading to fluctuating skeletal muscle weakness in patients and significantly compromising their activities of daily living and quality of life. However, contemporary understanding of MG pathogenesis extends beyond a simple autoantibody-mediated paradigm, revealing a complex network where cytokines and distinct lymphocyte subsets are deeply intertwined. Within this network, specific immune markers play pivotal roles in driving or regulating the disease. For instance, interleukin-12 (IL-12) potently drives B cell class switching to highly pathogenic IgG1 and IgG3 subclasses—which are the exact primary targets cleared by EFG.2,3 Concurrently, natural killer (NK) cells, which normally act as a crucial immunoregulatory “brake” against autoreactive B cells and follicular helper T cells, often face profound functional exhaustion in chronic autoimmune settings.4,5
Existing treatments for MG primarily encompass symptomatic relief and immunomodulation. First-line symptomatic treatments such as acetylcholinesterase inhibitors can transiently improve weakness,6 while corticosteroids, conventional non-steroidal immunosuppressants, and targeted biologics are employed to mitigate the aberrant immune response.7 Additionally, thymectomy is considered effective for thymoma-associated MG and may benefit some patients seropositive for AChR antibodies.8 During acute exacerbations, rapid intervention with Double-Filtration Plasmapheresis (DFPP) or intravenous immunoglobulin (IVIg) is often required,9 with critical cases necessitating respiratory support. Despite the widespread clinical application of these therapies, there remain challenges including heterogeneous treatment responses among patients, significant side effects, and complexities in long-term management.
In recent years, the treatment strategy for gMG has evolved from broad-spectrum immunosuppression toward a new phase of targeted and precision therapy. Among these advances, drugs targeting the neonatal Fc receptor (FcRn) have transformed the therapeutic landscape. Efgartigimod (EFG), as the first approved FcRn antagonist, competitively binds to FcRn to accelerate the clearance of endogenous IgG, including pathogenic AChR-IgG. Beyond accelerating IgG degradation, recent evidence suggests that EFG exerts pleiotropic immunomodulatory effects by targeting FcRn on professional immune cells. Specifically, EFG can disrupt FcRn-mediated antigen presentation in dendritic cells, thereby suppressing T cell activation, and promote the expansion of regulatory plasma cells to restore immune tolerance.10,11 These mechanisms likely synergize with antibody clearance to drive deep clinical responses, underscoring the importance of exploring multidimensional immune biomarkers to predict therapeutic efficacy. The Phase III ADAPT study demonstrated that EFG elicited a response in 68% of AChR antibody-positive patients, significantly surpassing the 30% rate in the placebo group, with EFG demonstrating a favorable safety profile. Subsequent real-world studies have further confirmed the effectiveness and tolerability of EFG in clinical practice.12,13 For instance, our recent prospective comparative study validated EFG’s efficacy in managing acute exacerbations, highlighting the necessity of severity-stratified treatment strategies when compared to DFPP.14 However, despite EFG’s overall response rate being significantly superior to placebo, approximately 30% of patients did not achieve clinically meaningful improvements within the first treatment cycle, indicating significant interindividual variability in treatment response. To date, no reliable pretreatment predictive biomarkers have been established to accurately stratify potential responders to EFG.15 Although certain clinical characteristics are correlated with treatment outcomes, their predictive utility is limited and insufficient to guide individualized treatment decisions in routine clinical practice.16 Therefore, developing biomarkers that can objectively reflect a patient’s immune status and possess high predictive value is crucial for enhancing the precision and therapeutic benefit of EFG in clinical application.
To address this gap, our study aims to systematically analyze baseline multidimensional immune characteristics, including peripheral immune cell subsets and cytokine profiles, to explore their association with treatment response to EFG in AChR antibody-positive gMG (AChR+ gMG) patients. Furthermore, we seek to construct a predictive model with clinical translational potential, thereby providing a basis for achieving individualized precision therapy.
Methods
Study Design and Participants
This study was a multicenter, retrospective, observational cohort study designed to develop and validate a prediction model for treatment response to EFG in patients with AChR+ gMG. Patients who received at least one standard cycle of EFG treatment between February 2024 and October 2025 across three medical centers were enrolled. Ultimately, 35 eligible patients were included in the final analysis (Figure 1).
 |
Figure 1 Flowchart of subject screening and enrollment. Patients with AChR+ gMG who had received efgartigimod therapy were screened across three centers between February 2024 and October 2025. After applying the inclusion and exclusion criteria, 35 patients were enrolled for general clinical analysis. An additional 9 patients were excluded due to missing baseline immunological data, resulting in a final cohort of 26 patients for predictive model construction. Abbreviations: AChR, acetylcholine receptor; gMG, generalized myasthenia gravis; IVIG, intravenous immunoglobulin; PLEX, plasma exchange; NK, natural killer; IL-12p70, interleukin-12p70. |
Inclusion and Exclusion Criteria
The inclusion criteria were as follows: (1) age ≥ 18 years; (2) diagnosis of MG meeting international diagnostic criteria, supported by seropositivity for AChR antibodies and/or confirmatory neurophysiological studies; (3) confirmed gMG with a baseline Myasthenia Gravis Activities of Daily Living (MG-ADL) score ≥ 5; (4) receipt of the standard EFG regimen (10 mg/kg intravenously once weekly for 4 weeks per cycle) with completion of the first treatment cycle and efficacy follow-up at week 4 after the initial infusion; (5) availability of complete baseline blood samples and clinical data.
The following exclusion criteria were applied: (1) co-existence of other systemic autoimmune diseases; (2) treatment with B-cell depleting agents within 6 months prior to enrollment; (3) receipt of high-dose intravenous corticosteroid pulse therapy, IVIg or PE within 1 month prior to enrollment; (4) unstable dosage of oral immunomodulatory drugs within 3 months prior to enrollment; (5) severe organ dysfunction or active malignancy (with the exception of thymoma); (6) pregnancy or lactation. To ensure stability of the immune state assessment, dosages of oral corticosteroids and immunosuppressants were required to be stable for at least 3 months prior to the first dose of EFG for all included patients.
Efgartigimod Alfa Injection (brand name: VYVGART®; supplier: argenx BV, Industriepark Zwijnaarde 7, 9052 Zwijnaarde, Belgium) used in this study was procured through the hospital’s official supply channels. Its storage and administration complied with the regulations of the National Medical Products Administration (NMPA) of China and the hospital’s pharmaceutical management protocols.
Data Collection and Baseline Variables
Prior to initiating EFG treatment, baseline data including clinical characteristics and immunological and serological biomarkers were systematically retrieved from electronic medical records. Clinical characteristics assessed included demographic information, disease features (disease duration, Myasthenia Gravis Foundation of America classification (MGFA), thymus status), concomitant medications, and clinical scores from the Myasthenia Gravis-Activity of Daily Living (MG-ADL) and Quantitative Myasthenia Gravis (QMG). All blood samples were collected immediately prior to the first infusion. Immunological and Serological Biomarkers included AChR antibody titers;17 serum levels of immunoglobulin (IgG, IgM, IgA) and complement (C3, C4, CH50, C1q);18 routine laboratory parameters (neutrophil count, serum albumin, platelet count);19–21 peripheral blood lymphocyte subsets (T cells, B cells, NK cells, and their subpopulations) analyzed via flow cytometry; and a broad spectrum of serum cytokines (including IL-1β, IL-2, IL-4, IL-5, IL-6, IL-8, IL-10, IL-12p70, IL-17A, TNF-α, IFN-α, IFN-γ) measured using multiplex bead-based immunoassay technology. All flow cytometry and multiplex immunoassay procedures were performed strictly according to the manufacturer’s standard operating procedures. Matched quality control materials were used for both intra- and inter-assay quality control to ensure the consistency and comparability of the results.
Outcome Definition
Responders were defined according to the ADAPT trial criteria12 as patients who achieved a reduction of ≥ 2 points in the MG-ADL score that was sustained for at least 4 consecutive weeks, with the initial improvement occurring at week 4 (within 1 week after the fourth infusion) of the first treatment cycle. To maintain a focused evaluation of early predictive biomarkers, this study analyzed the clinical response exclusively within the first standard treatment cycle, and data regarding subsequent cycles or inter-cycle intervals were not included in the current analysis.
Development, Validation, and Assessment of Predictive Models
This study adhered to the Transparent Reporting of a multivariable prediction model for Individual Prognosis Or Diagnosis (TRIPOD) statement and followed established methodological principles for prediction model development.22,23 The workflow comprised four sequential stages: data preprocessing and feature screening, model construction and algorithm selection, model performance evaluation and selection, and finally, model validation and robustness assessment.
Data Preprocessing and Feature Screening
To ensure a robust modeling foundation, rigorous data cleaning was first performed. Post-treatment variables were excluded to prevent data leakage, and variables with a missing rate exceeding 30% were removed. Subsequently, univariable analysis (Mann–Whitney U-test for continuous variables and Fisher’s exact test for categorical variables, with a significance threshold of α = 0.10) was employed to screen for baseline variables potentially associated with treatment response.
Candidate predictors were selected following a purposeful selection process to balance clinical relevance and statistical rigor. Variables with p < 0.10 in the univariable analysis, alongside a priori specified clinical variables (age and sex), were included in the candidate pool. This pre-filtering approach was specifically adopted to maintain a reasonable events-to-variable ratio and ensure algorithm stability given the relatively small sample size.
Model Construction and Algorithm Selection
We aimed to evaluate the predictive value of different data dimensions by constructing and comparing three distinct model types: a Clinical Model (incorporating only clinical features), an Immune Model (incorporating only immunological markers), and an Integrated Model (combining both). For each model type, we systematically implemented and compared three machine learning algorithms: (1) Multivariable Logistic Regression (LR), serving as an interpretable baseline model;24 (2) Least Absolute Shrinkage and Selection Operator (LASSO) regression (implemented via the glmnet package), which utilizes L1 regularization for internal feature selection to identify the most robust multivariable predictors while mitigating the potential limitations of initial univariable screening;25 and (3) Random Forest (RF) (implemented via the randomForest package), an ensemble learning method capable of capturing potential non-linear relationships.26 For the RF modeling, the number of trees (ntree) was set to 500 to ensure out-of-bag error convergence, while the number of variables sampled at each split (mtry) was set to the default square root of the total number of predictors. The importance parameter was enabled to calculate the Mean Decrease Gini for feature ranking. For the LR models, interaction terms between predictor variables were tested.
Model Performance Evaluation and Optimal Model Selection
Internal validation was performed using leave-one-out cross-validation (LOOCV). Specifically, in each of the n iterations (n being the sample size of the modeling subset), n-1 samples were utilized to train the models, and the resulting models were applied to predict the probability for the single hold-out sample. Notably, for the LASSO model within the LOOCV loop, an internal 10-fold cross-validation was conducted exclusively on the n-1 training set to identify the optimal penalty parameter (λ), thereby strictly preventing data leakage.
Model performance was comprehensively assessed across three key dimensions: discrimination (evaluated by the area under the receiver operating characteristic curve [AUC] and its 95% confidence interval), calibration (assessed via calibration curves and the Brier score), and clinical utility (analyzed using decision curve analysis). Based on this multidimensional assessment, the optimal algorithm was selected for each of the three model types. A final comparative analysis was then conducted among these three optimal models (Clinical, Immune, and Integrated). The definitive model was selected by applying the principle of parsimony (Occam’s Razor) alongside its overall performance profile.
Model Validation and Robustness Assessment
To evaluate the stability and generalizability of the final selected model and to assess potential overfitting, a dual validation strategy was implemented. First, the Bootstrap resampling method (with 200 replicates, via the boot package) was used to estimate and correct for optimism and to verify the stability of the final predictors across different data scenarios. Second, a sensitivity analysis was conducted using Multiple Imputation by Chained Equations (MICE, via the mice package) to investigate the potential impact of missing data on the results. For this analysis, the Predictive Mean Matching (PMM) method was used to generate 20 imputed datasets. The results from these datasets were then pooled according to Rubin’s rules to verify the consistency and reliability of the core predictors.
Interpretability of Predictive Model and Development of Clinical Tools
Shapley Additive Explanation (SHAP) analysis was performed using SHAP values to elucidate the contribution of each feature in the final model to individual predictions. To facilitate clinical application, a clinical risk score system and an online calculator were developed. Based on the regression coefficients of the final model, key continuous variables were converted into scores according to their tertiles to construct a simplified risk stratification system. An interactive online prediction calculator was created, and a predictive nomogram was generated to assist clinicians in rapid individualized risk assessment and treatment decision-making.
Statistical Analysis
All statistical analyses and model construction were performed using R software (Version 4.5.0). Key R packages utilized in this study included glmnet and randomForest for machine learning algorithm implementation, pROC for ROC curve analysis, dcurves for decision curve analysis, boot for internal validation, and mice for multiple imputation. Continuous variables conforming to a normal distribution are presented as mean ± standard deviation, while non-normally distributed variables are presented as median (interquartile range). Group comparisons for continuous variables were conducted using independent samples t-tests or the Mann–Whitney U-test. Categorical variables are presented as frequencies (percentages), and group comparisons were made using Fisher’s exact test or the chi-square test. Except for the variable screening stage (α=0.10), a two-sided p-value < 0.05 was considered statistically significant for all hypothesis testing. Differences in the area under the curve (AUC) between models were compared using DeLong’s test.
Results
Patient Characteristics
A total of 35 AChR+ gMG patients treated with EFG were enrolled in this study. The cohort had a mean age of 63.97 ± 14.29 years, including 12 males (34.3%) and 23 females (65.7%). The overall treatment response rate was 68.6% (24/35). No statistically significant differences were observed between the responders and non-responders regarding age, sex, disease duration, baseline MG-ADL score, or AChR antibody titers (all p > 0.05, Table 1). Notably, the majority of the enrolled patients (71.4%, 25/35) were classified as having late-onset MG (age at onset > 50 years). The prevalence of thymoma was numerically higher in the non-responder group compared to the responder group (36.4% vs 12.5%, p = 0.171), and non-responders showed a trend toward moderate-to-severe MGFA classifications (MGFA ≥ 2b, 81.8% vs 45.8%, p = 0.069), although these differences did not reach statistical significance. It should be noted that for the patients with thymoma included in this study, efgartigimod was administered as a perioperative optimization therapy (bridging to thymectomy) or for the management of severe postoperative refractory symptoms. All thymoma patients eventually underwent surgical resection as their primary oncological treatment.
 |
Table 1 Baseline Demographic and Clinical Characteristics |
Univariable Analysis and Predictor Screening
To identify potential biomarkers associated with the short-term efficacy of EFG, univariable analysis was performed on a total of 34 baseline variables from the 35 enrolled patients (Supplementary Figure 1 and Supplementary Table 1). NK cell count (p = 0.013) demonstrated a significant association with treatment response, while MGFA classification (p = 0.069) and IL-12p70 levels (p = 0.095) showed marginal associations (p < 0.10). Consequently, these variables were included in subsequent multivariable modeling.
For prediction model construction, rigorous data preprocessing was applied, resulting in a final modeling subset of 26 patients with complete data for NK cells and IL-12p70. This modeling subset remained representative of the overall cohort, showing no statistically significant differences in key clinical characteristics such as age, sex, and MGFA classification (all p > 0.05, Table 1, Supplementary Table 2). The response rate in this subset was 69.2% (18/26). These findings suggest that the exclusion of some patients due to missing data did not introduce significant selection bias, justifying the analysis based on this subset.
Optimization of Variable Combinations for Predictive Models
To construct robust predictive models, we first optimized the variable combinations for both the Clinical and Integrated models based on discrimination, calibration, and Akaike Information Criterion (AIC) assessed via LOOCV. For the Clinical Model, we compared three clinical variable combinations: Model A (MGFA, age, sex), Model B (MGFA, thymoma), and Model C (MGFA, age, sex, thymoma). Results indicated that Model C exhibited the relatively highest discriminative ability (AUC = 0.625, 95% CI: 0.424–0.924). Consequently, MGFA, age, sex, and thymoma were selected as the final variable set for the Clinical Model (Figure 2A and B). Similarly, to explore the predictive potential of combining clinical and immunological markers for the Integrated Model, variable selection was performed. Based on the lowest AIC and optimal LOOCV performance, a parsimonious 3-variable set comprising MGFA, NK cells, and IL-12p70 was identified as the optimal combination (Figure 2C and D). These optimized variable sets were subsequently utilized for algorithm evaluation.
 |
Figure 2 Evaluation and optimization of model construction strategies. (A) ROC curve comparison of Clinical Models. Clinical Model C (incorporating MGFA, age, sex, and thymoma) achieved the highest AUC (0.625), yet its overall discriminatory ability remained limited. (B) Calibration assessment of Clinical Models. Although Model C had the highest AUC, Model B (including only MGFA and thymoma) yielded the lowest Brier score (0.194), indicating superior calibration. (C) ROC curve comparison of Integrated Models. A parsimonious 3-variable model (MGFA + NK cells + IL-12p70) demonstrated the best discriminatory ability (AUC = 0.819), outperforming more complex variable combinations. (D) Selection of Integrated Models based on AIC. The 3-variable model had the lowest AIC value (21.4), achieving the optimal balance between goodness-of-fit and complexity, and was therefore identified as the final optimal model. Abbreviations: MGFA, Myasthenia Gravis Foundation of America; ROC, receiver operating characteristic; AUC, area under the receiver operating characteristic curve; AIC, Akaike information criterion. |
Development, Evaluation, and Algorithm Selection for Clinical Model
Based on the optimized clinical variable set (MGFA, age, sex, and thymoma), a systematic comparison of three modeling algorithms—LR, LASSO, and RF—revealed that the LR algorithm performed best on the validation set. Although its calibration curve demonstrated a certain degree of deviation (Slope=0.336), the Hosmer-Lemeshow test (p = 0.089) indicated that its goodness-of-fit remained within an acceptable range. More importantly, the LR model exhibited the highest discriminatory ability (AUC = 0.625), which was significantly superior to that of the LASSO (0.527) and RF (0.500) models. Furthermore, decision curve analysis showed that within a clinically common decision threshold range (30%), the LR model provided the highest net clinical benefit (0.554), demonstrating favorable clinical utility (Figure 3A–C).
 |
Figure 3 Comprehensive performance evaluation of Clinical Models. (A) ROC curve analysis. The LR model achieved the highest AUC (0.625), demonstrating superior discrimination compared to the LASSO and RF models. (B) Calibration curve analysis. The calibration of the LASSO and RF models was superior to that of the LR model, aligning more closely with the ideal curve. (C) Decision curve analysis. Both the LR and LASSO models showed favorable net clinical benefit within the commonly used clinical threshold range. (D) RF error convergence plot. The RF error stabilized when the number of trees reached 200–300. (E) RF variable importance ranking. Age was the most important predictor, followed by MGFA classification, thymoma, and sex. (F) Model performance radar chart. The LR model excelled in AUC and sensitivity, while the RF model demonstrated advantages in calibration and specificity. Abbreviations: LR, logistic regression; LASSO, least absolute shrinkage and selection operator; RF, random forest; ROC, receiver operating characteristic; AUC, area under the receiver operating characteristic curve; DCA, decision curve analysis; OOB, out-of-bag; MGFA, Myasthenia Gravis Foundation of America. |
Regarding model stability and feature contribution, the RF variable importance plot identified age as the primary predictor, followed by MGFA and thymoma. However, the classification error analysis revealed a high misclassification rate of 63.6% for non-responders in the RF model, suggesting notable prediction bias (Figure 3D and E).
Based on a comprehensive assessment of discrimination, calibration, and clinical utility, the LR algorithm was employed to construct the final Clinical Model containing MGFA, age, sex, and thymoma (Figure 3F). However, the modest AUC of 0.625 indicates that reliance solely on traditional clinical characteristics may provide limited predictive precision.
Development and Multidimensional Evaluation of Immune Model
Given the limited predictive performance of the Clinical Model, we further explored the predictive value of the immunological markers—total NK cell counts and IL-12p70 level—and systematically compared the performance of three algorithms using this variable combination. Multivariable logistic regression analysis identified both NK cells (β = −0.015, OR = 0.985, 95% CI: 0.972–0.998, p = 0.028) and IL-12p70 (β = 2.456, OR = 11.657, 95% CI: 1.213–112.056, p = 0.033) as independent predictors of treatment response. The wide confidence interval for IL-12p70 likely reflects limitations in sample size and suggests that the findings require further validation in larger cohorts. The Hosmer–Lemeshow test indicated adequate goodness-of-fit (χ2 = 6.32, p = 0.856) and no significant interaction was observed between NK cells and IL-12p70 (p = 0.412).
Based on multidimensional performance evaluation, three algorithms exhibited distinct performance profiles. ROC curve analysis showed that RF model demonstrated highest discrimination (AUC = 0.882). The LR and LASSO models followed closely, both achieving an AUC of 0.861 (95% CI: 0.701–1.000), indicating robust performance highly comparable to that of the RF model which was more complex. Regarding calibration performance, the RF model demonstrated near-perfect calibration agreement (Slope = 1.002, Hosmer-Lemeshow test p = 0.945), followed by the LR model (Slope = 0.634, p = 0.856), while the LASSO model performed relatively poorly (Slope = 0.502, p = 0.032). Decision curve analysis revealed that within a clinically common decision threshold range (30%), the LR model provided the highest net clinical benefit (0.588), outperforming the RF model (0.516) and the LASSO model (0.555) (Figure 4A–C).
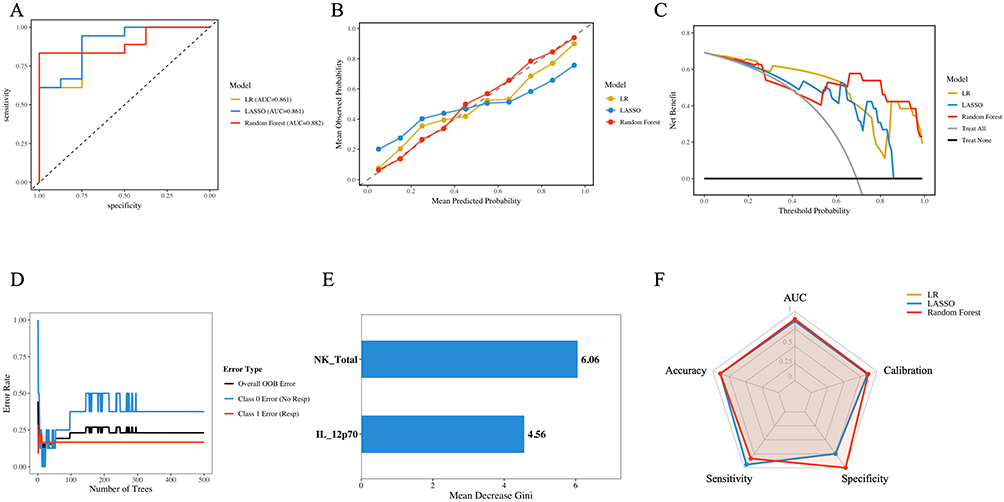 |
Figure 4 Comprehensive performance evaluation of Immune Models. This figure presents performance analyses of LR, LASSO, and RF models constructed using immune biomarkers. (A) ROC curve analysis. The ROC curves indicate the RF model achieved the highest AUC (0.882), while the LR and LASSO models demonstrated comparable performance (AUC = 0.861). (B) Calibration curve analysis. The RF model exhibited the best calibration, with LR performing better than LASSO. (C) Decision curve analysis. The LR model provided the highest net benefit across commonly used clinical decision thresholds. (D) RF error convergence plot. The out-of-bag (OOB) error for the RF model stabilized at approximately 500 trees. (E) RF variable importance ranking. NK cell counts and IL-12p70 level were identified as the primary predictive variables. (F) Model performance radar chart. The LR model showed superior sensitivity, whereas the RF model demonstrated higher specificity. Abbreviations: LR, logistic regression; LASSO, least absolute shrinkage and selection operator; RF, random forest; ROC, receiver operating characteristic; AUC, area under the receiver operating characteristic curve; DCA, decision curve analysis. |
Feature importance analysis was conducted. The LASSO coefficient path plot indicated that both NK and IL-12p70 were retained with stable coefficients, confirming their robust independent predictive value (Supplementary Figure 2). RF variable importance analysis further quantified their contributions, with NK cells having a higher weight (Mean Decrease Gini = 6.06) than IL-12p70 (4.56). In the trade-off between sensitivity and specificity, the LR model exhibited high sensitivity (0.944), efficiently identifying the vast majority of responders. In contrast, the RF model achieved perfect specificity (1.00) but had lower sensitivity (0.833) (Figure 4D–F).
Considering the model’s discrimination, calibration, clinical utility, and the principle of parsimony, we ultimately selected the LR algorithm to construct the Immune Model. The predictive formula was established as follows: “logit(P) = 3.021–0.015 × NK + 2.456 × IL-12p70”. This model demonstrated excellent discriminatory performance, good calibration agreement, and high clinical utility on the validation set. The current model analysis is based on a limited sample size (n=26). Therefore, its performance requires further validation in prospective, larger cohorts.
Development and Evaluation for Integrated Model and Final Selection
Using the optimized integrated variable set (MGFA, NK cells, and IL-12p70), we systematically evaluated the performance of three modeling algorithms. Among the algorithms, the RF model demonstrated the best comprehensive performance for the Integrated Model, achieving the highest AUC (0.847, 95% CI: 0.743–1.000), the most robust calibration (Calibration Slope = 1.183, Hosmer-Lemeshow test p = 0.712), and excellent specificity (0.875) (Figure 5A–C). Internal validation of the RF model showed a stabilizing out-of-bag (OOB) error of 23.08%, which converged as the number of trees increased, indicating good generalization stability. Variable importance analysis revealed that NK cells remained the predictor with the highest contribution (Mean Decrease Gini = 6.16), followed by IL-12p70 (3.97) (Figure 5D and E). In contrast, the LR model exhibited calibration drift after integration (Slope = 0.211), while the LASSO model, despite high sensitivity (0.944), suffered a significant loss in specificity (0.625) (Figure 5F).
 |
Figure 5 Comprehensive performance evaluation of Integrated Models. (A) ROC curve analysis. Under the integrated framework, the RF model achieved the highest AUC (0.847), demonstrating superior discrimination compared to the LR and LASSO models. (B) Calibration curve analysis. The RF model displayed the most robust calibration, whereas the LR model exhibited significant calibration distortion. (C) Decision curve analysis. The RF model provided a pronounced net clinical benefit across commonly used decision thresholds. (D) RF error convergence plot. The out-of-bag (OOB) error of the RF model stabilized when the number of trees reached approximately 200. (E) RF variable importance ranking. MGFA classification showed minimal contribution, and the model remained predominantly driven by the immune indicators (NK cells and IL-12p70). (F) Model performance radar chart. The RF model delivered the most balanced overall performance, while the LASSO model suffered a notable loss in specificity. Abbreviations: LR, logistic regression; LASSO, least absolute shrinkage and selection operator; RF, random forest; MGFA, Myasthenia Gravis Foundation of America; ROC, receiver operating characteristic; AUC, area under the receiver operating characteristic curve; DCA, decision curve analysis. |
The final decision was made. Although the integrated RF model performed well across multiple metrics, its performance gain primarily stemmed from the two immunological variables. The inclusion of the clinical variable (MGFA) did not yield a statistically significant improvement in predictive performance but instead increased model complexity. According to Occam’s Razor principle, we ultimately selected the pure Immune Model (containing only NK cells and IL-12p70) as the final core prediction tool, which was superior-performing, more parsimonious, and clinically interpretable.
Comprehensive Comparison Between Models
The Immune Model outperformed the Clinical and Integrated Models across most metrics (Figure 6A–D and Supplementary Table 3). It achieved the highest AUC (0.861), the highest accuracy (88.5%), the lowest Brier score (0.136), and the highest net clinical benefit at a 30% decision threshold (0.587). DeLong’s test indicated that the AUC of the Immune Model (LR) was significantly higher than that of the Clinical Model (LR) (p = 0.021). The AUC of the Integrated Model (RF) was also significantly higher than that of the Clinical Model (LR) (p = 0.035). However, there was no statistically significant difference in AUC between the Immune Model (LR) and the Integrated Model (RF) (p = 0.782). The results suggest that the Immune Model based on NK cells and IL-12p70 maintains high predictive performance while possessing good clinical applicability and interpretability. Nevertheless, its robustness and generalizability require confirmation in larger, external datasets.
 |
Figure 6 Comprehensive performance evaluation, interpretability analysis, and clinical translation of the optimal prediction model. (A) ROC curve analysis. The Immune Model (LR) achieved the highest AUC (0.861), which was statistically superior to the Clinical Model (AUC = 0.625) and slightly higher than the integrated model (AUC = 0.847). (B) Calibration curve analysis. The Immune Model demonstrated good calibration agreement. (C) Decision curve analysis. The Immune Model provided the highest net clinical benefit across commonly used decision thresholds. (D) Model performance radar chart. The Immune Model showed the most balanced overall performance. (E) SHAP interpretability analysis. NK cell count (negative correlation) and IL-12p70 level (positive correlation) were identified as the core predictive factors. (F) Bootstrap internal validation. The corrected calibration curve closely aligned with the ideal line (optimism = 0.0165), indicating no significant overfitting. (G) Immune model nomogram. A nomogram based on NK cells and IL-12p70 was constructed to facilitate individualized prediction of treatment response probability. Abbreviations: LR, logistic regression; ROC, receiver operating characteristic; AUC, area under the receiver operating characteristic curve; SHAP, shapley additive explanations. |
To elucidate the decision-making process of the optimal model (Immune LR), SHAP (Shapley Additive Explanations) analysis was performed. SHAP values indicated that total NK cell count was the most influential (mean absolute SHAP value 2.1236, contribution 61.85%), followed by IL-12p70 (contribution 38.15%). The SHAP summary plot (Figure 6E) visually demonstrates that lower NK cell counts and higher IL-12p70 levels are associated with a higher probability of treatment response.
To evaluate the stability, generalizability, and potential overfitting risk of the selected Immune Model, we conducted systematic internal validation and multidimensional sensitivity analyses. First, Bootstrap resampling validation (B = 200) yielded a corrected AUC of 0.872 (95% CI: 0.75–0.99) with an optimism of only 0.017, indicating a very low risk of model overfitting (Figure 6F). Second, multiple imputation analysis for missing data (N = 35, m = 20) revealed that the pooled effect estimates for NK cells (Pooled OR = 0.992) and IL-12p70 (Pooled OR = 4.058) were consistent in direction with the primary analysis, confirming that the core conclusions were not substantially affected by missing-data bias (Supplementary Table 4). Finally, the model demonstrated excellent stability and robustness regardless of whether variables were standardized or log-transformed (AUC consistently ranged from 0.86 to 0.89, Supplementary Table 5) or when stratified by different clinical subgroups (Supplementary Figure 3).
Development and Validation of Clinical Risk Scoring System
To facilitate clinical translation, we developed a risk stratification system based on the Immune Model. Based on the tertile distribution of NK cells and IL-12p70, along with the direction of their regression coefficients, a scoring standard was established (Supplementary Table 6). Patients were stratified into groups with high (4–6 points), moderate (2–3 points), and low (0–1 point) response potential groups. Validation in the 26 patients revealed a distinct response gradient: the low-score group had a response rate of 33.3%, the moderate-score group 80.0%, and the high-score group 100%. This system effectively differentiated patient groups with varying response potential (Supplementary Figure 4). Accordingly, a predictive nomogram (Figure 6G) and an interactive online calculator using HTML/JavaScript were developed (https://xinhanyu01.github.io/) to provide a practical tool for personalized clinical decision-making.
Discussion
To our knowledge, this study provides the first systematic evaluation of the association between peripheral immune markers—specifically NK cells and IL-12p70—and treatment response to EFG in patients with AChR+ gMG. Our preliminary findings suggest that lower baseline NK cell counts and higher serum IL-12p70 levels may be associated with superior short-term therapeutic outcomes. An immune predictive model constructed using these two biomarkers demonstrated superior discrimination, calibration, and clinical utility compared to a model based solely on conventional clinical features.
Regarding clinical characteristics, previous studies have suggested that late-onset MG may be associated with a more sustained response to EFG,15 whereas thymoma or coexisting autoimmune diseases have been identified as potential risk factors for non-response.27 In the present study, we similarly observed a higher proportion of thymoma in the non-responder group, and a trend toward lower response rates in patients with more severe disease, consistent with prior reports. However, multivariable analysis revealed that a Clinical Model based solely on age, sex, MGFA classification, and thymoma status possessed limited predictive performance. This suggests that in a complex immune-mediated disease like MG, reliance solely on clinical phenotypes is insufficient to accurately reflect the immunological heterogeneity relevant to the drug’s target. Incorporating biomarkers that reflect underlying immunological states may enhance prediction accuracy.
Regarding clinical characteristics, our study included a subset of patients with thymoma-associated MG (TAMG). It is important to emphasize that while complete surgical resection remains the definitive primary treatment for thymoma, surgery and immunomodulatory therapies are complementary rather than mutually exclusive. In our cohort, all TAMG patients eventually underwent thymectomy. EFG was utilized either as an essential “bridge-to-surgery” induction therapy to rapidly stabilize neuromuscular function and prevent postoperative myasthenic crisis (POMC) in patients with active disease, or as a targeted rescue therapy for refractory symptoms persisting after tumor resection. Recent prospective and real-world studies have increasingly validated the necessity of such rapid-acting FcRn antagonists in the perioperative multidisciplinary management of high-risk TAMG patients.28,29 Therefore, predicting EFG responsiveness in this specific subpopulation may hold substantial value for optimizing perioperative safety and long-term symptom control.
A pivotal finding of our study is that low baseline NK cell levels and high serum IL-12p70 levels are positively associated with the efficacy of EFG. NK cells, as key effectors of innate immunity, may play a dual role in MG pathogenesis, potentially contributing to autoimmune damage while also exerting regulatory functions by eliminating autoreactive immune cells.30 IL-12, primarily secreted by dendritic cells (DCs), monocytes/macrophages, and B cells, is a critical cytokine driving Th1 cell differentiation.31,32 Notably, Th1-type immune responses predominantly promote the production of IgG1 and IgG3 antibody subclasses, which are the primary pathogenic antibody subtypes in AChR+ gMG. Given that IgG1 and IgG3 constitute the primary pathogenic subclasses in AChR+ gMG and possess high affinity for FcRn, they represent the primary targets for EFG-mediated clearance.12 The recognized roles of NK cells and IL-12 in MG pathology provide a biological rationale supporting the plausibility of our findings.
Previously, Zhang et al observed a trend of functional exhaustion in NK cells from MG patients5 We hypothesize that the baseline “high IL‑12/low NK” immunophenotype observed in this study may reflect an interconnected pathological process rather than two independent events. Specifically, sustained elevation of pro-inflammatory IL-12 may lead to hyperactivation of NK cells, precipitating exhaustion or even apoptosis. Firstly, IL-12 is a key inducer of NK cell activation and interferon-gamma (IFN-γ) production. Under physiological conditions, DC-derived IL-12 acts in concert with IL-15 to promote NK cell effector functions and proliferation.33,34 However, excessive or chronic immune stimulation may drive NK cells into a state of hyporesponsiveness or exhaustion,35 consistent with our observations. Zhang et al further suggested that MG patients might impair NK cell survival and function by upregulating the SOCS2 gene and suppressing STAT5 signaling5 As STAT5 is a critical transcription factor governing cell survival, its inhibition disrupts transcriptional programs, ultimately promoting apoptosis. Similar impairment of NK cell function has also been observed in other autoimmune diseases such as systemic lupus erythematosus and type 1 diabetes. Secondly, the reduction in NK cells associated with high IL-12 levels may be linked to activation-induced cell death. Studies indicate that while stimulation with IL-12 combined with IL-15/IL-18 may confer memory-like features to NK cells, it could also reduce cell viability and increase apoptosis.36 The underlying mechanisms involve mitochondrial superoxide accumulation, reduced cristae density, and insufficient compensatory mitophagy, which collectively compromise cellular fitness. This provides a direct cellular biological explanation for the “high IL-12/low NK” profile, suggesting that a chronic high-inflammatory environment may compromise the survival capacity of NK cells.
Furthermore, this immunophenotype may signal more severe immune dysregulation and higher disease activity. NK cells not only possess effector functions but are also involved in immune regulation, such as suppressing excessive adaptive immune responses by eliminating immature DCs or activated T cells.34 When NK cells become exhausted or reduced due to overactivation, this immune surveillance function is likely weakened, potentially contributing to uncontrolled expansion of autoreactive T and B cells and thereby increasing the production of pathogenic autoantibodies (such as AChR antibodies) (Figure 7). Studies have shown that although cytokine-induced CD25 expression can enhance NK cell function, its maintenance depends on a specific cytokine microenvironment.37 Excessively high IL-12 levels in MG patients may disrupt this balance and exacerbate NK cell exhaustion.
 |
Figure 7 Hypothetical mechanism of high IL-12 and low NK predicting EFG response in MG. An elevated IL-12 milieu drives NK cells toward activation-induced cell death (AICD) due to excessive activation, thereby impairing their immunoregulatory function. This process diminishes the inhibitory control over autoreactive T and B cells, leading to increased production of pathogenic IgG antibodies. This inflammation-driven “high-antibody-burden” pathological state renders patients more sensitive to efgartigimod treatment, which acts by clearing IgG via the FcRn pathway. Abbreviations: DC, dendritic cell; AICD, activation-induced cell death; FcRn, neonatal Fc receptor. Notes: Solid arrows denote stimulation or induction; dashed arrows indicate compromised regulation or disinhibition. |
Therefore, patients exhibiting the “high IL-12/low NK” signature at baseline may represent a state of high inflammation-driven immune dysregulation with decompensated immunomodulation. In these patients, disease activity may be predominantly driven by high titers of pathogenic IgG antibodies. However, due to the retrospective design of this study, methods for AChR antibody detection varied, including cell-based assays and radioimmunoassays; moreover, IgG antibody subclass analysis was not performed. Thus, we were unable to evaluate potential differences in antibody levels between responders and non-responders. As an FcRn antagonist, EFG exerts its therapeutic effect by accelerating IgG clearance. In patients with significant immune activation and active autoantibody production, rapid reduction of antibody levels is more likely to yield clinical improvement. Our study suggests that NK cells and IL-12 hold promise as potential biomarkers for identifying patients more likely to benefit from EFG treatment. It also underscores the importance of considering the exhaustion state of immune cells in autoimmune disease management.
Our study has several limitations. First, the small sample size limits statistical power and generalizability. Evaluating multiple algorithms and variable combinations in a small dataset also risks model selection bias and overestimated performance. To reduce this bias, we prioritized model parsimony and clinical interpretability rather than pure statistical optimization. Despite leave-one-out cross-validation, bootstrap resampling, and sensitivity analyses confirming result robustness, our findings remain exploratory and hypothesis-generating. Notably, our feature selection was constrained by the predefined panel of assessed immunological parameters, and other potential biological predictors likely exist. Second, the retrospective design may introduce selection bias, and heterogeneous laboratory methods (eg, AChR antibody assays) could compromise biomarker consistency Third, the model lacks external validation and requires testing in independent prospective multicenter cohorts before clinical application. Fourth, efficacy was only evaluated for short-term response; the model’s ability to predict long-term outcomes remains unproven. Additionally, our cohort mainly included late-onset MG patients, so performance in early-onset patients needs further verification. Finally, we only assessed total NK cell counts without subset analysis, which may overlook distinct functional roles of NK cell subsets.
Conclusion
High IL-12/low NK levels serve as potential biomarkers for predicting EFG response in AChR+ gMG patients. The dual-biomarker model shows good discriminative ability and clinical utility. The derived risk score enables individualized pretreatment assessment. While other unmeasured predictors likely exist, this immunophenotype helps identify optimal candidates for Efgartigimod and provides new insights into the immunological mechanisms of FcRn‑targeted therapy.
Data Sharing Statement
The data that support the findings of this study are available from the corresponding author (Prof. Yangtai Guan and Dr. Kan Wang) upon reasonable request.
Ethics Statement
This study was approved by the Ethics Committee of Punan Branch of Renji Hospital, Shanghai Jiao Tong University School of Medicine (Approval No. KS2025-022). The study protocol was registered in the Chinese Clinical Trial Registry (registration number: ChiCTR2500104662). All participants provided written informed consent prior to enrollment. The study was conducted in accordance with the principles of the Declaration of Helsinki.
Acknowledgment
The authors thank the study participants.
Author Contributions
All authors made a significant contribution to the work reported, whether that is in the conception, study design, execution, acquisition of data, analysis and interpretation, or in all these areas; took part in drafting, revising or critically reviewing the article; gave final approval of the version to be published; have agreed on the journal to which the article has been submitted; and agree to be accountable for all aspects of the work.
Funding
This study was funded by National Natural Science Foundation of China (82301527), Young Medical Talents Training Program of Shanghai Pudong New Area Health Commission (PWRq2025-23), Interdisciplinary Program of Shanghai Jiao Tong University (YG2023LC04), the Municipal Commission of Health and Family Planning Foundation of Shanghai Pudong New Area (PW2022E-01), New Quality Clinical Specialty Program of High-end Medical Disciplinary Construction in Shanghai Pudong New Area (2024-PWXZ-16), the Investigator-initiated Trial Program of Shanghai Pudong New Area Health Commission (the Medical and Industrial Integration Program, 2025-PWYC-06).
Disclosure
The authors report no conflicts of interest in this work.
References
1. Gilhus NE, Tzartos S, Evoli A, et al. Myasthenia gravis. Nat Rev Dis Primers. 2019;5(1):30. doi:10.1038/s41572-019-0079-y
2. Elsner RA, Smita S, Shlomchik MJ. IL-12 induces a B cell-intrinsic IL-12/IFNγ feed-forward loop promoting extrafollicular B cell responses. Nat Immunol. 2024;25(7):1283–16. doi:10.1038/s41590-024-01858-1
3. Peng SL, Szabo SJ, Glimcher LH. T-bet regulates IgG class switching and pathogenic autoantibody production. Proc Natl Acad Sci U S A. 2002;99(8):5545–5550. doi:10.1073/pnas.082114899
4. Yang CL, Zhang P, Liu RT, et al. CXCR5-negative natural killer cells ameliorate experimental autoimmune myasthenia gravis by suppressing follicular helper T cells. J Neuroinflammation. 2019;16(1):282. doi:10.1186/s12974-019-1687-x
5. Zhang Q, Han X, Bi Z, et al. Exhausted signature and regulatory network of NK cells in myasthenia gravis. Front Immunol. 2024;15:1397916. doi:10.3389/fimmu.2024.1397916
6. Gilhus NE, Verschuuren JJ. Myasthenia gravis: subgroup classification and therapeutic strategies. Lancet Neurol. 2015;14(10):1023–1036. doi:10.1016/S1474-4422(15)00145-3
7. Crisafulli S, Boccanegra B, Carollo M, et al. Myasthenia gravis treatment: from old drugs to innovative therapies with a glimpse into the future. CNS Drugs. 2024;38(1):15–32. doi:10.1007/s40263-023-01059-8
8. Farmakidis C, Pasnoor M, Dimachkie MM, et al. Treatment of myasthenia gravis. Neurol Clin. 2018;36(2):311–337. doi:10.1016/j.ncl.2018.01.011
9. Dau PC, Lindstrom JM, Cassel CK, et al. Plasmapheresis and immunosuppressive drug therapy in myasthenia gravis. N Engl J Med. 1977;297(21):1134–1140. doi:10.1056/NEJM197711242972102
10. Shi D, Wu Y, Liang X, et al. FcRn inhibition with efgartigimod ameliorates muscle weakness and modulates dendritic cell subsets in an experimental autoimmune myasthenia gravis mouse model. Int Immunopharmacol. 2025;162:115153. doi:10.1016/j.intimp.2025.115153
11. Tarasco MC, Rinaldi E, Frangiamore R, et al. Unknown immunoregulatory effects of FcRn inhibition by efgartigimod in myasthenia gravis: a new mechanism of action beyond IgG reduction. Neurol Neuroimmunol Neuroinflamm. 2025;12(5):e200455. doi:10.1212/NXI.0000000000200455
12. Howard JF, Bril V, Vu T, et al. Safety, efficacy, and tolerability of efgartigimod in patients with generalised myasthenia gravis (ADAPT): a multicentre, randomised, placebo-controlled, Phase 3 trial. Lancet Neurol. 2021;20(7):526–536. doi:10.1016/S1474-4422(21)00159-9
13. Moniz Dionísio J, Ambrose P, Burke G, et al. Efgartigimod efficacy and safety in refractory myasthenia gravis: UK’s first real-world experience. J Neurol Neurosurg Psychiatry. 2025;96(4):322–328. doi:10.1136/jnnp-2024-334086
14. Wang K, Xin H, Zhang M, et al. Double-filtration plasmapheresis versus efgartigimod for generalized myasthenia gravis: severity-stratified benefits in a prospective observational multicenter study. CNS Neurosci Ther. 2026;32(3):e70838. doi:10.1002/cns.70838
15. Jin L, Zou Z, Wang Q, et al. Patterns and predictors of therapeutic response to efgartigimod in acetylcholine receptor-antibody generalized myasthenia gravis subtypes. Ther Adv Neurol Disord. 2025;18:17562864251319656. doi:10.1177/17562864251319656
16. Sgarzi M, Paone P, Camera G, et al. Real world study in Italian public hospital with efgartigimod in patients affected by generalized myasthenia gravis: influence of clinical and serological factors. Front Neurol. 2025;16:1555068. doi:10.3389/fneur.2025.1555068
17. Handa H, Uzawa A, Yasuda M, et al. Association of baseline acetylcholine receptor antibody levels with efgartigimod treatment efficacy for patients with myasthenia gravis. J Neurol Sci. 2025;479:123745. doi:10.1016/j.jns.2025.123745
18. Aguirre F, Manin A, Fernandez VC, et al. C3, C5a and anti-acetylcholine receptor antibody as severity biomarkers in myasthenia gravis. Ther Adv Neurol Disord. 2020;13:1756286420935697. doi:10.1177/1756286420935697
19. Huang X, Xu M, Wang Y, et al. The systemic inflammation markers as possible indices for predicting respiratory failure and outcome in patients with myasthenia gravis. Ann Clin Transl Neurol. 2023;10(1):98–110. doi:10.1002/acn3.51706
20. Ward ES, Gelinas D, Dreesen E, et al. Clinical significance of serum albumin and implications of FcRn inhibitor treatment in IgG-mediated autoimmune disorders. Front Immunol. 2022;13:892534. doi:10.3389/fimmu.2022.892534
21. Wen Q, Zhang S, Wang Y, et al. Platelet activation plays a pro-inflammatory role in myasthenia gravis. Nat Commun. 2025;16(1):8779. doi:10.1038/s41467-025-63750-2
22. Collins GS, Moons KGM, Dhiman P, et al. TRIPOD+AI statement: updated guidance for reporting clinical prediction models that use regression or machine learning methods. BMJ. 2024;385:q902. doi:10.1136/bmj-2023-078378
23. Efthimiou O, Seo M, Chalkou K, et al. Developing clinical prediction models: a step-by-step guide. BMJ. 2024;386:e078276. doi:10.1136/bmj-2023-078276
24. Omar ED, Mat H, Abd Karim AZ, et al. Comparative analysis of logistic regression, gradient boosted trees, SVM, and random forest algorithms for prediction of acute kidney injury requiring dialysis after cardiac surgery. Int J Nephrol Renovasc Dis. 2024;17:197–204. doi:10.2147/IJNRD.S461028
25. Zhao X, Wang Y, Li J, et al. A machine-learning-derived online prediction model for depression risk in COPD patients: a retrospective cohort study from CHARLS. J Affect Disord. 2025;377:284–293. doi:10.1016/j.jad.2025.02.063
26. Liu L, Liu W, Jia Z, et al. Application of machine learning algorithms to predict lymph node metastasis in gastric neuroendocrine neoplasms. Heliyon. 2023;9(10):e20928. doi:10.1016/j.heliyon.2023.e20928
27. Niu Z, Wang J, Ren J, et al. Efgartigimod non-responders after the first treatment cycle in generalized myasthenia gravis: a retrospective analysis of predictive factors. Front Neurol. 2025;16:1715486. doi:10.3389/fneur.2025.1715486
28. Wang S, Zhu M, Dong J, et al. Perioperative safety and efficacy of efgartigimod for thymoma-associated myasthenia gravis: a prospective, multicenter, Phase II clinical trial. J Thorac Oncol. 2025;20(8):1120–1130. doi:10.1016/j.jtho.2025.04.014
29. Ren L, Wei L, Jiang S, et al. Efgartigimod for patients with thymoma associated generalized myasthenia gravis during the perioperative period: a four-case report. Front Immunol. 2025;16:1627584. doi:10.3389/fimmu.2025.1627584
30. Zhang Q, Lin J, Yang M, et al. Therapeutic potential of natural killer cells in neuroimmunological diseases. Biomed Pharmacother. 2024;173:116371. doi:10.1016/j.biopha.2024.116371
31. Fuss IJ, Becker C, Yang Z, et al. Both IL-12p70 and IL-23 are synthesized during active crohn’s disease and are down-regulated by treatment with anti-IL-12 p40 monoclonal antibody. Inflamm Bowel Dis. 2006;12(1):9–15. doi:10.1097/01.MIB.0000194183.92671.b6
32. Moiola L, Galbiati F, Martino G, et al. IL-12 is involved in the induction of experimental autoimmune myasthenia gravis, an antibody-mediated disease. Eur J Immunol. 1998;28(8):2487–2497. doi:10.1002/(SICI)1521-4141(199808)28:08<2487::AID-IMMU2487>3.0.CO;2-Y
33. Ferlazzo G, Pack M, Thomas D, et al. Distinct roles of IL-12 and IL-15 in human natural killer cell activation by dendritic cells from secondary lymphoid organs. Proc Natl Acad Sci U S A. 2004;101(47):16606–16611. doi:10.1073/pnas.0407522101
34. Chen S, Zhu H, Jounaidi Y. Comprehensive snapshots of natural killer cells functions, signaling, molecular mechanisms and clinical utilization. Signal Transduct Target Ther. 2024;9(1):302. doi:10.1038/s41392-024-02005-w
35. Frutoso M, Mortier E. NK cell hyporesponsiveness: more is not always better. Int J Mol Sci. 2019;20(18):4514. doi:10.3390/ijms20184514
36. Terrén I, Sandá V, Amarilla-Irusta A, et al. IL-12/15/18-induced cell death and mitochondrial dynamics of human NK cells. Front Immunol. 2023;14:1211839. doi:10.3389/fimmu.2023.1211839
37. Leong JW, Chase JM, Romee R, et al. Preactivation with IL-12, IL-15, and IL-18 induces CD25 and a functional high-affinity IL-2 receptor on human cytokine-induced memory-like natural killer cells. Biol Blood Marrow Transplant. 2014;20(4):463–473. doi:10.1016/j.bbmt.2014.01.006
 © 2026 The Author(s). This work is published and licensed by Dove Medical Press Limited. The
full terms of this license are available at https://www.dovepress.com/terms
and incorporate the Creative Commons Attribution
- Non Commercial (unported, 4.0) License.
By accessing the work you hereby accept the Terms. Non-commercial uses of the work are permitted
without any further permission from Dove Medical Press Limited, provided the work is properly
attributed. For permission for commercial use of this work, please see paragraphs 4.2 and 5 of our Terms.
© 2026 The Author(s). This work is published and licensed by Dove Medical Press Limited. The
full terms of this license are available at https://www.dovepress.com/terms
and incorporate the Creative Commons Attribution
- Non Commercial (unported, 4.0) License.
By accessing the work you hereby accept the Terms. Non-commercial uses of the work are permitted
without any further permission from Dove Medical Press Limited, provided the work is properly
attributed. For permission for commercial use of this work, please see paragraphs 4.2 and 5 of our Terms.