Back to Journals » Risk Management and Healthcare Policy » Volume 16
An Exploratory Analysis of the Association Between Hospital Labor Costs and the Quality of Care
Authors Beauvais B ![]() , Kruse CS
, Kruse CS ![]() , Ramamonjiarivelo Z, Pradhan R
, Ramamonjiarivelo Z, Pradhan R ![]() , Sen K
, Sen K ![]() , Fulton L
, Fulton L
Received 27 February 2023
Accepted for publication 27 May 2023
Published 15 June 2023 Volume 2023:16 Pages 1075—1091
DOI https://doi.org/10.2147/RMHP.S410296
Checked for plagiarism Yes
Review by Single anonymous peer review
Peer reviewer comments 2
Editor who approved publication: Professor Mecit Can Emre Simsekler
Brad Beauvais,1 Clemens Scott Kruse,1 Zo Ramamonjiarivelo,1 Rohit Pradhan,1 Keya Sen,1 Lawrence Fulton2
1School of Health Administration, Texas State University, San Marcos, TX, USA; 2Woods College of Advancing Studies, Boston College, Chestnut Hill, MA, USA
Correspondence: Brad Beauvais, School of Health Administration, Texas State University, San Marcos, TX, USA, Email [email protected]
Introduction: The competent healing touch of a caregiver is a critical component to the care patients receive. The more skilled the provider, the higher the likelihood outcomes will be delivered in a safe and effective manner. Unfortunately, in recent years, hospitals in the United States have faced immense financial pressures that are threatening their economic sustainability and patients’ access to care in the future. Through the recent COVID-19 pandemic, the cost of delivering healthcare has continued to escalate, while the demand for patient care has exceeded many hospitals’ capacity. Most troubling is the impact that the pandemic has had on the healthcare workforce, which has resulted in many hospitals struggling to fill vacancies at ever-increasing cost – all while under immense pressure to deliver quality patient care. What remains uncertain is whether the increase in labor costs has been matched with a commensurate rise in the quality of care or if quality has deteriorated as the labor force mix has changed to include more contract and temporary staff. Thus, in the enclosed study, we sought to determine what association, if any, exists between hospitals’ cost of labor and the quality of care delivered.
Methods and Models: Drawing from a representative national sample of nearly 3214 short-term acute care hospitals’ common quality measures from the year 2021, we examined the labor cost–quality relationship via multivariate linear and logistic regression and found there is a persistent negative association across all quality outcome variables studied.
Discussion: These findings lead us to believe simply paying more for hospital labor does not, by itself, ensure a positive patient outcome. We contend cautious use of temporary staff, measured adoption of short-term financial incentives, and robust staff development all should be considered as features of future workforce planning.
Keywords: hospital, labor costs, quality
Introduction
United States hospitals and health systems are facing unprecedented financial challenges. After incurring an expected $54 billion in net income loss throughout the 2021 operational year, US hospitals are facing even more financial headwinds in 2022. Despite the distribution of $176 billion in federal Coronavirus Aid, Relief, and Economic Security (CARES) Act funding from 2020, hospitals are witnessing depressed revenues due to a decline in higher margin outpatient visits relative to the pre-pandemic era and significantly increased operational expenses attributed to price inflation on drugs, purchased services, equipment, and supplies.1 This has led to serious financial concerns for many hospitals. Prior to 2020, approximately one-quarter of hospitals in the United States reported negative operating margins, but by the beginning of 2021 and after nearly a full year combatting COVID-19, more than one-half of hospitals reported negative margins.2
The single most significant hospital expense is the cost of the healthcare workforce.3 Employee wages and benefits constitute the largest percentage of costs for acute care hospitals and clinical labor costs rose by almost 40% between 2019 and early 2022 alone.2 This phenomenon has been exacerbated over the past 2 years by the pressures of the COVID-19 pandemic. A recent analysis indicates hospital staffing shortages encumbered hospitals by an additional $24 billion in 2021 and are expected to rise to an added $86 billion by the end of 2022.4 The reason for this dramatic increase is attributed to the use of overtime and agency staff to fill critically needed positions. These two options have long been noted as the most expensive labor choices for hospitals – typically adding 50% or more to a typical employee’s hourly rate.5 However, with the demands of the pandemic, hospital leaders had little choice but to absorb additional employed labor costs and a meteoric rise in year-over-year contract labor expenses.
The reasons behind this dramatic elevation in labor costs are numerous and chronic. The healthcare industry has known for decades that a shortage was steadily growing due to an aging healthcare workforce, the educational barriers to entry to the field, and the often-strenuous working conditions. As a result, the American Hospital Association (AHA) notes that hospitals are contending with ongoing shortages of pharmacists, registered nurses, medical technicians, and numerous other clinical roles, prompting many healthcare leaders to indicate staff shortages are the most significant issue confronting US hospitals.3,5 The combined stressors of working more hours while under persistent danger of infection are pushing many clinical staff to consider leaving the industry.5 Current data reflect that turnover is reaching record highs in critical areas like the emergency department, intensive care, and nursing. Since the start of the pandemic, the annual rate of staff turnover in these departments rose from 18% to 30% – meaning one-third of all employees in these departments are turning over each year.6
All the above facts led us to begin to question how the quality of care delivered in the hospital setting is influenced when so much more of an organization’s resources are dedicated to staffing costs. Although others have studied the association between health organization financial performance and quality of care, what is less well understood is the impact of increased labor costs and quality outcomes. There are two potential logical associations. On one hand, there is the contention that if a hospital is paying for higher quality staff with more advanced skills and competencies relative to its competitors, there might be a positive association with healthcare outcomes. However, if the added costs incurred by the hospital are primarily dedicated to short-term labor support as contract staff and short-term employees are asked to fill the gap to ensure continuity of patient care, the risk of errors, miscommunication, and erosion of highly reliable practices are all in question. With this in mind, there may be a negative association between increased staffing costs and quality of care. If this is the case, hospital leaders may, in fact, be exposing patients to increased risk of harm in their efforts to keep hospitals open “by any means necessary” with temporary or short-term staff.
Literature
Quality
Quality as a construct can be difficult to define given no two patients, “payors”, or “providers” perspectives on the topic are exactly alike. Even so, the Institute of Medicine (IOM) has defined quality as “the degree to which health services for individuals and populations increase the likelihood of desired health outcomes and are consistent with current professional knowledge”.7 McGlynn points to the IOM definition and suggests that quality performance occurs on a continuum, theoretically ranging from unacceptable to excellent and quality may be evaluated from the perspective of individuals or populations.8 Consistent with this notion, Avedis Donabedian conceptualized that quality in healthcare is achieved in a series of stages: structure, process, and outcome.9 In his view, “structure” describes the context in which care is delivered, including hospital buildings, staff, financing, and equipment; “process” encompasses the interactions among patients and providers in the healthcare delivery exchange; and “outcomes” refer to the effects of healthcare on the health status of patients and populations. Donabedian posits that positive health outcomes depend on the quality of healthcare process, and quality of healthcare process depends on the quality of healthcare structure.9 Although the Donabedian model has been a salient feature in the healthcare management literature for well over 50 years, much remains unknown regarding the evolving relationships among the model’s major components and how to positively influence each stage of the health delivery continuum – evidenced by the persistent medical error rates that plague the industry.10
Given the variety of stakeholder viewpoints, numerous measures and methods have been developed in recent years to evaluate quality in the healthcare setting. The most direct and influential parties involved are the public and private payers, which increasingly mandate measurement and reporting as part of pay-for-performance programs. The most dominant of these payers is the Centers of Medicare and Medicaid Services (CMS), which requires the public reporting of dozens of both inpatient quality reporting (IQR) and outpatient quality reporting (OQR) measures that encompass the clinical processes of care, infection, structural issues, safety, mortality, coordination of care, payment, and the patient experience of care.11,12 Collection of these data allows patients and families the opportunity to review a specific hospital’s quality performance vis-a-vis its peers. The Hospital Compare overall rating summarizes a variety of measures across five areas of quality into a single star rating for each hospital. These areas include measures pertaining to (1) mortality, (2) safety, (3) readmission, (4) patient experience, and (5) timely and effective care. The Hospital Compare Overall Rating, generated from the Summary Score, is calculated using measures reported to CMS through the Hospital Inpatient Quality Reporting (IQR) Program, Hospital Outpatient Quality Reporting (OQR) Program, Hospital Readmission Reduction Program (HRRP), Hospital-Acquired Condition (HAC) Reduction Program, and Hospital Value-Based Purchasing (VBP) Program.13
An additional publicly facing quality reporting system is the HCAHPS (Hospital Consumer Assessment of Healthcare Providers and Systems) summary star rating. The Centers for Medicare & Medicaid Services (CMS) and the Agency for Healthcare Research and Quality (AHRQ) developed the Hospital Consumer Assessment of Healthcare Providers and Systems (HCAHPS) Survey to provide standardized data collection that measures patients’ assessment of received hospital care. The HCAHPS Survey is administered to a random sample of adult patients throughout the year between 48 hours and 6 weeks after their hospital discharge. Hospital-level results are publicly reported by CMS on the Hospital Compare website 4 times per year.14
Other quality measures now include those developed as an outcome of the passage of the Patient Protection and Affordable Care Act (PPACA) in 2010.15 One of these is the set of Value-Based Purchasing (VBP) measures that are used to adjust a hospital’s payments based on its performance in four quality measurement domains to comprise its Total Performance Score (TPS). The program rewards acute care hospitals with incentive payments based on the quality of care they provide, rather than just the quantity of services they provide. Weighting, domains, and the measures vary from year to year. In recent years, the four equally weighted domains include (1) clinical outcomes, (2) person and community engagement, (3) safety, and (4) efficiency and cost reduction.16
Labor Compensation
The study of labor as a component cost of healthcare delivery is a well-studied aspect of the health management literature primarily due to the well-recognized demand for additional healthcare staffing and services in the United States as the population ages. Although there is a need for all types of healthcare providers, nurses have been the primary focus for many past researchers. The logic behind this centers on reports such as those issued by the US Bureau of Labor Statistics which indicate more than 200,000 additional nurses are needed each year from 2021 to 2031 just to fill the vacancies resulting from workers lost to different occupations or the decision to depart the labor force.17,18 These departures have occurred in the past for a few reasons, including job-related stress, burnout, job dissatisfaction, managerial style and supervisory problems, and an aging of the healthcare workforce.19,20 More recently, however, the closure of services and furloughing of staff through the COVID-19 pandemic has exacerbated the issue, as many departed the industry for other employment opportunities and never returned.21 More important for the scope of our research, nurse labor costs make up over 30% of all hospital expenditures.22 Unfortunately for hospital leaders, nurses are not the only type of care providers who are in short supply. Similar shortages are reported in the primary care and specialty care physician workforce, physical therapists, behavioral health, and many other roles.23,24
Although traditional economic theory predicts that an elevated local market wage rate should foster growth in the supply of nurses entering the labor market, prior authors have shown that real wages earned by the nursing profession have not appreciably increased above the median wage growth rate across nearly two decades.25,26 This trend dramatically changed during the COVID-19 pandemic and created significant financial strain on hospital operating budgets as nursing shortages worsened and patient demand skyrocketed. By the end of 2021, hospital labor expenses per patient were 19.1% higher than pre-pandemic levels and increased to 57% higher per patient at the height of the omicron surge in January 2022.3
Labor Compensation and Quality of Care
Although the body of evidence supporting specific staffing types (eg, nursing staff mix, physician types, etc.) and their connection with the healthcare outcomes has been robustly studied, the specific association between labor costs and quality of care has not been well documented in the healthcare literature. This is surprising because labor has traditionally been an important issue for hospitals and health systems given labor compensation is the single most significant contributor to the cost structure of hospitals and health systems across the country.
Drawing from the previously mentioned work of Donabedian and his conceptualization of how quality is achieved in healthcare, notably via a structure, process, and outcome continuum, we logically believe that with increased expenditure on salaries, wages and benefits, there should be commensurate improvement in the process of care delivery, which should result in an improvement of the organization’s quality outcomes.9 However, the few prior studies available indicate there is no connection between increased healthcare staffing costs and the quality of care provided.27,28 There are others that question whether higher cost contract nursing and incentives such as increased pay, bonuses, and other extrinsic motivators are supportive of higher quality outcomes, or may, in fact, decrease performance.29–31
Another theoretical basis for our work can be drawn from the “Iron Triangle” model of healthcare first proposed by William Kissick in his 1994 book Medicine’s Dilemmas: Infinite Needs Versus Finite Resources.32 His theoretical framework conceptually explains the behavior of three aspects of healthcare: cost, quality, and access. Kissick’s theory indicates these three components are three different legs of the same “three-legged stool” of healthcare delivery and are competing aspects of the healthcare delivery process where an advantage in one leg results in a disadvantage in at least one other leg. Thus, his theory is characterized as being rigid like iron. He asserts it is difficult, if not impossible, to simultaneously achieve a low-cost, high-quality, unrestricted access healthcare system. This premise was subsequently confirmed in a recent structural equation modeling study by Beauvais, Kruse, Fulton, Brooks and Mileski.33 In their work, the authors empirically tested the cost–quality–access tradeoff and found that Kissick’s theory – as originally conceptualized – still holds true. Thus, this leads us to believe that the labor cost–quality tradeoff in the current study is likely to be negatively associated. We perceive that as more is spent on staffing costs, expenditure on other aspects of patient care may be negatively impacted, leading to an overall negative impact on quality.
Lastly, an additional theoretically based association between labor compensation and performance in healthcare can be found in the agency theory literature. Agency theory explains the relationship between the principal (the owner of an organization) and the agent (the individual(s) that the principal hires to manage the organization on behalf of the principal). An agency problem occurs when the principal and agent have conflicting agendas and goals, which may lead to poor organizational performance. However, monitoring the actions of the agent can be challenging to the principal. Therefore, to ensure that the agent embraces the principal’s agenda and pursues the principal’s goals, the principal provides some incentives to the agent.34 This leads us to believe healthcare leaders will continually attempt to attract, retain, and motivate employees (agents) to achieve leaders’ desired outcomes through incentives. Logically, if management goals and staff performance are aligned – often via financial incentives – higher quality outcomes can be achieved.34–36 However, this may not hold true for contract workers – an increasing proportion of hospital staff – who may have no long-term interest in their position, and therefore, may be less willing to accept the interests of the principal – The hospital in this instance.
Research Question and Significance of the Current Study
This study is significant because, to our knowledge, this is the first study that directly and empirically answers the research question “what is the relationship between hosptial labor costs and quality of care”? Given the amount of change and disruption that has occurred in the United States healthcare industry in recent years and the tradeoffs mentioned in the Kissick and Donabedian models, we hypothesize that healthcare labor costs and quality outcomes are negatively associated.
Methods
Data and Sample
Our primary data source is Definitive Healthcare, which provides comprehensive data extracted from publicly available information, including from federal, state, and other regulatory agencies, in addition to licensed data from other companies, web research on publicly available information through technology as well as electronic and phone surveys conducted by their research team based in the United States.37 Our final dataset consists of all active, short-term acute care hospitals in the United States with an active Medicare Provider Number (MPN). Veterans Administration, Military Healthcare System, and Indian Health System hospitals were excluded from the analysis as the outcome measures used in this study are not available for federal government operated hospitals. This limitation reduced our original dataset to 3214 unique hospital observations and the dataset was reduced further based on the number of institutions reporting data for each dependent variable. The total number of observations available for each measure is detailed in the section below.
Dependent Variables
Given the variety of perspectives and robust number of quality measures available, three aggregate dependent variables were used for this study. The first variable was the 2021 value-based purchasing Total Performance Score. Value-based purchasing is a CMS program that adjusts a hospital’s payments based on its performance in four weighted quality measurement domains to comprise its Total Performance Score. The domains include (1) clinical outcomes, (2) patient and community engagement, (3) safety, and (4) efficiency and cost reduction.16 A total of 2471 observations for the Hospital Value-Based Purchasing Total Performance Score from the year 2021 were available in the final analyzed data set.
The second dependent variable included in the study is the Hospital Compare overall rating (HCR). The Hospital Compare rating provides consumer-focused information on hospitals’ performance on numerous dimensions of quality, such as treating heart attacks and pneumonia, readmission rates, and safety of care.13 For this study, 2592 observations were collected from the year 2021 for analysis.
The third dependent variable includes the HCAHPS (Hospital Consumer Assessment of Healthcare Providers and Systems) Summary Star Rating (SSR). The HCAHPS survey asks discharged patients numerous questions about their experience with a hospital stay including questions pertaining to communication with nurses and doctors, the responsiveness of hospital staff, the cleanliness and quietness of the hospital environment, communication about medicines, discharge information, overall rating of hospital, and would they recommend the hospital. The patient survey summary star rating is the average of all the Star Ratings of the HCAHPS measures.14 Our final data set for analysis included 2624 observations from the year 2021 for the HCAHPS summary star rating.
Independent Variable
The independent variable of interest in this study is the “labor compensation ratio” (LCR) or the percent of net patient revenue consumed by labor expense. We operationalized this variable by extracting measures from the Medicare Cost Report (MCR) as shown in Equation I below:

The potential for reverse causality prompted us to utilize older (2019) labor compensation ratio data to allow for the impact of hiring practices to be fully realized within the quality outcomes and score reports (data year 2021). The practice of replacing an explanatory variable with its lagged value to counteract endogeneity is prevalent across a wide variety of disciplines in economics and finance.38–41
Control Variables
We also included several organizational-level characteristics to control for confounding variance, including the bed utilization rate, for-profit ownership status (dichotomous), government operated (dichotomous), average length of stay (ALOS), the market concentration index (MCI), rural/urban (dichotomous), percent Medicare days, percent Medicaid days, the case mix index (CMI), and the complications or major complications (CC & MCC) rate. We further controlled for nuances in labor costs attributable to local labor market variations by pooling facilities by AHA regions. Region 1 was determined to be the referent group in our analysis, consisting of the states of Connecticut, Maine, Massachusetts, New Hampshire, Rhode Island, and Vermont. All control variables were extracted from the year 2019.
Missing Data
Independent variables were largely complete (1% missing total). Medians were imputed for the missing ordinal, interval, and ratio values, while modes were imputed for the missing nominal values. The only remaining missing data belonged to the dependent variables. Each dependent variable was analyzed separately, and missing cases of the dependent variable were simply dropped. The final dataset was comprised of 2471 Total Performance Score, 2592 Hospital Compare rating, and 2624 HCAHPS Star rating observations, respectively.
Analysis and Results
We conducted complete missing data analysis and provided descriptive statistics for the original data. We then re-coded two of the dependent variables (HCR and HSR) as dichotomous, and transformed some of the independent variables to be more analytically tractable using Box–Cox transformations.42
Descriptive Statistics, Re-Coding, and Plots
Table 1 reflects the complete list of variables and descriptive statistics. For the dependent variables, the average facility score for TPS was 33.61 (sd=11.29). The median HCR and HSR ratings were both 3. The “typical” facility saw a mean LCR of 0.44 (sd=0.14) and a mean bed utilization of 50% (sd=20%).
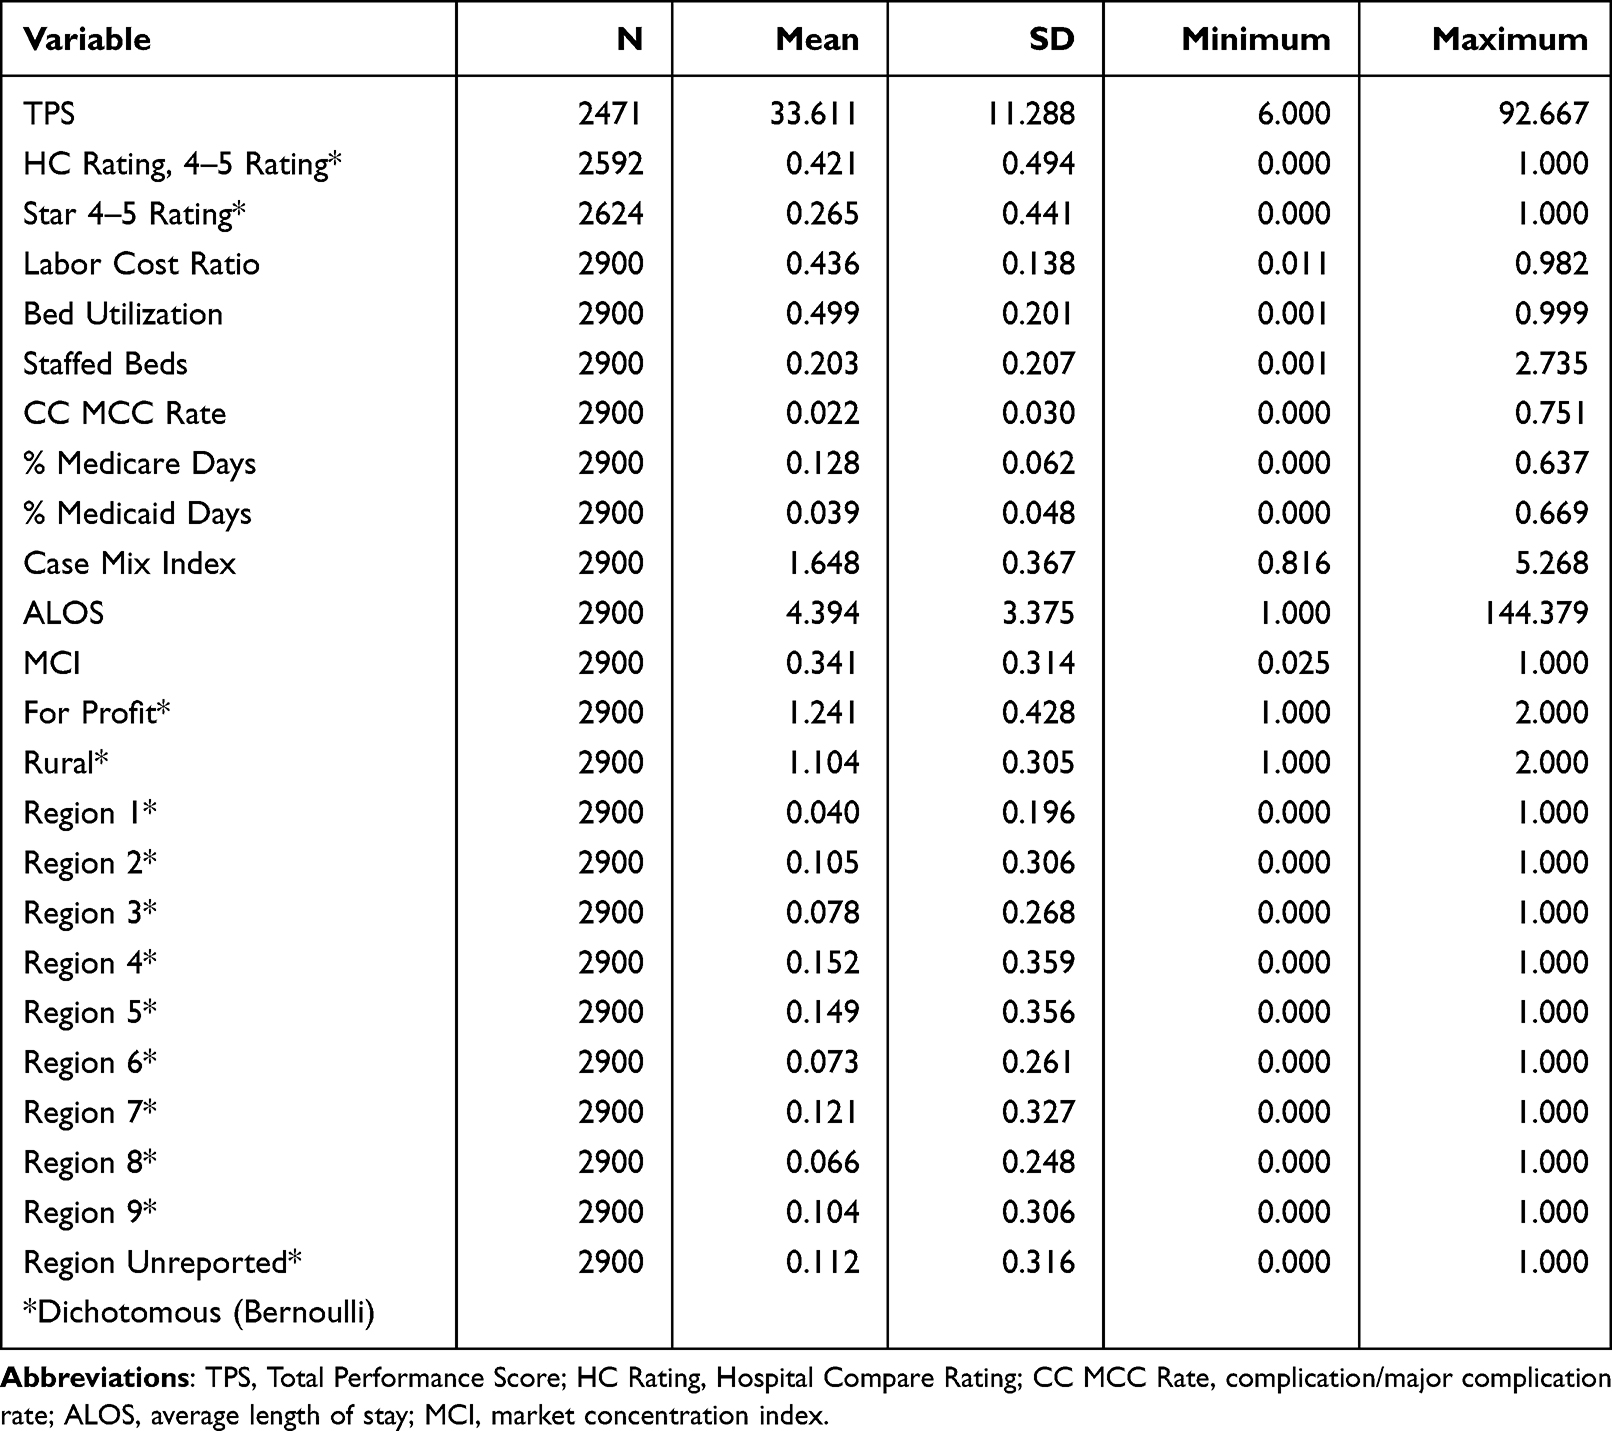 |
Table 1 Descriptive Statistics |
The HCR- and HSR-dependent variables were both collapsed into dichotomous variables with 0 representing scores/stars less than or equal to three. This recode partially balanced the classes and was an indicator of average to below average performance versus above average performance. After recoding the HCR variable, there were 1501 observations (57.9%) of facilities with HCR rating 1–3 and 1091 with rating 4–5 (42.1%) for a total of 2592 observations. For the HSR variable, there were 1929 with 1–3 stars (73.5%) and 695 with 4–5 stars (26.5%) for a total of 2624 observations. Figure 1 provides the distributions of the dependent variables.
 |
Figure 1 Dependent variable distributions. |
For the independent and control variables, the mean LCR was 44% (sd=0.14). The average facility had a bed utilization of 49.9% (sd=20.1%) and 203 staffed beds (sd=207). The mean CC MCC rate was 2.2% (sd=3.0%). The average percent of Medicare days for facilities was 12.8% (sd=6.2%), while the average percent of Medicaid days was 3.9% (sd=4.8%). The average organization had a CMI of 1.648 (sd=0.367), an ALOS of 4.394 (sd=3.375), and an MCI of 0.341 (sd=0.314). Figure 2 provides the distributions of the categorical independent variables, while Figure 3 shows the bivariate pairs plots for the quantitative independent variables. The pairs plot provides the histograms on the diagonal, the correlations and the smoothed curve fit estimates on the upper triangle, and the bivariate boxplots on the lower diagonal. The maximum absolute value of the correlation (bed utilization and staffed beds) was 0.533.
 |
Figure 2 Control variable distributions. Abbreviation: FP, for profit. |
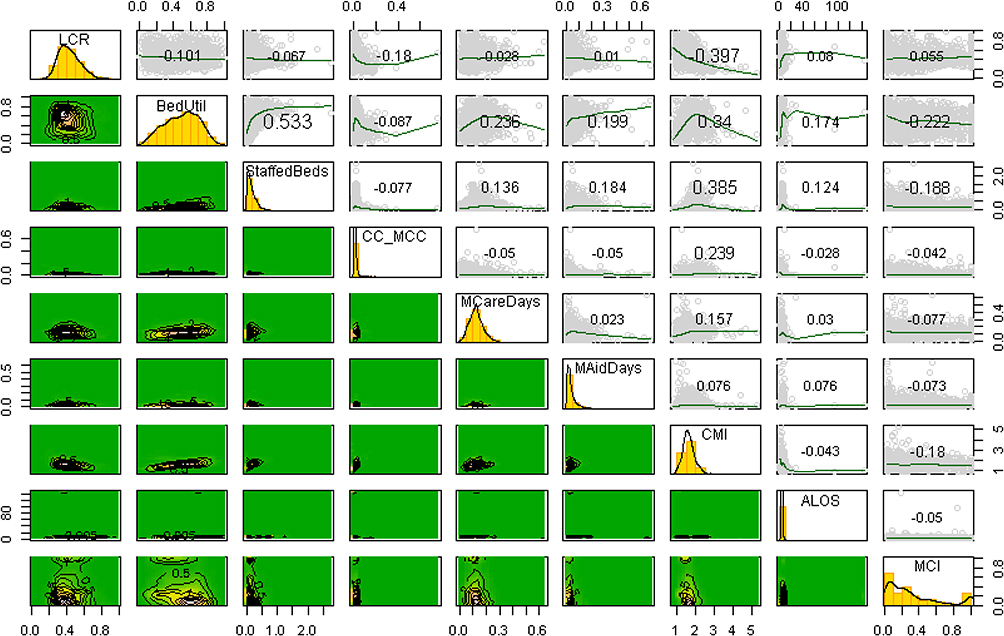 |
Figure 3 Quantitative independent/control variable distributions. Abbreviations: LCR, labor compensation ratio; BedUtil, Bed Utilization; StaffedBeds, Staffed Beds; CC_MCC, complication/major complication rate; MCareDays, Medicare days %; MAidDays, Medicaid days %; CMI, case mix index; ALOS, average length of stay; MCI, market concentration index. |
About 75.9% of the facilities were not-for-profit or government owned, while 90% were in urban settings. Region 4 was the modal region (15.2%). Chi-square tests of the two categorical dependent variables, HCR and separately HSR, versus FP suggested distributional differences for HCR only, 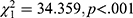 Chi-square tests of HCR and HSR versus the Rural control variable suggested distributional distributions for HSR only,
 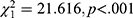 . For Region versus HCR and HSR, there were distributional distributions found for both variables,
  and
and  , respectively.
Training and Test Set
After descriptive analysis and to investigate the external validity of our model estimates, we split the data into training and test sets (80% and 20%, respectively.) Doing so allows estimation of the model performance on unseen data. The training and test split occurred prior to any transformations of the predictor variables, so that statistics estimated from the training set (if any) would not be leaked to the test set.
Transformations
The only quantitative dependent variable, TPS, was evaluated for normality based on the training data. Box–Cox methods suggested a power transformation of 0.264. Raising the dependent variable to the 1/4 power, however, results in a loss of interpretability. Although a logarithmic transformation was explored, TPS was left untransformed for explainability without a general loss of models’ performances.
The LCR variable appeared to be slightly right-skewed. The recommended power transformation based on the training set (Box–Cox method) was 0.369. Since interpretation of a 1/3 power transformation is not necessarily intuitive and transformation of predictors may improve model build but are not required to meet model assumptions, we left the variable untransformed.
The Bed Utilization variable appeared Gaussian, and Box–Cox methods suggested a transformation of 0.986 (nearly 1.0). An additional likelihood ratio test (LRT) for Ho: user selected transformation (power = 1.0) versus Ha: Box–Cox generated transformation (power = 0.986) failed to reject the null, LRT1=0.121, p=0.728.
The staffed beds variable appeared to be lognormal, although the optimal transformation calculated on the training set and based on Box–Cox transformation was 0.12. For interpretability, an imperfect logarithmic transformation (LRT1=44.556, p<0.001),which avoids using a power function generated only from the training set was applied to both the training and test set.
The CC MCC variable was largely left-skewed. Although the optimal normality transformation for the training set was 0.304, by Box–Cox methods, an imperfect logarithmic transformation (LRT1=4634.466, p<0.001) produced an interpretable and more visually normal distribution, even better than a square root transformation.
The Medicare days variable was obviously right skewed. The Box–Cox recommended transformation for the training set was raising to the 0.559 power, nearly a square root transformation. Thus, an imperfect square root transformation (LRT1=5.578, p=0.012) was sufficient for both interpretability and conversion to normality, and this transformation required no information from the training set.
The Medicaid days variable appeared roughly lognormal. While the optimal Box–Cox transformation power for the training set was 0.196, an imperfect logarithmic transform (LRT1=5=231.300, p<0.001) provided a visually more normal distribution while retaining interpretability.
While the optimal transformation for the CMI variable was −0.213, an imperfect logarithmic transformation (LRT1=9.088, p=0.003) provided a sufficiently normal and interpretable distribution by visual inspection. Similarly, an imperfect logarithmic transformation for the “ALOS” variable (LRT1=32.990, p<0.001) also made this variable visually normal while interpretable.
Box–Cox transformation failed to produce a visually reasonable Gaussian distribution for MCI even when selecting the optimal lambda. The distribution is close to bimodal at the ends. MCI was thus dichotomized at the median of the training set based on its intractable, bi-modal distribution. This split is interpretable and proved useful in modeling. To avoid leaking information from the training set to the test set, the median was calculated on the training set only. The dichotomous split for “below or equal to median” and “above median” were then applied to the test set. Figure 4 provides the pairs plots post-transformations.
 |
Figure 4 Quantitative variable distributions post-transformations. Abbreviations: LCR, labor compensation ratio; BedUtil, bed utilization; StaffedBeds, staffed beds; CC_MCC, complication/major complication rate; MCareDays, Medicare days %; MAidDays, Medicaid days %; CMI, case mix index; ALOS, average length of stay. |
Multiple Regression for Total Performance Score
Using multiple regression, we evaluated Total Performance Score as a function of all predictors. The initial regression model was built on the training set, and forecasts from that model were used to assess performance out-of-sample on the test set. The results of the statistically significant regression model ( ) are shown in Table 2 (coefficient and analysis of variance tables). Only bed utilization and some of the regions were not statistically part of the model at the α=0.10 level. The R2 was a modest 0.225 (adjusted R2=0.217), and the standard error was 10.01 TPS points.
 |
Table 2 Multiple Regression, Total Performance Scores (Training Set) |
LCR was negatively associated with TPS score (−5.23;  ), which we could interpret to mean for every 0.1 point increase in LCR, TPS was expected to fall by −0.523 points. The estimates from the training data were used to estimate the dependent variable in the test set. The forecast were reasonable, accounting for R2 = 0.1774 of the variance (root mean squared error = 4.711 TPS points.) While imperfect, the forecasts demonstrate little loss of generality. Figure 5 shows the observed versus forecast fit along with the residuals and a Q-Q plot. No variance inflation factors exceeded 4.2 (Region 4).
 |
Figure 5 Regression plots. |
Logistic Regression for Hospital Compare Rating (4 or 5 =1)
For the Hospital Compare Rating, we fit all independent and control variables to the training set and evaluated accuracy metrics on the test set using logistic regression. Only bed utilization and some regional variables were not statistically significant at the α=0.10 level. Table 3 provides the complete results of the logistic regression (coefficient and deviance table). In general, it was found that, holding all other factors constant and at the maximum Labor Cost Ratio, there is only a 9.1% chance of attaining a 4 or 5 Hospital Compare rating (OR = 0.1007; p<0.001; 95% CI [0.039, 0.254]; percentage calculated = 0.1007/1.1007). When using the training parameter estimates to forecast the test data, the results were reasonable. The forecast was 66% accurate in classification with a sensitivity (recall) of 62% and a precision (positive predictive value) of 54%. Specificity was 68%. The area under the curve was 64.37%. Classification metrics might have been improved by adding interaction terms; however, this parsimonious model appears to have reasonable external validity. Table 4 is the confusion matrix.
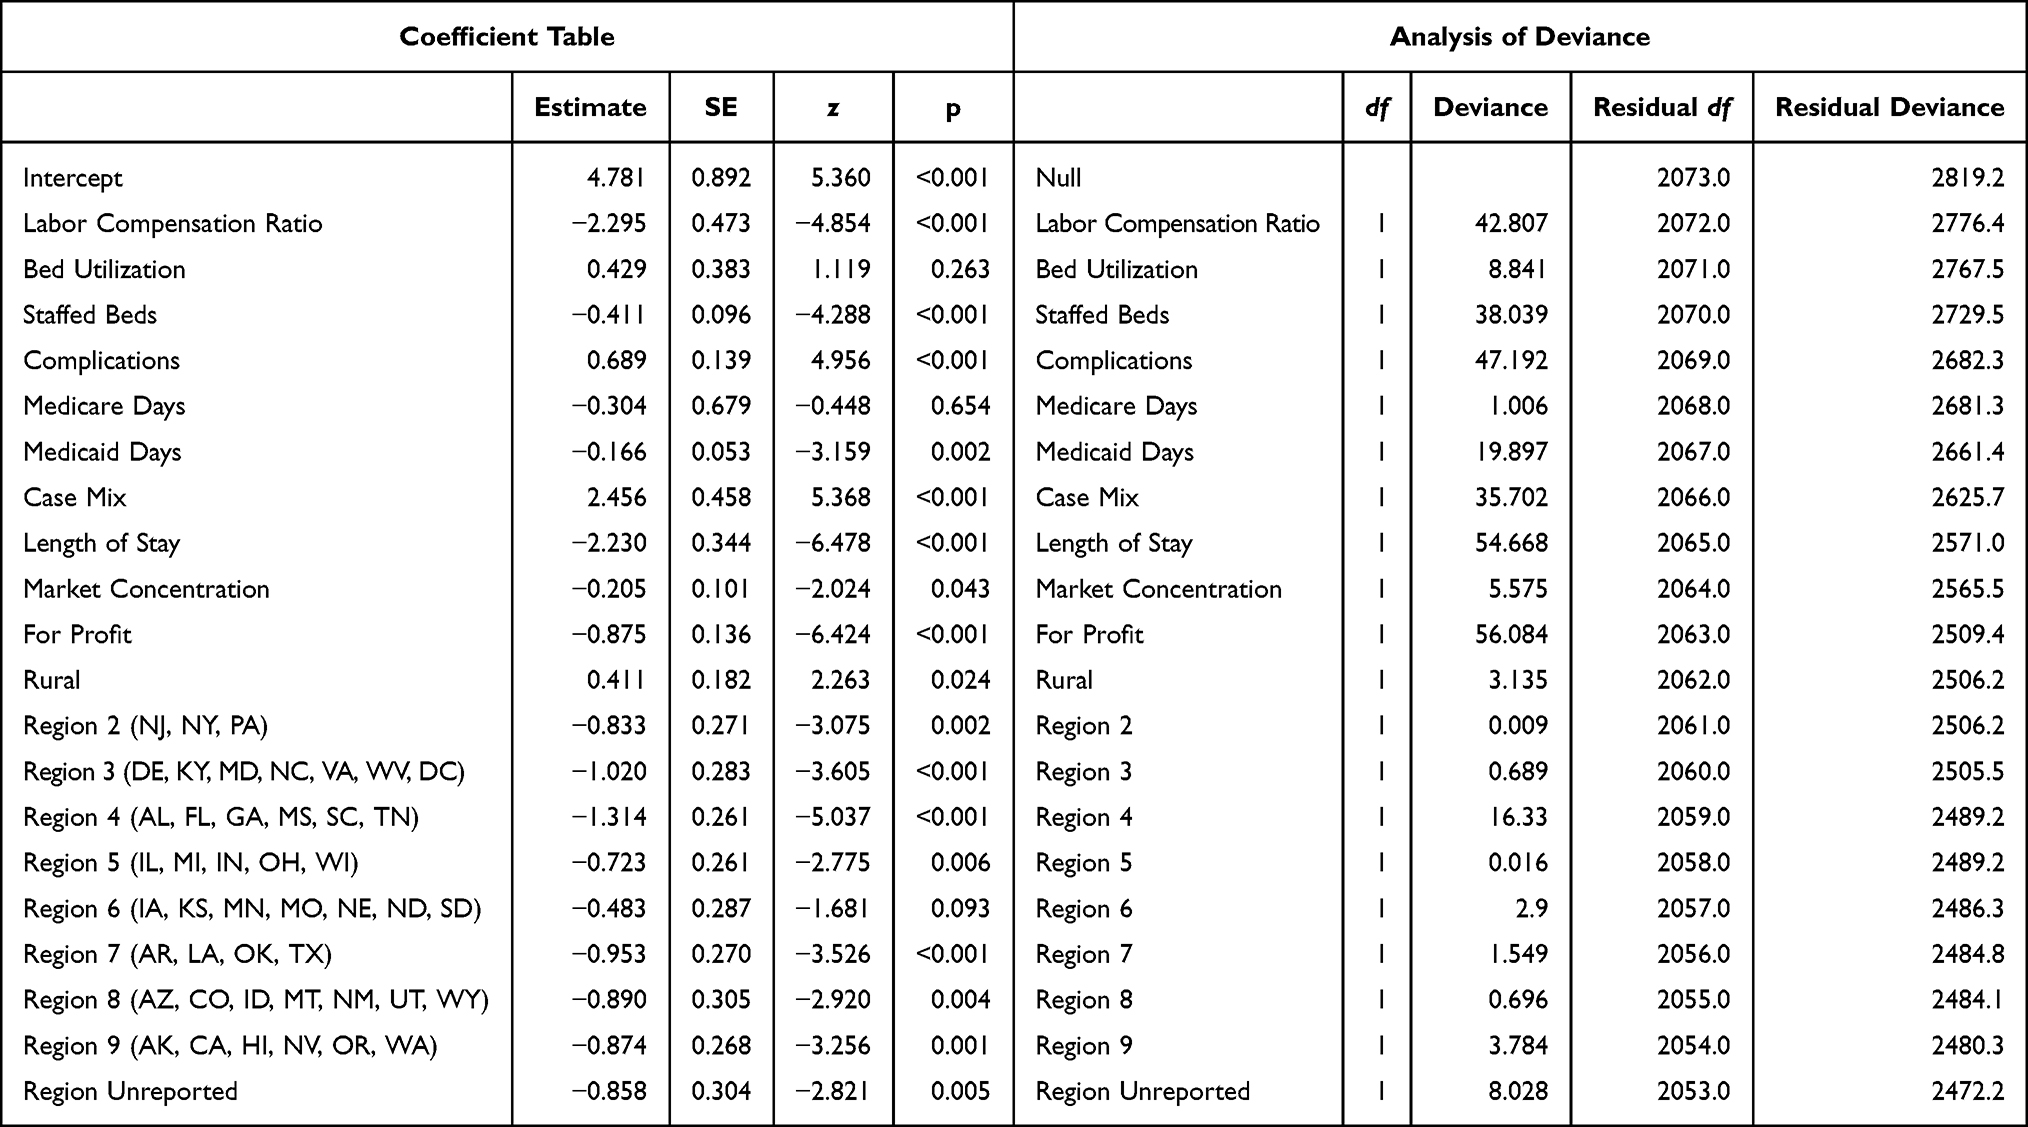 |
Table 3 Logistic Regression, Hospital Compare Rating (Training Set) |
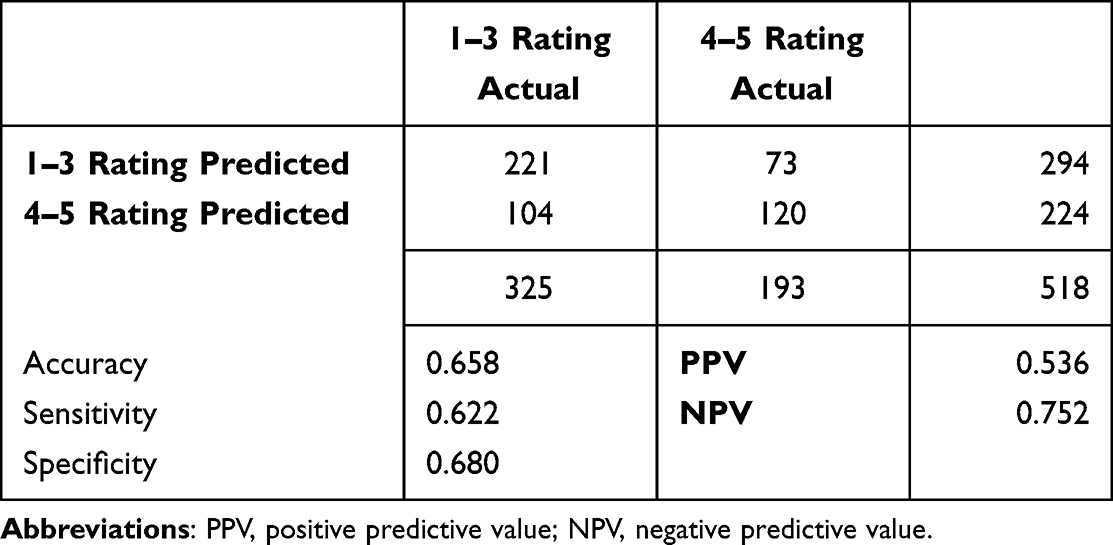 |
Table 4 Out-of-Sample Performance of Logistic Regression for Hospital Compare Rating |
Logistic Regression for HCAHPS Star Rating (4 or 5=1)
For the HCAPHS Star Rating, we also built a logistic regression on the training set and evaluated accuracy metrics on the test set. Only complications and MCI were not in the model at the α=0.10 level). In general, it was found that, holding all other factors constant and at the maximum Labor Cost Ratio, there is only a 23.9% chance of attaining a 4 or 5 HCAHPS Star Rating (OR = 0.315; p<0.035; 95% CI [0.107, 0.925]); percentage calculated = 0.315/1.315. Table 5 provides the coefficient and deviance information. The forecast of the test set was 78% accurate with a sensitivity of 68% but a low positive predictive value of 38% indicating over classification of the 4–5 Star factor level. Table 6 provides the classification metrics and confusion matrix.
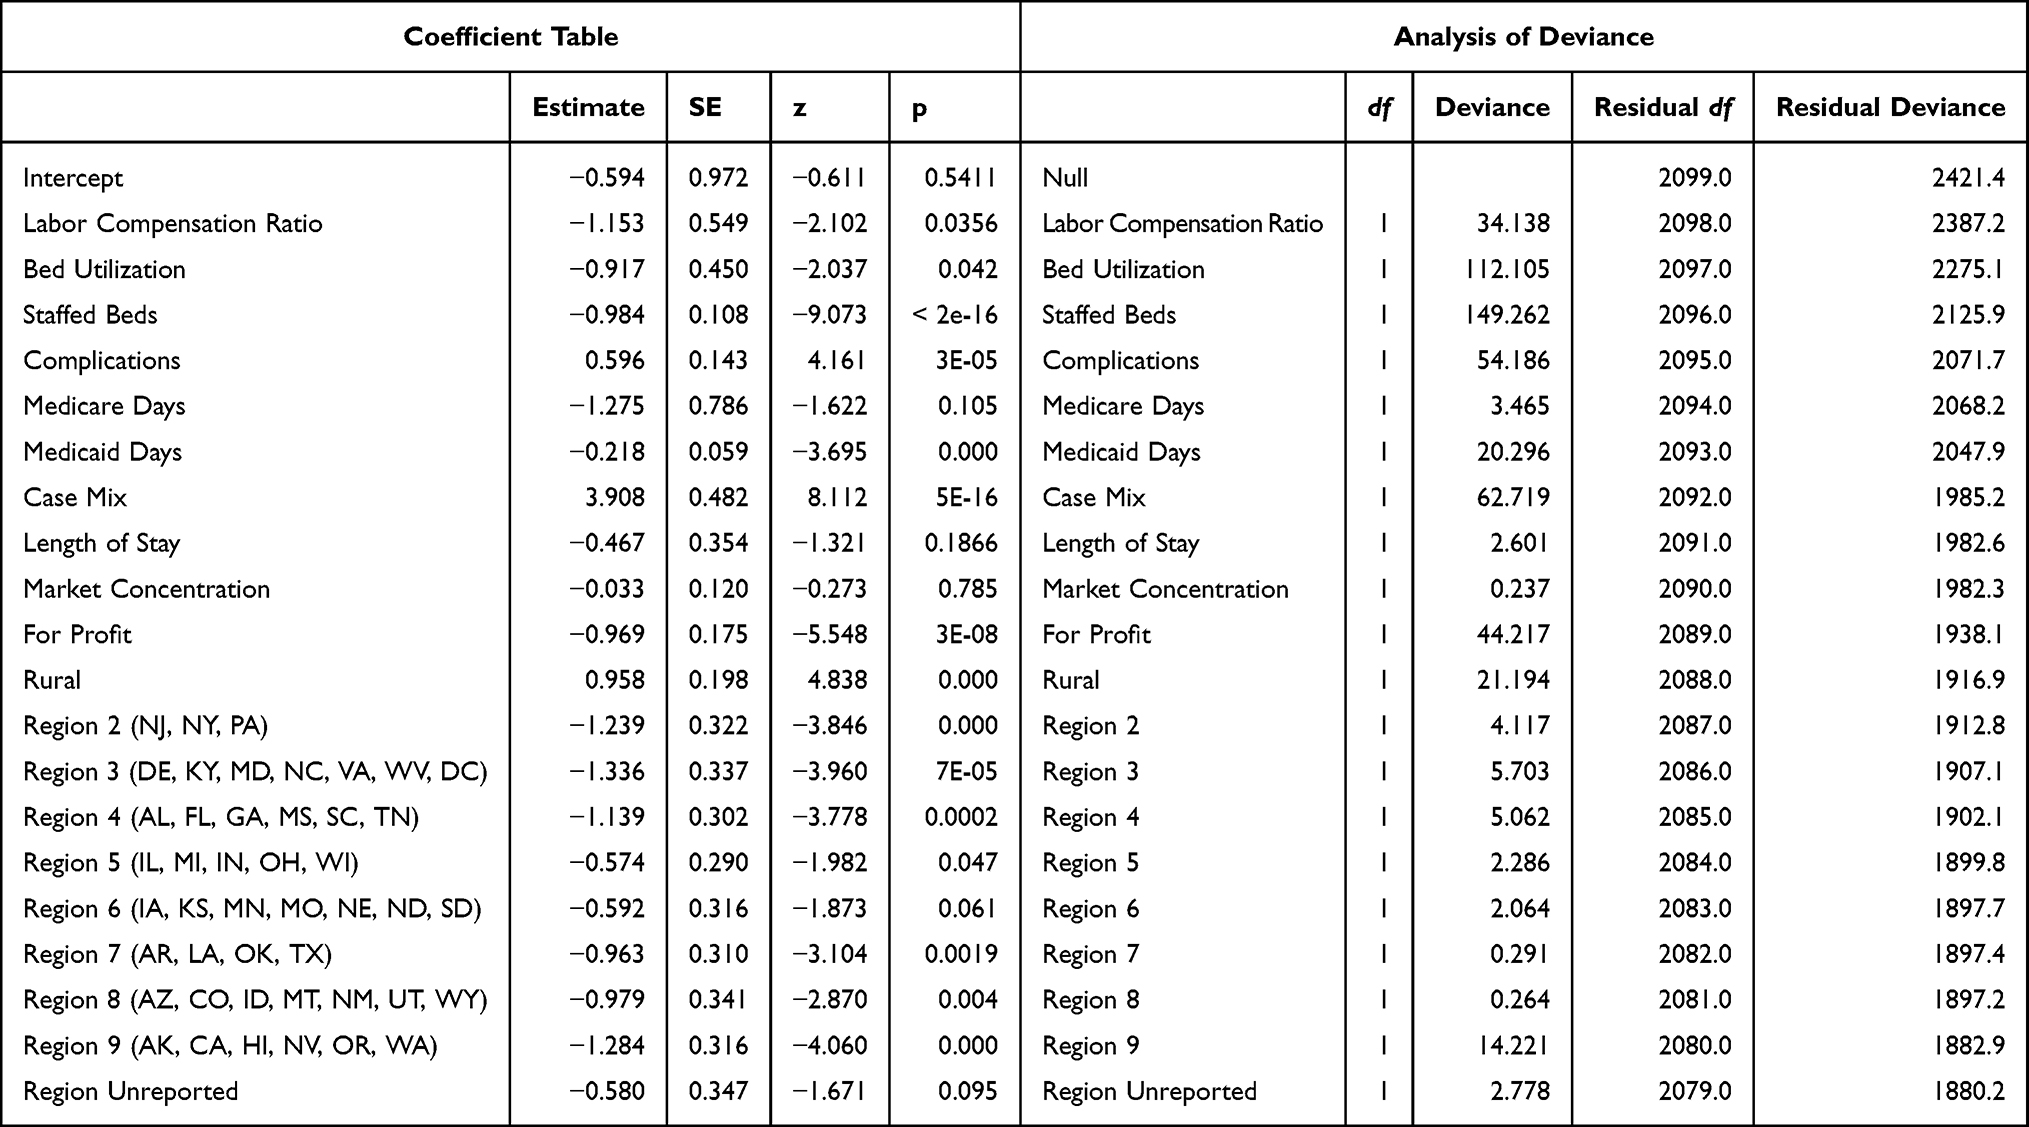 |
Table 5 Logistic Regression, HCAHPS Star Rating (Training Set) |
 |
Table 6 Out-of-Sample Performance of Logistic Regression for HCAHPS Star Rating |
Congruence Analysis
Coefficients were largely directionally stable for the three quality metrics evaluated across models. For 15 of the 20 variables, the coefficients were of the same direction across all models with 13 of the variables indicating a negative relationship with the quality metrics and only 2 variables (CMI and Rural status) indicating a positive relationship. For the remaining five variables, the p-values omitted them from one or more of the models. Table 7 provides the congruence matrix.
 |
Table 7 Coefficient Directionality Congruence |
Discussion
Our study sought to understand the relationship between hospitals’ cost of labor and the quality of care delivered. As previously discussed, based upon the tenets of Donabedian’s SPO model, Kissick’s Iron triangle framework, and agency theory, we hypothesized that healthcare labor costs and quality outcomes are negatively associated. Our findings support our hypothesis. Our results may appear surprising because higher salaries, wages, and benefits are often cited as a primary motivator in the clinical setting and a central aspect of labor discussions.43,44 We also consider these results to somewhat contradict the prior findings of Hurst & Smith and Lasater, Sloane & Aiken who suggested that there is little connection between increased healthcare staffing costs and the use of temporary staff and the quality of care provided.27,28 Our results indicate there is an association – albeit a negative one – that is worth noting. We believe our results are most appropriately aligned with the work of Dall’Ora, Maroutti and Griffiths, Deci, and Ariely, Gneezy, Loewenstein and Mazar who report that if higher cost labor is attributed to specific sources, such as contract staff and temporary workers, it can lead to decreased performance in some work environments.29–31
Our study is restricted to elevated hospital labor costs, and we do not explore the potential pathways responsible for it. However, given the difficulties hospitals encountered throughout the COVID-19 crisis, we consider it likely that hospitals were forced to be flexible in their choice of staffing mix. To do so, hospitals may have had to pay dramatically elevated wage rates for overtime and temporary staff over a long time.3,6 It is well known in high-risk industries that perpetually operating with staff that have been over-extended can have damaging short-term and long-term effects – both personally and professionally. For example, numerous prior authors have reported both errors and near errors are more likely to occur when hospital staff nurses work extended shifts.45,46 Likewise, the increased use of contract staff has been shown to reflect in lowered overall quality and patient satisfaction.47–50 It is well documented that both workforce solutions were in use before the pandemic started and broadened across the subsequent 2 years – with notable safety concerns.45
There is also the potential that due to the increased cost of labor, hospitals were forced to cut back in other areas of the facility with damaging quality implications. Staff furloughs in non-critical areas were a widespread practice, but cost-cutting measures also may include limitations on supply items or altering supply requisitions to procure products of lower cost and quality, delaying critical new diagnostic equipment purchases, and requiring staff to perform non-traditional roles.46 When considered in isolation, none of these issues are likely to meaningfully increase risk to patient care; however, when considered in totality, it is logical that undue additional patient safety risk might be introduced in the clinical setting, reflecting lower quality of care.
Limitations and Recommendations for Future Research
Several limitations are present in our study. First, it is the fact our data are drawn from one of the most difficult periods of US hospital performance – in the middle of the COVID-19 pandemic – when hospitals were struggling to meet patient demand and retain nursing staff. We do not view this as a detraction from our study, but we are curious if this same phenomenon will persist in future years or if the same association would be present in a historical longitudinal study. The current study is drawn from a single data year (2021), and though we have lagged independent and control variables (2019) to address endogeneity and reverse causality, future research using longitudinal data may provide increased insight of the tested relationship.
Second, we recognize there is more at work in our data set and our targeted study population. Notably, there are other potential factors that influence our studied relationship that we are not capturing in our study. For instance, the quality of leadership, the service mix, the composition of the clinical staff, the age of the workforce, the hospital age of plant, and the workplace culture are all factors that may be relevant in understanding the quality of healthcare outcomes.
Third, the Labor Cost Ratio (LCR) accounts for all sources of labor cost in one variable. Further study might be worthwhile to directly determine if the level of contract staff versus long-term employees is more strongly or weakly associated with the variation we observed in our dependent quality outcome measures. This additional research would provide insight to hospital leaders regarding the potential quality-centric risks when agency staff are utilized to fill the gaps in times of workforce shortages. Or, if a strong negative relationship is discovered, it may indicate that healthcare leaders must take additional steps to ensure that temporary staff are fully immersed in the organization’s operating procedures, protocols, and work culture.
A final limitation centers on the fact that all our chosen quality-dependent variables are weighted aggregates. Although this provides consistency across our studied population, additional insight might be gained by examining our study relationship on more granular aspects of each of the current dependent variables. As an example, in further research, we could evaluate each of the component parts of the value-based purchasing Total Performance Score. This would provide clarity regarding where labor costs have the greatest association as far as quality is concerned – clinical outcomes, person and community engagement, safety, or efficiency and cost reduction. Similar efforts could be applied to the measures supporting the Hospital Compare overall rating or the HCAHPS summary star rating.
Practice Implications
Drawing from our findings, we believe that the negative labor cost–quality association is an issue that highlights the undue risk that hospital staffing and workforce management issues may be introducing into the hospital environment. Consideration should be undertaken to assess the cost–quality–access issue. Should hospitals use financial incentives to address the labor shortage? Should a service line remain open if poorly staffed or staffed with a sub-optimal workforce? Is offering services irrespective of the quality of care one might receive in patients’ best interest? We suggest it is at least worth considering on a case-by-case basis. The political implications of closing a facility for workforce concerns in the middle of a national emergency is serious. However, if this issue persists beyond the end of the pandemic, we suggest there are systemic workforce management issues that must be addressed. The deployment of human resources in any organization needs to be aligned with the desired outcomes and the role of the care recipient needs to be incorporated in the organizational structure and the daily care process.46 We recognize that reversing the negative labor cost–quality association is far from simple, and this, too, has been a chronic concern.43 However, following the extreme measures hospital leaders were forced to take during the recent pandemic, the political and institutional will is present to adopt new staffing methods to simultaneously improve continuity of care, decrease cost, and enhance quality. Among these are efforts to reduce staff turnover and mitigate wage inflation by moving agency staffing “in house” in at least one large healthcare system, increasing opportunities for remote or hybrid work schedules, restructuring work schedules to reduce commute times, and altering shift differentials to alleviate off-hours and weekend coverage challenges.45,51,52 Yet, increased salaries, signing bonuses, and retention bonuses remain primary recruitment and retention strategies for many healthcare leaders.52 This leads us to question if the emerging cost reduction and workforce stabilization strategies will prove effective and if patients will receive the quality of care they expect – or not.
Ethics Statement
Prior research of this type has been reviewed by the Texas State University Research Integrity and Compliance (RIC). According to the provisions in 45 CFR § 46.102 pertaining to “human subject” research, the RIC has previously determined studies of this type exclusively involve the examination of data originally collected and created by Definitive Healthcare, which provides data that is anonymous and publicly available. Therefore, the RIC has concluded this type of research does not use human subjects and is not regulated by the provisions in 45 CFR § 46.102 and therefore an IRB review of the study has not been required.
Acknowledgments
This paper was presented at the Texas State University Health Scholars Showcase on March 3, 2023 as a poster presentation with interim findings. The poster is available in “Recent Submissions” at: https://digital.library.txstate.edu/handle/10877/16500.
Disclosure
The authors report no conflicts of interest in this work.
References
1. Hall K; American Hospital Association. Financial effects of COVID-19: hospital outlook for the remainder of 2021; 2022. Available from: https://www.aha.org/system/files/media/file/2021/09/AHA-KH-Ebook-Financial-Effects-of-COVID-Outlook-9-21-21.pdf.
2. Hall K. The financial effects of hospital workforce dislocation; 2022. Available from: https://www.kaufmanhall.com/sites/default/files/2022-05/KH-NHFR-Special-Report-2.pdf.
3. American Hospital Association. Massive growth in expenses and rising inflation fuel continued financial challenges for America’s hospitals and health systems. Cost of caring report. 2022a.
4. American Hospital Association. Current state of hospital finances: fall 2022 update; 2022b. Available from: https://www.aha.org/guidesreports/2022-09-15-current-state-hospital-finances-fall-2022-update.
5. American Hospital Association. Data brief: workforce issues remain at the forefront of pandemic-related challenges for hospitals; 2022c. Available from: https://www.aha.org/issue-brief/2022-01-25-data-brief-workforce-issues-remain-forefront-pandemic-related-challenges.
6. American Hospital Association. Data brief: health care workforce challenges threaten hospitals’ ability to care for patients; 2021. Available from: https://www.aha.org/fact-sheets/2021-11-01-data-brief-health-care-workforce-challenges-threaten-hospitals-ability-care.
7. Lohr KN. Medicare: A Strategy for Quality Assurance. Vol. I. National Academies Press; 1990.
8. McGlynn EA. Six challenges in measuring the quality of health care. Health Aff. 1997;16(3):7–21. doi:10.1377/hlthaff.16.3.7
9. Donabedian A. The quality of care: how can it be assessed? JAMA. 1988;260(12):1743–1748. doi:10.1001/jama.1988.03410120089033
10. Makary MA, Daniel M. Medical error—the third leading cause of death in the US. BMJ. 2016;2016:353.
11. Centers for Medicare and Medicaid Services. Hospital Inpatient Quality Reporting (IQR) program measures; 2022a. Available from: https://qualitynet.cms.gov/inpatient/iqr/measures.
12. Centers for Medicare and Medicaid Services. Outpatient Quality Reporting (OQR) program measures; 2022b. Available from: https://qualitynet.cms.gov/outpatient/oqr/measures.
13. Centers for Medicare and Medicaid Services. Hospital quality initiative public reporting – hospital care compare and provider data catalog; 2022c. Available from: https://www.cms.gov/medicare/quality-initiatives-patient-assessment-instruments/hospitalqualityinits/hospitalcompare.
14. Centers for Medicare and Medicaid Services. HCAHPS: patients’ perspectives of care survey; 2022d. Available from: https://www.cms.gov/Medicare/Quality-Initiatives-Patient-Assessment-Instruments/HospitalQualityInits/HospitalHCAHPS.
15. Abrams M, Nuzum R, Zezza M, Ryan J, Kiszla J, Guterman S. The affordable care’ct’s payment and delivery system reforms: a progress report at five years. Issue Brief. 2015;12:1–16.
16. Centers for Medicare and Medicaid Services. Hospital value based purchasing program; 2022e. Available from: https://www.cms.gov/Medicare/Quality-Initiatives-Patient-Assessment-Instruments/HospitalQualityInits/Hospital-Value-Based-Purchasing.
17. Bureau of Labor Statistics, U.S. Department of Labor. Occupational outlook handbook. Registered nurses. Available from: https://www.bls.gov/ooh/healthcare/registered-nurses.html.
18. Zhang X, Tai D, Pforsich H, Lin VW. United States registered nurse workforce report card and shortage forecast: a revisit. Am J Med Qual. 2018;33(3):229–236. doi:10.1177/1062860617738328
19. Perry SJ, Richter JP, Beauvais B. The effects of nursing satisfaction and turnover cognitions on patient attitudes and outcomes: a three‐level multisource study. Health Serv Res. 2018;53(6):4943–4969. doi:10.1111/1475-6773.12997
20. Haddad LM, Annamaraju P, Toney-Butler TJ. Nursing shortage. In: StatPearls. StatPearls Publishing; 2022.
21. Wilensky GR. The COVID-19 pandemic and the US health care workforce. JAMA Health Forum. 2022;3(1):e220001–e220001. doi:10.1001/jamahealthforum.2022.0001
22. Welton JM. Hospital nursing workforce costs, wages, occupational mix, and resource utilization. J Nurs Adm. 2015;45(10):S10–S15.
23. MacDowell M, Glasser M, Fitts M, Nielsen K, Hunsaker M. A national view of rural health workforce issues in the USA. Rural Remote Health. 2010;10(3):1531.
24. Zhang X, Lin D, Pforsich H, Lin VW. Physician workforce in the United States of America: forecasting nationwide shortages. Hum Resour Health. 2020;18(1):1–9. doi:10.1186/s12960-020-0448-3
25. Buerhaus PI, Staiger DO, Auerbach DI. Is the current shortage of hospital nurses ending? Health Aff. 2003;22(6):191–198. doi:10.1377/hlthaff.22.6.191
26. Barry J, Lin V. Real wage growth in the US health workforce and the narrowing of the gender pay gap. Hum Resour Health. 2021;19(1):1–9. doi:10.1186/s12960-020-00545-0
27. Hurst K, Smith A. Temporary nursing staff–cost and quality issues. J Adv Nurs. 2011;67(2):287–296. doi:10.1111/j.1365-2648.2010.05471.x
28. Lasater MKB, Sloane DM, Aiken LH. Hospital employment of supplemental registered nurses and patients’ satisfaction with care. J Nurs Adm. 2015;45(3):145. doi:10.1097/NNA.0000000000000174
29. Deci EL. Effects of externally mediated rewards on intrinsic motivation. J Pers Soc Psychol. 1971;18(1):105. doi:10.1037/h0030644
30. Ariely D, Gneezy U, Loewenstein G, Mazar N. Large stakes and big mistakes. Rev Econ Stud. 2009;76(2):451–469. doi:10.1111/j.1467-937X.2009.00534.x
31. Dall’Ora C, Maruotti A, Griffiths P. Temporary staffing and patient death in acute care hospitals: a retrospective longitudinal study. J Nurs Scholarsh. 2020;52(2):210–216. doi:10.1111/jnu.12537
32. Kissick WL. Medicine’s Dilemmas: Infinite Needs versus Finite Resources. London, UK: Yale University Press; 1994.
33. Beauvais B, Kruse CS, Fulton L, et al. Testing Kissick’s iron triangle—structural equation modeling analysis of a practical theory. Healthcare. 2021;9(12):1753. doi:10.3390/healthcare9121753
34. Eisenhardt KM. Agency theory: an assessment and Review. Acad Manage Rev. 1989;14(1):57–74. doi:10.2307/258191
35. Conlon EJ, Parks JM. Effects of monitoring and tradition on compensation arrangements: an experiment with principal-agent dyads. Acad Manage J. 1990;33(3):603–622.
36. Eisenhardt KM. Agency and institutional explanations of compensation in retail sales. Acad Manage J. 1988;31:488–511. doi:10.2307/256457
37. Definitive Healthcare. Healthcare analytics & provider data|Definitive Healthcare. Available from: https://www.defhc.com.
38. Stiebale J. Do financial constraints matter for foreign market entry? A firm-level examination. World Econ. 2011;34:123–153. doi:10.1111/j.1467-9701.2010.01306.x
39. Buch C, Koch CT, Koetter M. Do banks benefit from internationalization? Revisiting the market power–risk nexus. RevFinance. 2013;17:1401–1435. doi:10.1093/rof/rfs033
40. Beauvais B, Richter JP, Kim FS. Doing well by doing good: evaluating the influence of patient safety performance on hospital financial outcomes. Health Care Manage Rev. 2017;27:164.
41. Beauvais B, Richter JP, Kim FS, Palmer EL, Spear BL, Turner RC. A reason to renovate: the association between hospital age of plant and value-based purchasing performance. Health Care Manage Rev. 2021;46(1):66–74. doi:10.1097/HMR.0000000000000227
42. Box GEP, Cox DR. An analysis of transformations. J Royal Statis Soc Series B. 1964;26(2):211–243.
43. May JH, Bazzoli GJ, Gerland AM. Hospitals’ responses to nurse staffing shortages: hospitals’ actions are having a positive impact, but can it be sustained for the long run? Health Aff. 2006;25(Suppl1):W316–W323. doi:10.1377/hlthaff.25.w316
44. Baljoon RA, Banjar HE, Banakhar MA. Nurses’ work motivation and the factors affecting It: a scoping review. Int J Nurs Clin Pract. 2018;5(1):277. doi:10.15344/2394-4978/2018/277
45. Lasater KB, Aiken LH, Sloane DM, et al. Chronic hospital nurse understaffing meets COVID-19: an observational study. BMJ Qual Saf. 2021;30(8):639–647. doi:10.1136/bmjqs-2020-011512
46. King R. Kaufman Hall: COVID-19 will force permanent changes to hospital staff, supply systems, Fierce Healthcare; 2021. Available from: https://www.fiercehealthcare.com/hospitals/kaufman-hall-covid-19-will-force-permanent-changes-to-hospital-staff-supply-systems.
47. Rogers AE, Hwang WT, Scott LD, Aiken LH, Dinges DF. The working hours of hospital staff nurses and patient safety. Health Aff. 2004;23(4):202–212. doi:10.1377/hlthaff.23.4.202
48. Rogers AE. The effects of fatigue and sleepiness on nurse performance and patient safety. Patient safety and quality: an evidence-based handbook for nurses. 2008.
49. Morse EL, Ficara C, Tackett M, et al. One hospital’s strategic initiative to eliminate agency staffing. Nurse Leader. 2005;3(2):49–51. doi:10.1016/j.mnl.2005.01.011
50. Hockenberry JM, Becker ER. How do hospital nurse staffing strategies affect patient satisfaction? ILR Rev. 2016;69(4):890–910. doi:10.1177/0019793916642760
51. Tossaint-Schoenmakers R, Versluis A, Chavannes N, Talboom-Kamp E, Kasteleyn M. The challenge of integrating eHealth into health care: systematic literature review of the Donabedian model of structure, process, and outcome. J Med Internet Res. 2021;23(5):e27180. doi:10.2196/27180
52. Yang YT, Mason DJ. COVID-19’s impact on nursing shortages, the rise of travel nurses, and price gouging. Health Affairs Forefront. 2022;20:178.
 © 2023 The Author(s). This work is published and licensed by Dove Medical Press Limited. The
full terms of this license are available at https://www.dovepress.com/terms
and incorporate the Creative Commons Attribution
- Non Commercial (unported, 3.0) License.
By accessing the work you hereby accept the Terms. Non-commercial uses of the work are permitted
without any further permission from Dove Medical Press Limited, provided the work is properly
attributed. For permission for commercial use of this work, please see paragraphs 4.2 and 5 of our Terms.
© 2023 The Author(s). This work is published and licensed by Dove Medical Press Limited. The
full terms of this license are available at https://www.dovepress.com/terms
and incorporate the Creative Commons Attribution
- Non Commercial (unported, 3.0) License.
By accessing the work you hereby accept the Terms. Non-commercial uses of the work are permitted
without any further permission from Dove Medical Press Limited, provided the work is properly
attributed. For permission for commercial use of this work, please see paragraphs 4.2 and 5 of our Terms.