Back to Journals » Nature and Science of Sleep » Volume 18

An Exploration of Craniofacial Features in Obstructive Sleep Apnea Using the Explainable Deep Learning Approaches
Authors Luo L ![]() , Yang R, Pei Z
, Yang R, Pei Z ![]() , Yu M
, Yu M ![]() , Gong X, Lei Y, Wang Q, Gao X
, Gong X, Lei Y, Wang Q, Gao X ![]()
Received 14 March 2026
Accepted for publication 23 May 2026
Published 18 June 2026 Volume 2026:18 609113
DOI https://doi.org/10.2147/NSS.S609113
Checked for plagiarism Yes
Review by Single anonymous peer review
Peer reviewer comments 2
Editor who approved publication: Professor Valentina Alfonsi
Liuyi Luo,1,2,* Ruicong Yang,1,2,* Zitong Pei,3,* Min Yu,1,2,4 Xu Gong,1,2 Yi Lei,5 Qing Wang,5 Xuemei Gao1,2
1Department of Orthodontics, Peking University School and Hospital of Stomatology, Beijing, 100081, People’s Republic of China; 2National Center for Stomatology, Beijing, 100081, People’s Republic of China; 3College of Computer Science, Beijing University of Technology, Beijing, 100124, People’s Republic of China; 4Department of Orthodontics, Peking University School of Stomatology Sanya Division (Sanya Stomatology Center), Sanya, 572000, People’s Republic of China; 5Pharmacovigilance Research Center for Information Technology and Data Science, Cross-Strait Tsinghua Research Institute, Xiamen, 361015, People’s Republic of China
*These authors contributed equally to this work
Correspondence: Qing Wang, Pharmacovigilance Research Center for information technology and Data Science, Cross-strait Tsinghua Research Institute, No. 516 Qishan North Road, Huli District, Xiamen, 361015, People’s Republic of China, Tel +86-0592-5776165, Fax +86-0592-5776165, Email [email protected] Xuemei Gao, Department of Orthodontics, Peking University School and Hospital of Stomatology & National Center of Stomatology, Beijing, 100081, People’s Republic of China, Tel +86-010-82195350, Fax +86-010-82195350, Email [email protected]
Purpose: Traditional craniofacial phenotyping of obstructive sleep apnea (OSA) relies on predefined anatomical hypotheses, often yielding incomplete assessments. This study aimed to apply multiple explainable deep learning (DL) approaches to explore novel craniofacial phenotypes.
Patients and Methods: A multimodal DL model was trained using frontal and lateral facial images, lateral cephalograms, and demographic data from 130 participants (65 OSA patients diagnosed by overnight polysomnography, and 65 age- and sex-matched controls). Explainability analysis of the model’s prediction was conducted in a subset of 56 participants per group using average face analysis, feature importance analysis, and gradient-weighted class activation mapping (Grad-CAM). Targeted measurements were then performed on the identified non-traditional regions to validate morphological differences.
Results: The model achieved an area under the curve of 0.87. The explainability analysis identified not only anatomical structures that have been confirmed to predict OSA (such as the mandible, chin, and hyoid regions), but also the middle and upper facial third (e.g. the forehead, eyebrows, and upper eyelids), which has not been fully emphasized in previous studies. Targeted measurements confirmed a significantly smaller inter-eyebrow distance, increased frontal protrusion (p < 0.001) and frontal sinus area (p < 0.001) in OSA patients.
Conclusion: Explainable DL expanded OSA-related craniofacial phenotypes. Future studies are needed to validate these upper-face traits in larger cohorts and clarify their relevance to OSA subtyping and mechanisms.
Keywords: deep learning, explainable artificial intelligence, obstructive sleep apnea, craniofacial morphology, convolutional neural networks
Introduction
Craniofacial morphology serves not only as an etiological factor in obstructive sleep apnea (OSA),1 but also as a key identifier of its phenotypes. Previous studies have shown that individuals with OSA frequently exhibit mandibular retrusion, vertical growth tendency, low hyoid position, and maxillary deficiency,2–4 with analyses primarily focusing on the upper airway-related structures and the lower third of the face. These structural traits may contribute to OSA by promoting upper airway narrowing and airway collapsibility during sleep.5,6 OSA-related craniofacial features also show ethnic variability. Chinese patients with OSA tend to show more craniofacial bony restriction compared with Caucasians,7,8 supporting the need for population-specific phenotyping in Chinese cohort.
Recently, deep learning (DL) models, particularly convolutional neural networks (CNNs), have shown potential for craniofacial image-based OSA screening. CNN models trained on multi-angle 2D or 3D facial images achieved area under the receiver operating characteristic (ROC) curve (AUC) ranging from 0.65 to 0.91.9,10 A Bayesian meta-analysis of studies up to 2023 evaluating 10 AI models reported high sensitivity (91.1%) but relatively low specificity (79.2%) for DL-based facial recognition in OSA.11 Despite variable performance and limited specificity of current models, these studies consistently show that diagnostically meaningful OSA-related information can be extracted from craniofacial images. Some DL models even showed performance superior to clinical questionnaires and human experts,9,12 indicating that DL models may identify craniofacial features beyond traditional assessments.
Unlike predefined manual measurements, DL operates through data-driven learning, automatically extracting comprehensive morphological representations.13 However, its black-box nature obscures exactly which features drive its predictions, and explainable artificial intelligence (XAI) has therefore been employed to interpret DL models and visualize the predictive regions.14 In OSA research, most XAI analyses focused on confirming whether the DL model’s attention aligned with established craniofacial features.15,16 Although this enhances clinical trust, constraining interpretations to prior morphological characteristics may limit the identification of more complex or previously under-recognized phenotypes.17 By leveraging the powerful image-analysis capacity of DL, XAI holds the potential to serve as a data-driven tool for discovering novel morphological features.18
To explore this potential, the present study aimed to apply multiple explainable DL approaches to identify the craniofacial regions driving OSA classification, subsequently translating these AI-identified areas into quantifiable metrics to evaluate morphological differences. The proposed methodology provides an AI-driven framework for OSA phenotype discovery to advance future research, screening strategies, and clinical understanding.
Material and Methods
This study was conducted in accordance with the Declaration of Helsinki and was approved by the ethics committee of Peking University Hospital of Stomatology (PKUSSIRB-202388087). Each participant was assigned a unique identification code during data processing to protect privacy. An overview of the study methodology is briefly illustrated in Figure 1.
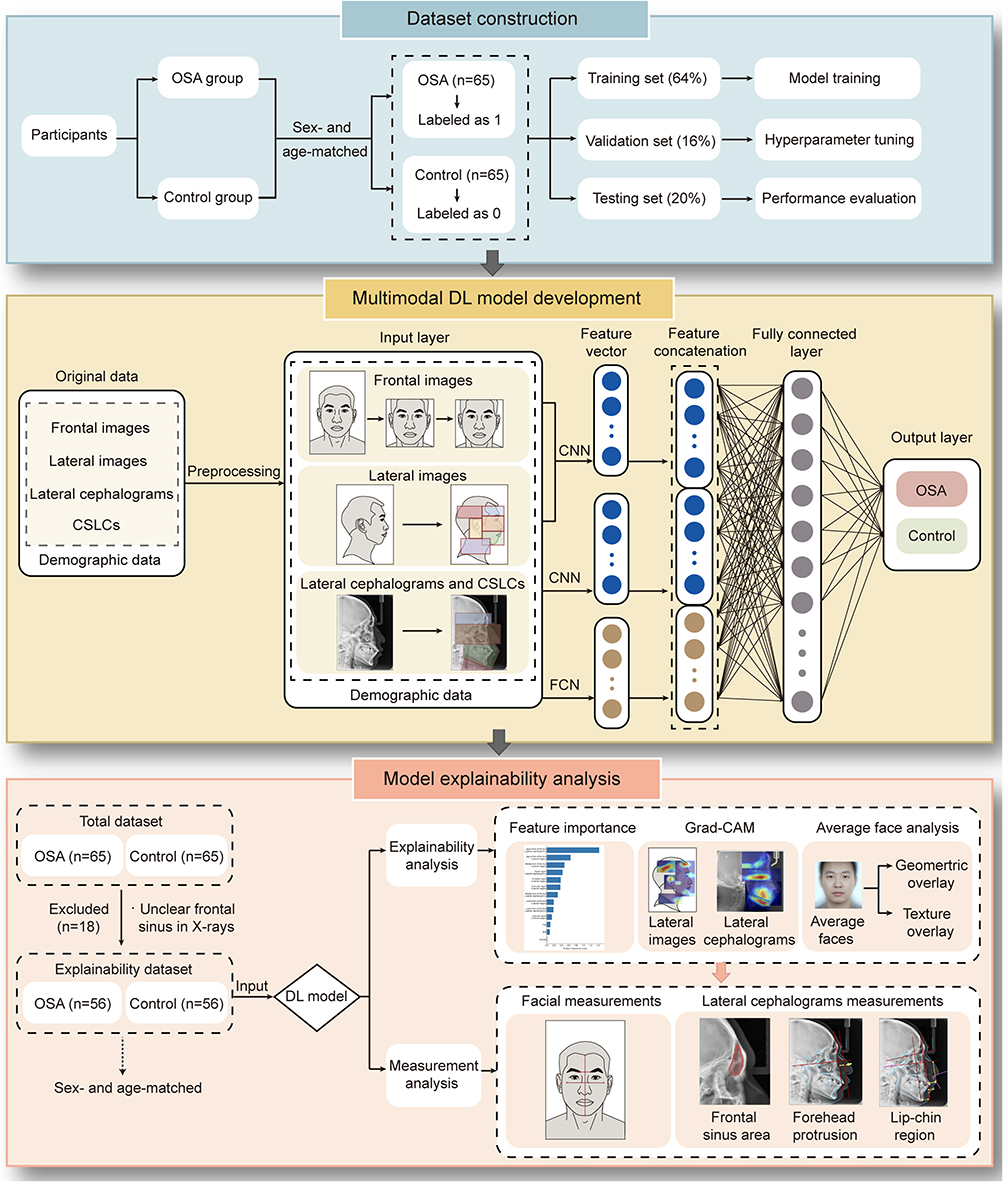 |
Figure 1 Schematic representation of the research pipeline. The workflow comprises dataset construction, multimodal deep learning model development, and model explainability analysis followed by targeted measurement validation. Abbreviations: OSA, obstructive sleep apnea; DL, deep learning; CSLCs, cone beam computed tomography (CBCT)-synthesized lateral cephalogram; CNN, convolutional neural network; FCN, fully connected network; Grad-CAM, Gradient-weighted Class Activation Mapping. |
Study Population
The sample size calculation was based on the ROC curve using PASS 16 (NCSS, LLC, Kaysville, Utah, USA).19 We aimed for 80% power (1 - β) at a two-sided significance level of α = 0.05 to detect a target AUC of 0.80 against a null hypothesis AUC of 0.50. This calculation indicated a minimum of 51 subjects per group was required.
Participants were recruited from the Center for Oral Therapy of Sleep Apnea and the Department of Orthodontics of Peking University Hospital of Stomatology between January 2022 and March 2024. OSA patients were diagnosed by overnight PSG. All participants had frontal and lateral facial images, lateral cephalograms, or cone beam computed tomography (CBCT) scans obtained routinely during clinical visits.
The inclusion criteria for the OSA group were as follows: 1) clinical manifestations consistent with OSA, such as snoring; 2) diagnosed with OSA by overnight PSG; 3) age ≥ 18 years; 4) complete demographic data (height, weight, age) and imaging records. The control group was individually matched 1: 1 to the OSA group by age and sex, and the inclusion criteria included: 1) no sleeping disorders confirmed by overnight PSG, or no snoring witnessed by bed partner; 2) complete demographic data and imaging records.
The exclusion criteria for participants in both groups included: 1) presence of other sleep disorders; 2) congenital syndromes or craniofacial anomalies (eg., cleft lip/palate); 3) body mass index (BMI) > 32 kg/m2; 4) severe systemic diseases, including cardiovascular disease, diabetes, or dyslipidemia; 5) occupational skin color changes (eg., hyperpigmentation from prolonged outdoor exposure to high temperatures).
A total of 130 participants were recruited, comprising 65 patients with OSA and 65 age- and sex-matched controls (48 males and 17 females in each group), thus no significant inter-group differences in age and sex. To ensure the precision of the subsequent explainability analysis and measurement analysis, participants with unclear visualization of craniofacial landmarks (eg., the frontal sinus and surrounding structures) on lateral cephalograms were excluded. This resulted in the exclusion of 18 subjects in total (8 males and 10 females), leaving a final subset of 56 subjects per group (44 males and 12 females), with no significant inter-group differences in age or sex.
Polysomnography (PSG)
Overnight PSG was conducted at accredited sleep centers of the Peking University Health Science Center affiliated hospitals. OSA was defined according to the standard American Academy of Sleep Medicine (AASM) criteria,20 with the apnea-hypopnea index (AHI) of 5 or more events per hour.
Facial Images Collection
The facial images were captured using a camera (Canon EOS 60D, Japan) with a 60 mm prime lens by the same trained photographer, blinded to the participant’s group, and the standardized protocol is as follows: 1) reflective umbrellas and light shields were arranged to ensure uniform facial illumination and eliminate shadows. 2) The camera was positioned 150 cm from the subject’s face at mid-facial height. 3) Participants were asked to remove makeup, glasses, and accessories, maintain a natural head posture, and keep eyes open, teeth gently clenched, lips relaxed, and forehead, neck and ears exposed. 4) For frontal images, subjects looked straight ahead, and the camera viewfinder was aligned horizontally with the interpupillary line, centered at the nasal tip; for profile images, subjects maintained a fixed head tilt and rotated 90° laterally, with the Frankfort horizontal (FH) plane parallel to the ground. The viewfinder center was aligned about 1 cm anterior to the tragus. All images were saved in JPEG format.
Lateral Cephalograms Collection
The lateral cephalograms were obtained using Veraviewepocs 2D (J Morita Corp, Kyoto, Japan), with the following settings: tube voltage 90 kV, tube current 5–10 mA, and scan time 4.9 s. Each participant was instructed to maintain a natural head posture in an upright standing position, with teeth in centric occlusion, the tongue lightly pressed against the palate, and steady, quiet breathing without swallowing. All images were saved in JPEG format.
CBCT and CBCT-Synthesised Lateral Cephalograms Collection
CBCT scans were conducted by NewTom VG system (Aperio Services, Italy) and the parameters are as follows: tube voltage 120 kV, tube current 5 mA, scan time 40s, field of view 13×17 cm, and voxel size 0.25 mm. The participant’s position was kept consistent with that used for lateral cephalograms and the image range extended from the eyebrows to the laryngeal prominence. For participants without lateral cephalograms, CBCT-synthesized lateral cephalograms (CSLCs) were constructed for analysis. CBCT data were stored in DICOM format and reconstructed in Dolphin (version 11.95, USA) into JPEG images. Previous studies comparing traditional lateral cephalograms and CSLCs found no significant differences in most landmarks and in the majority of linear and angular measurements.21–23 Minor statistical variations observed in a few landmarks and measurements were not clinically significant.21,24 These findings indicate that CSLCs offer diagnostic accuracy and reproducibility comparable to conventional lateral cephalograms.
Data Processing and Deep Learning Model Training Strategy
Data were labeled by group, with 1 assigned to the OSA group and 0 to the control group. The dataset was randomly divided into training, validation, and test sets in a 64%, 16%, and 20% ratio, respectively. The training set was used for model training, the validation set for CNN hyperparameter tuning, and the test set for final performance evaluation and model explainability analysis. For image preprocessing, frontal facial photographs were cropped, uniformly resized to 224×224 pixels, and normalized (Figure 2A). Lateral facial images and cephalograms were manually segmented into distinct anatomical regions for partitioned recognition, resulting in six regions for facial images and four for cephalograms (Figure 2A and Table 1).
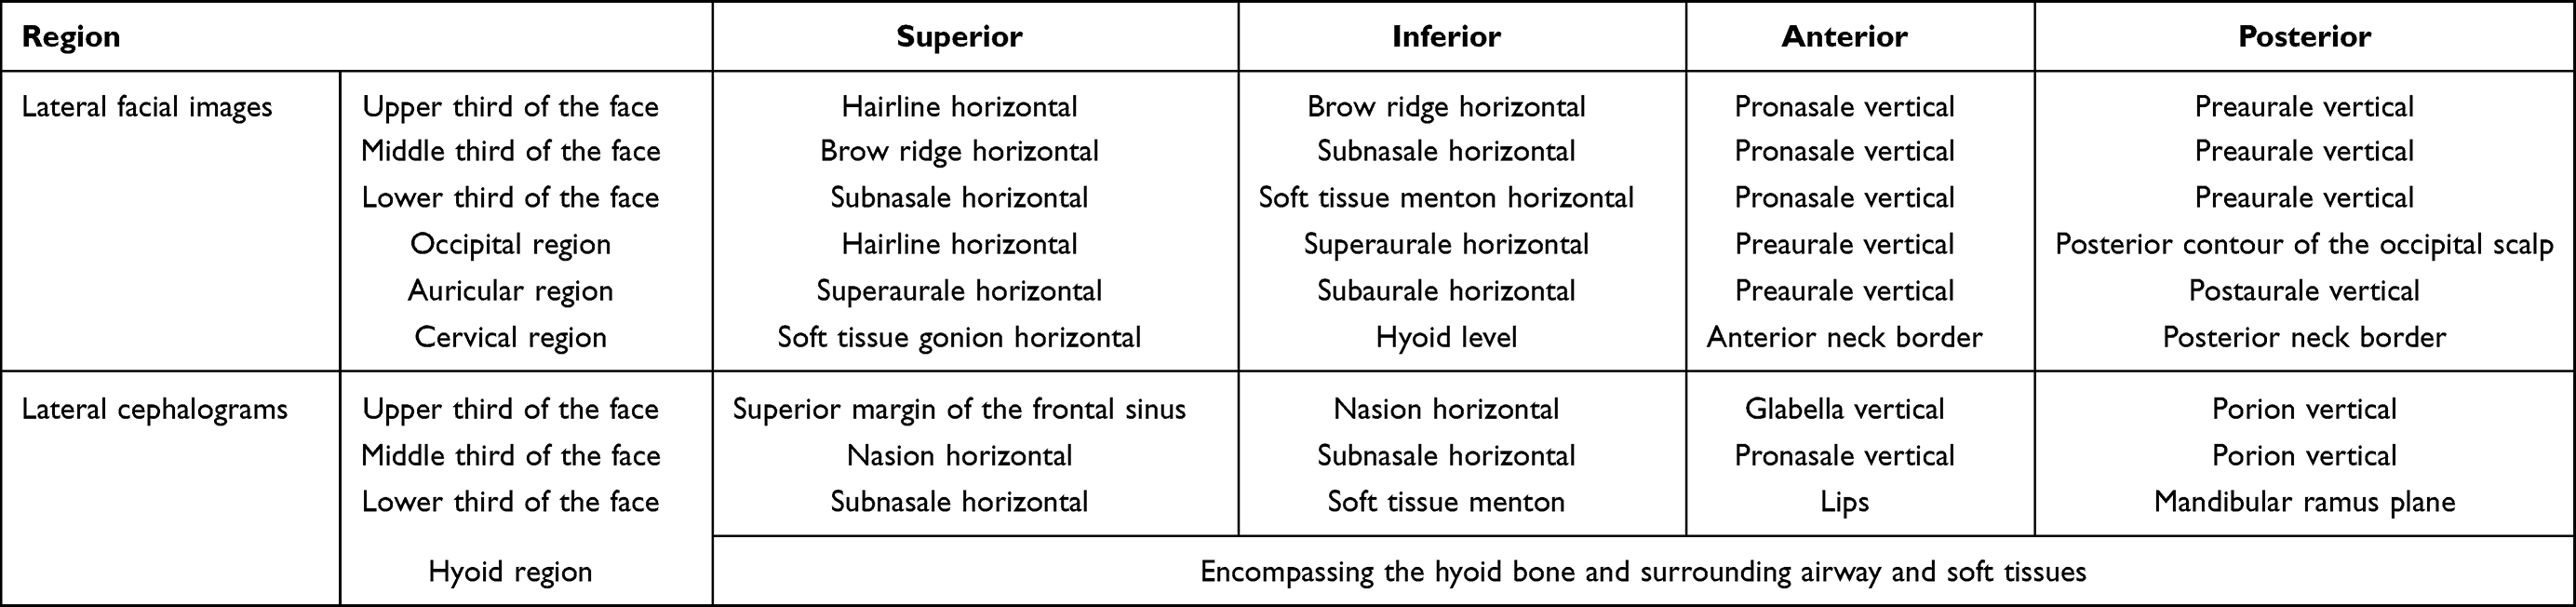 |
Table 1 Partitioned Recognition of Lateral Facial Images and Lateral Cephalograms |
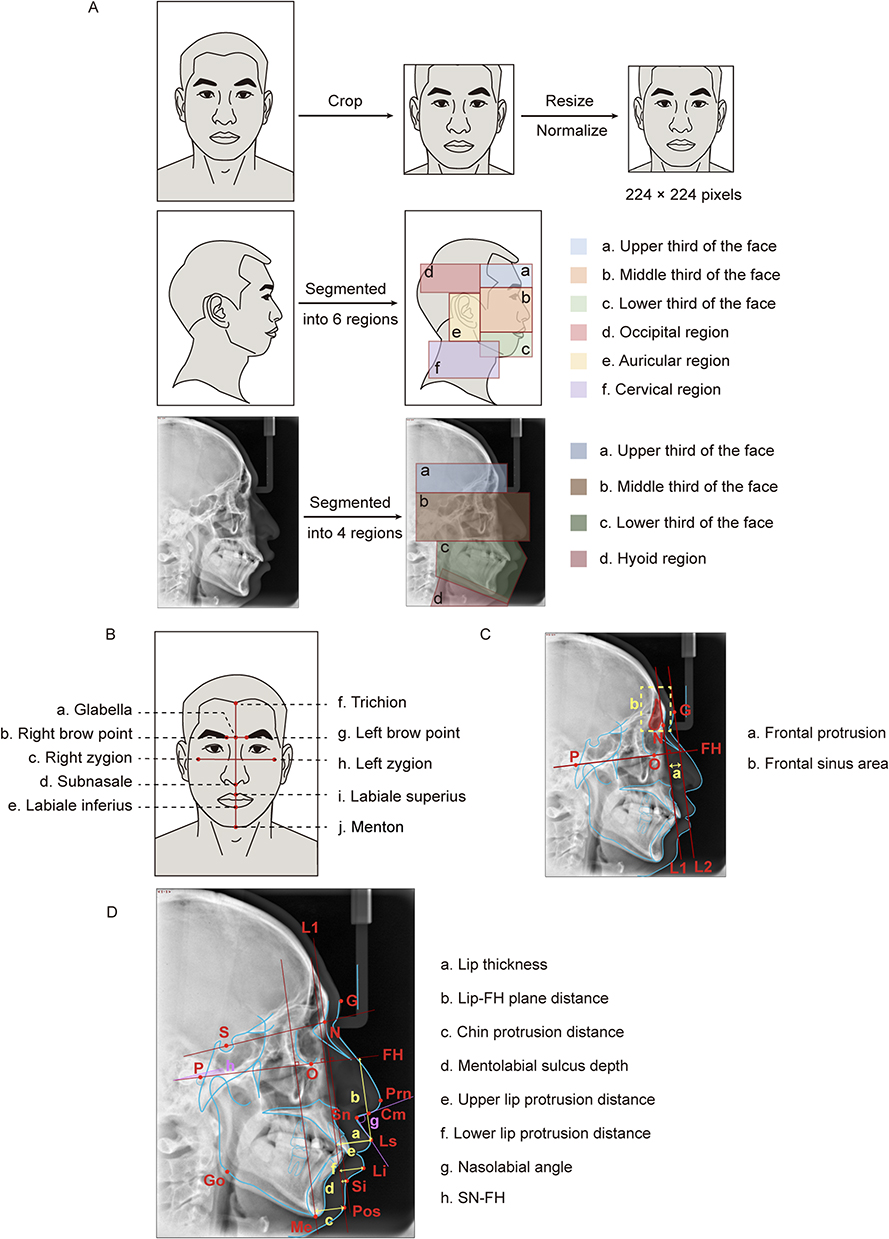 |
Figure 2 Illustration of data preprocessing and measurement analysis. (A) Preprocessing and segmentation of frontal facial images, lateral facial images, and lateral cephalograms including cone beam computed tomography (CBCT)-synthesized lateral cephalogram. (B) Measurement landmarks of frontal facial images. (C) Quantification of frontal protrusion and frontal sinus area on lateral cephalograms. L1 and L2 represent lines perpendicular to the FH plane passing through the nasion and glabella, respectively. (D) Measurement landmarks of the lip-chin region on lateral cephalograms. Yellow lables indicate linear measurements, while purple lables indicate angular measurements. Abbreviations: G, glabella; N, nasion; P, porion; O, orbitale; S, sella; Go, gonion; Me, menton; Prn, pronasale; Cm, columella point; Sn, subnasale; Ls, labrale superius; Li, labiale inferius; Si, sulcus inferius; Pos, pogonion of soft tissue; FH, Frankfort horizontal plane; SN, sella-nasion plane. |
For the classification task, a multimodal DL model was developed to integrate image and clinical data. The image-processing branch utilized a pre-trained GoogLeNet backbone through transfer learning;25–27 while the numerical branch processed clinical variables via a fully connected network (FCN). The extracted features from both branches were concatenated and fed into a decision network to generate the final binary classification output.
The model was trained for 50 epochs (batch size 8) using an Adam optimizer and cross-entropy loss. The learning rate was fixed at 0.0003. Model performance on the test set was evaluated by accuracy, precision, sensitivity (recall), specificity, and AUC.
Model Explainability Analysis
A multi-faceted model explainability analysis was conducted to visualize the model’s prediction process. First, to evaluate the relative importance of each modality and feature, the feature importance analysis was performed using the feature ablation strategy. Specifically, each feature in the test set was individually zeroed out, and the absolute difference between the initial model outputs and ablated outputs served as its feature importance score. This procedure was repeated across all features to produce a ranked list reflecting their contribution to prediction. Additionally, a heat map was generated using Gradient-weighted Class Activation Mapping (Grad-CAM),28 which visually highlighted the regions most influential for the OSA classification.
To examine the facial features captured by the DL model, the average face analysis was performed on the model-predicted OSA group and the model-predicted control group. For each group, an average face was generated based on 68 facial landmarks automatically extracted using Dlib. This method was derived from our previously optimized model for automated disease diagnosis from facial images.29 These average faces were quantitatively compared through geometric and texture overlay analyses. The geometric overlay analysis quantified shape deviation via Euclidean distance between corresponding landmarks; while the texture overlay analysis highlighted textural variations (eg., brightness, color, and fine texture) through pixel-wise difference heatmaps.
Measurement Analysis
The measurement analysis of facial images and lateral cephalograms was conducted using Image J (version 1.54, USA) by a single experienced orthodontist. To ensure scale invariance, the facial measurements were converted to ratios by normalizing against the facial height, including inter-eyebrow distance, facial width, lower lip–chin distance, lip thickness, and mid-facial length (Figure 2B and Table 2).
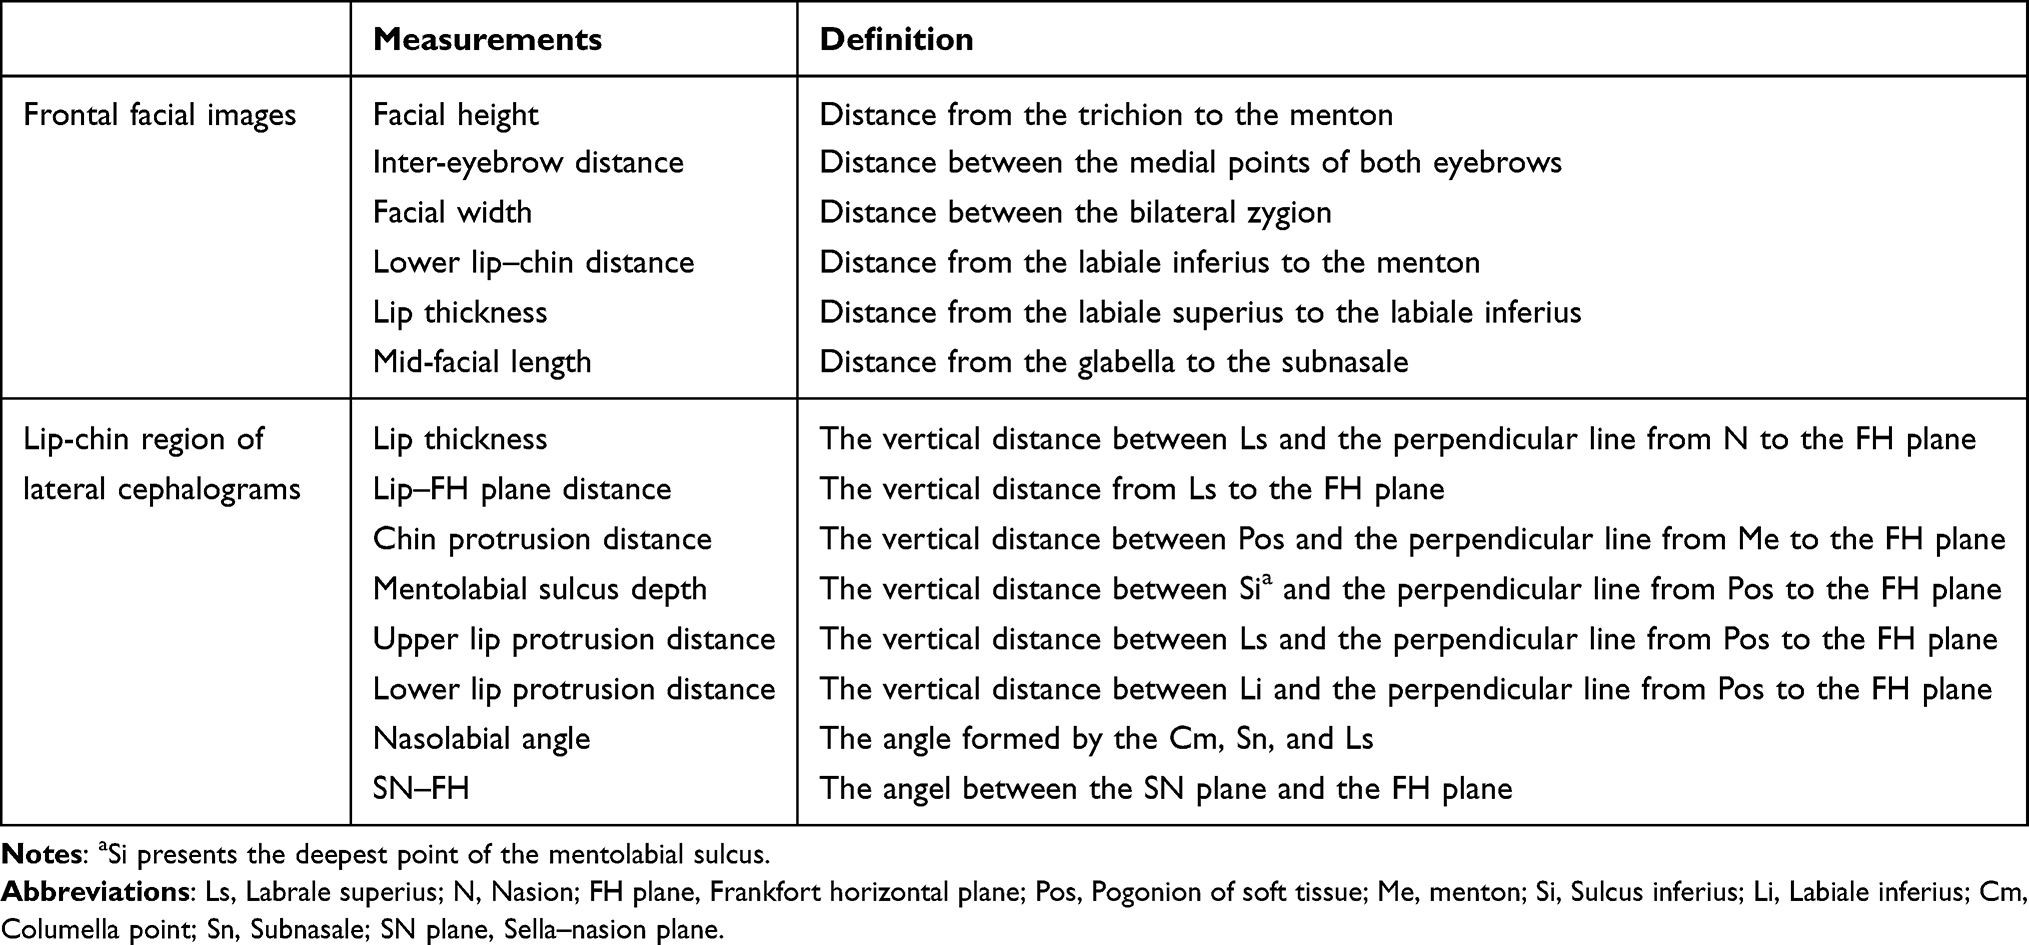 |
Table 2 Measurements on Frontal Facial Images and Lip-Chin Region of Lateral Cephalograms |
The analysis of lateral cephalograms focused on the frontal region and the lip-chin region. Frontal measurements were based on the methods of Zheng et al and included forehead protrusion and frontal sinus area30 The former was defined as the distance between two lines perpendicular to the FH plane: L1 at the nasion and L2 at the glabella, the most prominent point of the soft-tissue forehead (Figure 2C). The latter was defined as the area of the manually delineated frontal sinus on the radiograph (Figure 2C). For the lip-chin region, the analysis included lip thickness, lip–FH plane distance, chin protrusion distance, mentolabial sulcus depth, upper and lower lip protrusion distances, nasolabial angle, and the SN–FH angle (the angle between the sella–nasion plane and the FH plane), as detailed in Figure 2D and Table 2.
Statistical Analysis
Statistical analysis were performed in SPSS (version 27.0, IBM). Normality was assessed using the Kolmogorov–Smirnov test. Continuous variables are presented as mean ± standard deviation for normally distributed data and as median (interquartile range) for non-normally distributed data. Between-group comparisons were performed using independent-samples t-tests when groups satisfying normality and homoscedasticity; otherwise, Wilcoxon rank-sum tests were applied. A p-value less than 0.05 was considered statistically significant.
Results
The trained DL model achieved an accuracy of 87.0%, precision of 87.5%, sensitivity of 93.3%, specificity of 75.0%, and an AUC of 0.87 for OSA classification on the test dataset (Figure 3A), indicating reliable performance for subsequent explainabiltiy analysis.
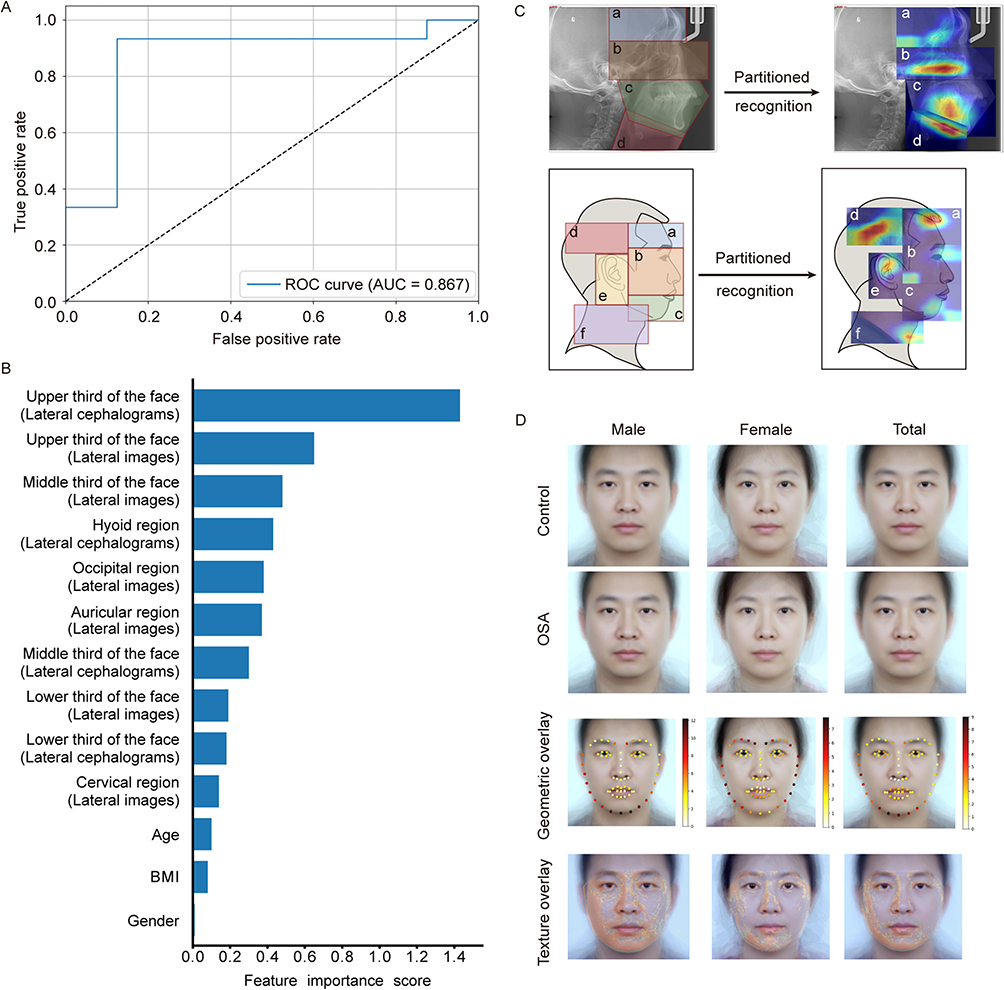 |
Figure 3 Model classification performance and explainability analysis results. (A) Receiver operating characteristic (ROC) curves of the deep learning model. (B) Feature importance ranking across different input modalities. (C) Representative Gradient-weighted Class Activation Mapping (Grad-CAM) heatmaps visualizing discriminative regions for OSA classification in lateral facial images and lateral cephalograms. Warmer colors (red or yellow) indicate regions with higher contribution to the model’s prediction. (D) Average face analysis. Average faces were generated for the OSA and control groups, stratified by sex (male, female, and total). The color maps of the average face geometric overlay analysis reflect the magnitude of geometric deviation, with low deviation values encoded as bright white or yellow and higher deviations represented by increasingly warm colors, from red to near-black. Areas exhibiting the most intense warm colors highlight regions with pronounced geometric differences. The color maps of the average face texture overlay analysis reflect the magnitude of morphological differences, ranging from blue (minimal) to red (maximal). Abbreviation: AUC, the area under the ROC curve. |
XAI Identified Predictive Craniofacial Regions Driving OSA Classification
Feature importance analysis was first conducted to identify the primary predictive factors (Figure 3B). The upper third of the face in lateral cephalograms emerged as the most influential input for prediction (importance score = 1.43), substantially outweighing all other regions and traditional clinical variables. Within the cephalometric modality, importance scores sharply dropped beyond this region, with the hyoid area ranking a distant second (score = 0.43), followed by middle third of the face (score = 0.3) and lower third of the face (score = 0.18). In contrast, importance scores in lateral images were more evenly distributed, including the upper and middle thirds of the face (scores = 0.65 and 0.48, respectively), the occipital (score = 0.38), and auricular regions (score = 0.37). Clinical variables such as age, BMI, and sex made only minor contributions to the classification.
Grad-CAM further localized the craniofacial regions that the model relied on during prediction (Figure 3C). In lateral cephalograms, high activation was primarily concentrated in the hyoid region, middle third of the face, posterior mandibular teeth region, and mandibular body, with additional activation around the frontal sinus and chin region. In lateral images, prominent activation appeared in the forehead, occipital region, anterior cervical contour, accompanied by secondary activation in the auricular region and eyes (particularly the upper eyelids).
Average Face Analysis Further Visualized DL-Identifed Morphological Deviations
To complement these findings, average faces were generated within the model-predicted OSA and control groups across gender (male, female, overall) (Figure 3D). Geometric overlay analysis of these average faces revealed distinct group differences mainly in the brow, mandible, and chin regions, consistent with the feature importance and Grad-CAM findings that emphasized the upper and lower third of the face. These variations were sex-specific: in males, the most pronounced differences appeared in the chin area; whereas in females, differences were most evident in the brow region and facial contour. Further texture overlay analysis corroborated these observations at the pixel level, showing that differences were predominantly located along the facial contour, mandible, brow, and upper eyelids. The shaded regions indicating morphological differences were more extensive in males than in females.
Targeted Measurements Validated AI-Driven Craniofacial Features
To validate these AI-identified regions, targeted manual measurements were performed in lateral cephalograms and frontal facial images (Table 3). Cephalometric measurements focused on the upper face (especially the forehead) and lip-chin region. In the upper face, patients with OSA exhibited significantly greater frontal protrusion (p < 0.001) and a larger frontal sinus area (249.49 ± 81.79 vs. 189.02 ± 97.18 for controls, p < 0.001). In the lip-chin region, the OSA group was characterized by a more retruded chin (p < 0.001), a greater lip–FH plane distance (p = 0.002), a deeper mentolabial sulcus (p = 0.006), and a more prominent upper lip (p = 0.001) compared with controls. In contrast, no significant differences were found for other conventional metrics such as lip thickness, nasolabial angle, lower lip protrusion, and the SN–FH angle.
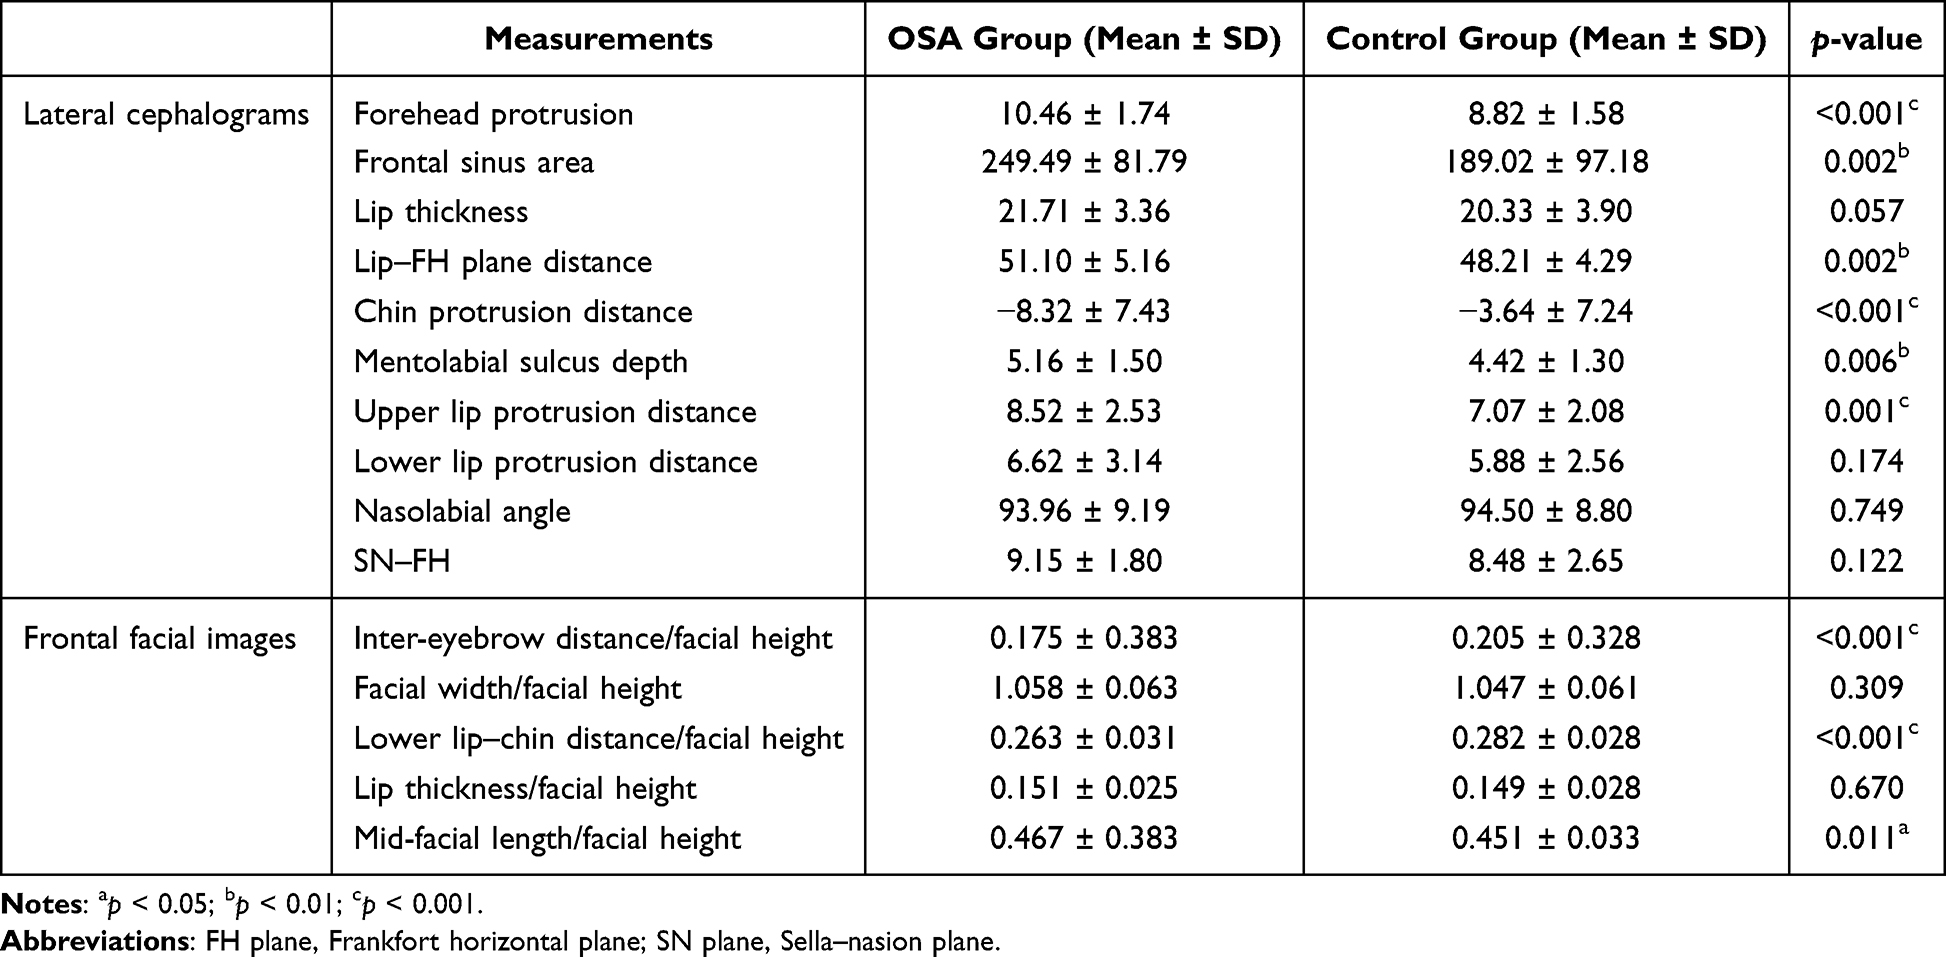 |
Table 3 Measurement Analysis in Lateral Cephalograms and Frontal Facial Images Between the OSA Group and the Control Group |
The results of facial measurements were shown in Table 3. Compared with controls, subjects in OSA group exhibited a significantly smaller inter-eyebrow distance ratio (0.175 ± 0.383 vs. 0.205 ± 0.328, p < 0.001), a reduced lower lip–chin distance ratio (0.263 ± 0.031 vs. 0.282 ± 0.028, p < 0.001), and a larger mid-facial length ratio (0.467 ± 0.383 vs. 0.451 ± 0.033, p < 0.05). No significant differences were observed in the facial width ratio or lip thickness.
Discussion
The Clinical Relevance of XAI
This study proposed an explainable DL-based framework for exploring craniofacial features in OSA. Importantly, the significance of our work lies not only in interpreting the black-box DL model, but also in translating model predictions into clinically understandable and verifiable imaging cues. Through XAI, we identified previously under-recognized regions relevant to OSA. Our strictly age- and sex-matched design minimized related morphological confounders and strengthened the specificity of the identified features.
Recently, XAI-driven clinical feature discovery is gaining attention across medicine. In sleep research, explainable DL highlighted overlooked electrocardiogram (ECG) waveforms31 and identified novel electroencephalogram (EEG) patterns not incorporated into AASM sleep-stage scoring rules.32 In other fields, similar approaches have revealed atypical but meaningful features, including weakly correlated skin microbes,33 previously overlooked risk factors for heart failure,34 and subtle motor control features predictive of cognitive decline.35 Our work echoes this trend, supporting the value of explainable DL-driven cues for extending disease phenotyping.
Predictive Performance of the Craniofacial Image-Based DL Model
Across multiple XAI techniques, the DL model consistently identified classic craniofacial regions implicated in OSA, particularly the mandible and lip-chin area, consistent with prior DL studies.16,36 Targeted quantitative measurements confirmed a smaller lower lip-chin distance ratio, a significantly retruded chin, and a deeper mentolabial sulcus in OSA (Table 3). These structural deviations aligned with prior reports of mandibular retrusion,4,37,38 indicating that the model successfully captured typical and clinically meaningful anatomical features analogous to human expert assessment.
Although the DL model demonstrated high sensitivity (93.3%) for OSA classification, its specificity was relatively modest (75.0%), supporting the view that image-based DL models were better suited for screening than for replacing PSG as the diagnostic gold standard.36 We argue that this modest specificity may be related to the multifactorial etiology of OSA. Given that OSA involves functional and neuromuscular mechanisms in addition to anatomical factors,39 predictions relying solely on craniofacial morphology remain inherently limited. Furthermore, by comprehensively extracting morphological information, the DL model may identify subtle or atypical craniofacial risk patterns. In other words, individuals exhibiting these facial patterns might be classified as positives by the model, yet be considered negatives under PSG standards.
Explainable DL-Driven Expansion of Craniofacial Phenotypes in OSA
A major contribution of this study is that XAI enabled OSA craniofacial phenotyping to move beyond conventional morphological assessment. Previous OSA phenotyping studies typically selected measurements based on predefined anatomical hypotheses. For instance, investigations of obese individuals with OSA often prioritized upper airway dimensions and local soft tissues;40,41 whereas cephalometric analysis adapted from orthodontics emphasized sagittal skeletal relationships and the lower third of the face.3,42,43 Even attempts to increase the number of landmarks were constrained by manually defined metrics, which may not fully cover the complex OSA-related craniofacial morphology.44 Prediction models relying on these parameters exhibited limited accuracy across populations,45,46 further suggesting that current assessments of OSA-related craniofacial features remain incomplete.
In contrast, XAI offers a data-driven perspective that is not confined to predefined anatomical assumptions. In our study, beyond the lower-face structures, XAI revealed consistent attention to previously under-recognized regions, particularly the upper third of the face. Measurement analysis validated the significance of these AI-based cues: compared with controls, OSA patients exhibited a reduced inter-eyebrow distance ratio, alongside increased frontal protrusion and frontal sinus area (Table 3). Although the upper-face region is less easily modifiable than the lower third of the face, it may provide phenotypic markers to delineate anatomical subtypes, guide targeted non-invasive screening, and offer morphological clues for pathogenesis.
The model also highlighted the upper eyelid, facial contours, auricular, and occipital regions. While we did not quantify these areas due to a lack of well-defined metrics, previous OSA-related DL studies supported their involvement. Tsuiki et al reported that their DL model achieved an AUC of 070 when relying exclusively on the partial occipital region47 and He et al demonstrated the predictive contributions of the ocular, nasal, and auricular regions via photographic occlusion tests.15 Taken together, these findings suggest that the anatomical phenotype of OSA is a complex manifestation involving multiple regions.
Limitation
This study has several limitations that should be acknowledged. First, the sample size was relatively modest, constrained by the difficulty of recruiting sex- and age-matched participants. Although the transfer learning strategy was utilized, the model’s performance would undoubtedly benefit from a larger and more diverse dataset. Second, since the study included only Chinese participants, the findings may not generalize to other ethnic groups. Third, although no evidence of OSA was detected among controls at the time of assessment, younger participants may still develop OSA later in life. As OSA prevalence increases with age, such potential misclassification could have attenuated group differences and influenced the model’s feature learning. Finally, participants with unclear visualization of craniofacial landmarks on lateral cephalograms were excluded from the explainability and measurement analyses, which may introduce potential selection bias toward better-quality images. Future studies with larger, independent, and ethnically diverse cohorts, including external validation, are needed to confirm the robustness and generalizability of the present findings.
Conclusion
Our research presents an AI-driven strategy to explore craniofacial phenotypes in OSA. By combining multiple explainable DL approaches with targeted measurements, we identified and validated previously under-recognized craniofacial features relevant to OSA classification, expanding OSA-related morphology beyond the lower third of the face to the upper face. These findings demonstrate the value of XAI not only for model interpretation but also for image-based feature discovery and the expansion of disease phenotypes. Although the identified upper-face structures are not readily modifiable, they may still have clinical value for OSA risk stratification and subtype classification. Future studies are needed to validate these upper-face traits in larger cohorts and clarify their role in OSA pathogenesis.
Abbreviations
OSA, Obstructive sleep apnea; DL, Deep learning; CNNs, Convolutional neural networks; ROC, Receiver operating characteristic; AUC, Area under the ROC curve; XAI, Explainable artificial intelligence; CBCT, Cone beam computed tomography; BMI, Body mass index; PSG, Polysomnography; AASM, American Academy of Sleep Medicine; AHI, Apnea-hypopnea index; FH plane, Frankfort horizontal plane; CSLCs, CBCT-synthesized lateral cephalograms; FCN, Fully connected network; Grad-CAM, Gradient-weighted Class Activation Mapping; ECG, Electrocardiogram; EEG, Electroencephalogram.
Data Sharing Statement
The data that support the findings of this study are not publicly available due to privacy concerns but are available from the corresponding author upon reasonable request.
Ethics Approval and Informed Consent
This study was conducted in accordance with the Declaration of Helsinki and was approved by the ethics committee of Peking University Hospital of Stomatology (PKUSSIRB-202388087). Written informed consent was obtained from all individual participants included in the study.
Acknowledgments
We would like to thank all the participants in the study.
Author Contributions
Corresponding authors: Qing Wang and Xuemei Gao contributed equally to this work.
L.Y.L.: Conceptualization, formal analysis, investigation, methodology, project administration, visualization, writing – original draft; R.C.Y.: Conceptualization, formal analysis, investigation, methodology, project administration, visualization; Z.T.P.: Data curation, investigation, methodology, software, validation, visualization; M.Y.: Formal analysis, funding acquisition, methodology, validation, writing – review and editing; X.G.: Formal analysis, investigation, validation; Y.L.: Data curation, software, validation; Q.W.: Data curation, methodology, resources, supervision, validation, visualization, writing – review and editing; X.M.G.: Conceptualization; formal analysis, funding acquisition, methodology, project administration, resources, supervision, validation, visualization, writing – review and editing. All authors gave final approval of the version to be published; have agreed on the journal to which the article has been submitted; and agree to be accountable for all aspects of the work.
Funding
This study was funded by the National Natural Science Foundation of China (82170102 and 82570125), Beijing Municipal Natural Science Foundation (L192068), Clinical Research Foundation of Peking University School and Hospital of Stomatology (PKUSS-2023CRF203), and Hainan Province Health Science and Technology Innovation Joint Project, Youth Project (WSJK2025QN021).
Disclosure
The authors declare no conflicts of interest in the reporting of this work.
References
1. Jordan AS, McSharry DG, Malhotra A. Adult obstructive sleep apnoea. Lancet. 2014;383(9918):736–14. doi:10.1016/S0140-6736(13)60734-5
2. Lv R, Liu X, Zhang Y, et al. Pathophysiological mechanisms and therapeutic approaches in obstructive sleep apnea syndrome. Signal Transduct Target Ther. 2023;8(1):218. doi:10.1038/s41392-023-01496-3
3. Neelapu BC, Kharbanda OP, Sardana HK, et al. Craniofacial and upper airway morphology in adult obstructive sleep apnea patients: a systematic review and meta-analysis of cephalometric studies. Sleep Med Rev. 2017;31:79–90. doi:10.1016/j.smrv.2016.01.007
4. Lee RWW, Chan ASL, Grunstein RR, Cistulli PA. Craniofacial phenotyping in obstructive sleep apnea--a novel quantitative photographic approach. Sleep. 2009;32(1):37–45.
5. McNicholas WT, Pevernagie D. Obstructive sleep apnea: transition from pathophysiology to an integrative disease model. J Sleep Res. 2022;31(4):e13616. doi:10.1111/jsr.13616
6. Hartfield PJ, Janczy J, Sharma A, et al. Anatomical determinants of upper airway collapsibility in obstructive sleep apnea: a systematic review and meta-analysis. Sleep Med Rev. 2023;68:101741. doi:10.1016/j.smrv.2022.101741
7. Sutherland K, Lee RICHARDWW, Cistulli PA. Obesity and craniofacial structure as risk factors for obstructive sleep apnoea: impact of ethnicity. Respirology. 2012;17(2):213–222. doi:10.1111/j.1440-1843.2011.02082.x
8. Lee RWW, Vasudavan S, Hui DS, et al. Differences in craniofacial structures and obesity in caucasian and chinese patients with obstructive sleep apnea. Sleep. 2010;33(8):1075–1080. doi:10.1093/sleep/33.8.1075
9. Hanif U, Leary EB, Schneider LD, et al. Estimation of apnea-hypopnea index using deep learning on 3-D craniofacial scans. IEEE J Biomed Health Inform. 2021;25(11):4185–4194. doi:10.1109/JBHI.2021.3078127
10. He S, Su H, Li Y, Xu W, Wang X, Han D. Detecting obstructive sleep apnea by craniofacial image–based deep learning. Sleep Breathing. 2022;26(4):1885–1895. doi:10.1007/s11325-022-02571-9
11. Gao EY, Tan BKJ, Tan NKW, et al. Artificial intelligence facial recognition of obstructive sleep apnea: a bayesian meta-analysis. Sleep Breathing. 2025;29(1):36. doi:10.1007/s11325-024-03173-3
12. Park J-Y, Shin H-R, Kim MH, et al. A novel machine learning model for screening the risk of obstructive sleep apnea using craniofacial photography with questionnaires. J Clin Sleep Med. 2025;21(5):843–854. doi:10.5664/jcsm.11560
13. Gurovich Y, Hanani Y, Bar O, et al. Identifying facial phenotypes of genetic disorders using deep learning. Nat Med. 2019;25(1):60–64. doi:10.1038/s41591-018-0279-0
14. Hassija V, Chamola V, Mahapatra A, et al. Interpreting black-box models: a review on explainable artificial intelligence. Cogn Comput. 2024;16(1):45–74. doi:10.1007/s12559-023-10179-8
15. He S, Li Y, Zhang C, et al. Deep learning technique to detect craniofacial anatomical abnormalities concentrated on middle and anterior of face in patients with sleep apnea. Sleep Med. 2023;112:12–20. doi:10.1016/j.sleep.2023.09.025
16. Kim M-J, Jeong J, Lee J-W, et al. Screening obstructive sleep apnea patients via deep learning of knowledge distillation in the lateral cephalogram. Sci Rep. 2023;13(1):17788. doi:10.1038/s41598-023-42880-x
17. Ludwig J, Mullainathan S. Machine learning as a tool for hypothesis generation. Quart J Econo. 2024;139(2):751–827. doi:10.1093/qje/qjad055
18. Delavari P, Ozturan G, Yuan L, Yilmaz Ö, Oruc I, Reis R. Artificial intelligence, explainability, and the scientific method: a proof-of-concept study on novel retinal biomarker discovery. PNAS Nexus. 2023;2(9):1–14. doi:10.1093/pnasnexus/pgad290
19. Obuchowski NA, McClish DK. Sample size determination for diagnostic accuracy studies involving binormal roc curve indices. Stat Med. 1997;16(13):1529–1542. doi:10.1002/(SICI)1097-0258(19970715)16:13<1529::AID-SIM565>3.0.CO;2-H
20. Berry RB, Budhiraja R, Gottlieb DJ, et al. Rules for scoring respiratory events in sleep: update of the 2007 aasm manual for the scoring of sleep and associated events. deliberations of the sleep apnea definitions task force of the American academy of sleep medicine. J Clin Sleep Med. 2012;8(5):597–619. doi:10.5664/jcsm.2172
21. Grauer D, Cevidanes LSH, Styner MA, et al. Accuracy and landmark error calculation using cone-beam computed tomography–generated cephalograms. Angle Orthod. 2010;80(2):286–294. doi:10.2319/030909-135.1
22. Cattaneo PM, Bloch CB, Calmar D, Hjortshøj M, Melsen B. Comparison between conventional and cone-beam computed tomography–generated cephalograms. Am J Orthod Dentofacial Orthop. 2008;134(6):798–802. doi:10.1016/j.ajodo.2008.07.008
23. Park C-S, Park J-K, Kim H, Han -S-S, Jeong H-G, Park H. Comparison of conventional lateral cephalograms with corresponding cbct radiographs. Imaging Sci Dentistry. 2012;42(4):201–205. doi:10.5624/isd.2012.42.4.201
24. Raj G, Raj M, Saigo L. Accuracy of Conventional versus cone-beam Ct-synthesised lateral cephalograms for cephalometric analysis: a systematic review. J Orthod. 2024;51(2):160–176. doi:10.1177/14653125231178038
25. Szegedy C, Liu W, Jia Y, et al.
26. Morid MA, Borjali A, Del Fiol G. A scoping review of transfer learning research on medical image analysis using imagenet. Comput Biol Med. 2021;128:104115. doi:10.1016/j.compbiomed.2020.104115
27. Tajbakhsh N, Shin JY, Gurudu SR, et al. Convolutional neural networks for medical image analysis: full training or fine tuning? IEEE Trans Med Imaging. 2016;35(5):1299–1312. doi:10.1109/TMI.2016.2535302
28. Selvaraju RR, Cogswell M, Das A, Vedantam R, Parikh D, Batra D. Grad-cam: visual explanations from deep networks via gradient-based localization. Int J Comput Vis. 2020;128(2):336–359. doi:10.1007/s11263-019-01228-7
29. Song W, Lei Y, Chen S, et al. Multiple facial image features-based recognition for the automatic diagnosis of turner syndrome. Comput Ind. 2018;100:85–95. doi:10.1016/j.compind.2018.03.021
30. Zheng X, Ding S, Mei Q, et al. A cross-sectional study: correlation of forehead morphology and dentoskeletal malocclusion in Chinese people. BMC Oral Health. 2024;24(1):50. doi:10.1186/s12903-023-03795-1
31. Garcia-Vicente C, Gutierrez-Tobal GC, Vaquerizo-Villar F, Martin-Montero A, Gozal D, Hornero R. Sleepecg-net: explainable deep learning approach with ecg for pediatric sleep apnea diagnosis. IEEE J Biomed Health Inform. 2025;29(2):1021–1034. doi:10.1109/JBHI.2024.3495975
32. Vaquerizo-Villar F, Gutiérrez-Tobal GC, Calvo E, et al. An explainable deep-learning model to stage sleep states in children and propose novel eeg-related patterns in sleep apnea. Comput Biol Med. 2023;165:107419. doi:10.1016/j.compbiomed.2023.107419
33. Carrieri AP, Haiminen N, Maudsley-Barton S, et al. Explainable Ai reveals changes in skin microbiome composition linked to phenotypic differences. Sci Rep. 2021;11(1):4565. doi:10.1038/s41598-021-83922-6
34. Rao S, Li Y, Ramakrishnan R, et al. An explainable transformer-based deep learning model for the prediction of incident heart failure. IEEE J Biomed Health Inform. 2022;26(7):3362–3372. doi:10.1109/JBHI.2022.3148820
35. Tasaki S, Kim N, Truty T, et al. Explainable deep learning approach for extracting cognitive features from hand-drawn images of intersecting pentagons. NPJ Digital Medicine. 2023;6(1):157. doi:10.1038/s41746-023-00904-w
36. Jeong H-G, Kim T, Hong JE, et al. Automated deep neural network analysis of lateral cephalogram data can aid in detecting obstructive sleep apnea. J Clin Sleep Med. 2023;19(2):327–337. doi:10.5664/jcsm.10258
37. Sutherland K, Schwab RJ, Maislin G, et al. Facial phenotyping by quantitative photography reflects craniofacial morphology measured on magnetic resonance imaging in icelandic sleep apnea patients. Sleep. 2014;37(5):959–968. doi:10.5665/sleep.3670
38. Ardehali MM, Zarch VV, Joibari M-E, Kouhi A. Cephalometric assessment of upper airway effects on craniofacial morphology. J Craniofac Surg. 2016;27(2):361–364. doi:10.1097/SCS.0000000000002388
39. Eckert DJ. Phenotypic approaches to obstructive sleep apnoea – new pathways for targeted therapy. Sleep Med Rev. 2018;37:45–59. doi:10.1016/j.smrv.2016.12.003
40. Huang L, Gao X. The interaction of obesity and craniofacial deformity in obstructive sleep apnea. Dentomaxillofac Radiol. 2021;50(4):20200425. doi:10.1259/dmfr.20200425
41. Xia L, Jiang W, Yao K, Sun H, Lu X, Yu W. Craniofacial, dental, and upper airway morphologic features of severely obese adults with obstructive sleep apnea. Int Dental J. 2025;75(3):1736–1744. doi:10.1016/j.identj.2025.02.021
42. Bertuzzi F, Santagostini A, Pollis M, Meola F, Segù M. The interaction of craniofacial morphology and body mass index in obstructive sleep apnea. Dentistry J. 2022;10(7):136. doi:10.3390/dj10070136
43. Doğru yuvarlakbaş S, Boyan N, Kuleci S, Balli HT. Anatomic changes of patients with obstructive sleep apnea syndrome at different stages. J Craniofac Surg. 2025;36(4):1254–1257. doi:10.1097/SCS.0000000000011053
44. Vidigal TA, Haddad FLM, Guimaraes TM, et al. Can intraoral and facial photos predict obstructive sleep apnea in the general and clinical population? Sleep. 2024;47(3):zsad307. doi:10.1093/sleep/zsad307
45. Sutherland K, Lee RWW, Petocz P, et al. Craniofacial phenotyping for prediction of obstructive sleep apnoea in a chinese population. Respirology. 2016;21(6):1118–1125. doi:10.1111/resp.12792
46. Lee RWW, Petocz P, Prvan T, Chan ASL, Grunstein RR, Cistulli PA. Prediction of obstructive sleep apnea with craniofacial photographic analysis. Sleep. 2009;32(1):46–52.
47. Tsuiki S, Nagaoka T, Fukuda T, et al. Machine learning for image-based detection of patients with obstructive sleep apnea: an exploratory study. Sleep Breathing. 2021;25(4):2297–2305. doi:10.1007/s11325-021-02301-7
 © 2026 The Author(s). This work is published and licensed by Dove Medical Press Limited. The
full terms of this license are available at https://www.dovepress.com/terms
and incorporate the Creative Commons Attribution
- Non Commercial (unported, 4.0) License.
By accessing the work you hereby accept the Terms. Non-commercial uses of the work are permitted
without any further permission from Dove Medical Press Limited, provided the work is properly
attributed. For permission for commercial use of this work, please see paragraphs 4.2 and 5 of our Terms.
© 2026 The Author(s). This work is published and licensed by Dove Medical Press Limited. The
full terms of this license are available at https://www.dovepress.com/terms
and incorporate the Creative Commons Attribution
- Non Commercial (unported, 4.0) License.
By accessing the work you hereby accept the Terms. Non-commercial uses of the work are permitted
without any further permission from Dove Medical Press Limited, provided the work is properly
attributed. For permission for commercial use of this work, please see paragraphs 4.2 and 5 of our Terms.
Recommended articles
Applications of Artificial Intelligence in Cataract Surgery: A Review
Ahuja AS, Paredes III AA, Eisel ML, Kodwani S, Wagner IV, Miller DD, Dorairaj S
Clinical Ophthalmology 2024, 18:2969-2975
Published Date: 17 October 2024