Back to Journals » Clinical Optometry » Volume 13
An Evaluation of the Agreement Between a Computerized Stereoscopic Game Test and the TNO Stereoacuity Test
Authors Portela-Camino JA ![]() , Martín-González S, Ruiz-Alcocer J, Illarramendi-Mendicute I, Garrido-Mercado R
, Martín-González S, Ruiz-Alcocer J, Illarramendi-Mendicute I, Garrido-Mercado R
Received 4 March 2021
Accepted for publication 15 June 2021
Published 5 July 2021 Volume 2021:13 Pages 181—190
DOI https://doi.org/10.2147/OPTO.S308445
Checked for plagiarism Yes
Review by Single anonymous peer review
Peer reviewer comments 3
Editor who approved publication: Mr Simon Berry
Supplementary video of "New Computerized Stereoscopic Game test" [ID 308445].
Views: 576
Juan Antonio Portela-Camino,1 Santiago Martín-González,2 Javier Ruiz-Alcocer,3 Igor Illarramendi-Mendicute,4 Rafaela Garrido-Mercado3
1Department of Optometry, Begira Clinic, Bilbao, Spain; 2Department of Construction and Manufacturing Engineering, University of Oviedo, Oviedo, Asturias, Spain; 3Department of Optometry and Vision Science, Complutense University of Madrid, Madrid, Spain; 4Department of Optometry, Begitek Clinic, Donostia, Spain
Correspondence: Juan Antonio Portela-Camino
Department of Optometry, Begira Clinic, C/ Ibáñez de Bilbao, nº 10, Bilbao, 48001, Bizkaia, Spain
Tel +34 94 605 39 67
Email [email protected]
Purpose: Stereo-anomaly is commonly associated with amblyopia. An investigation was conducted to determine whether the measurements of stereoacuity obtained with the stereoacuity reference test (TNO Test) show an agreement with a computer stereoscope video game.
Methods: Thirty-two subjects (mean age 9.37± 2.00 years) with an amblyopia history were selected for a blind and randomized study of stereoacuity improvement through a new random dot game. A masked examiner measured the stereoacuity three times per subject using the TNO test (at the beginning, at the end and after 6 months of the treatment). A second masked examiner measured stereoacuity using the new computerized game after the TNO masked evaluation.
Results: The Pearson’s correlation coefficient one test against the other was r2 = 0.767 and the Bland–Altman plot was r2= 0.069 (mean difference − 0.03 log sec). Using three categories: poor (840– 300 seconds of arc), coarse (480– 210 seconds of arc) and moderate–fine stereoacuity (210– 30 seconds of arc). Positive predictive values were 89.5% for moderate–fine; 72.7% for coarse; and 90.0% for poor stereoacuity. In addition, the agreement was evaluated using the Kappa coefficient (K= 0.743) with a 0.95 confidence interval and lower and upper Kappa limits were (0.628 and 0.858), respectively. Kappa coefficient and limits were still good when analyzing data before (K =0.663, 0.420 and 0.906) and after the treatment (K= 0.765, 0.632 and 0.899).
Conclusion: The Computerized Stereoscopic Game test allows the measure of stereoacuity. It can be used for both the purpose of detecting stereo vision deficits or tracking stereo vision development.
Keywords: amblyopia, computerized game test, gamification, stereoacuity, TNO test
Background
Stereo vision is the ability to compute depth information from the binocular disparity between the images of an object received by the left and right eyes.1 Stereo vision requires good vision in both eyes, excellent oculomotor control, and cortical mechanisms for sensory fusion. However, some anisometropic amblyopia patients retain good stereo vision (as the spheric interocular difference increases, the stereo vision generally decreases)2,3 but in patient with esotropic amblyopia the presence of stereo vision is anecdotic.4
The evaluation of stereo vision is considered the gold standard in the examination of binocular visual function.1 Stereoacuity is a relevant parameter in any ophthalmic examination,5 especially in the evaluation of amblyopia.
Different tests have been developed to measure stereopsis. Contour-based Titmus and Randot circles stereoacuity tasks include monocular cues, at higher disparity levels at least, which lead to a significant increase in false-positive results in patients with abnormal stereoacuity.6 Random dot stereoacuity tests (global stereopsis), being free of monocular cues, provide a pure measure of stereoacuity and hence are highly sensitive to binocular deficits.7,8 Between the random dot tests, the TNO (Lameris Ootech BV, Ede, Netherlands) is the only commercial test in anaglyph format and, according to Vancleef and Read, is used by 19% of professionals.9 Stereoacuity scores with TNO higher than 120 arcsec have been shown to preclude amblyopia.8
Nevertheless, the TNO test has a number of limitations: the test relies on printed copies, the number of stereo levels is limited to six, and a measurement error (or lucky guess) of just one level would register a 50% fictitious improvement. In fact, the poor test-retest reliability10 of the TNO test makes it unable to detect subtle changes in stereoacuity and hence not the best option for evaluation of an amblyopia treatment.
The limitations described above could be avoided using computerized tests. Breyer et al11 proposed the first stereoacuity test based on the use of a 3D monitor and infrared photo-oculography, with the objective of assessing stereo vision in preverbal children under natural visual conditions. Similarly, Kriegbaum-Stehberger, Jiang, and Mojon12 proposed an autostereoscopic display in conjunction with infrared photo-oculography to assess stereo vision in children under the age of four. Han et al13 subsequently developed another test based on the use of 3D displays to measure stereoacuity at both near and distant viewing distances (0.5 and 3 m). Smith et al proposed to measure the stereoacuity on a Nintendo 3DS.14,15 And finally, Vancleef et al16 proposed to measure the stereoacuity using an auto stereo 3D Tablet.
Stereoacuity can be improved using visual activities as part of a perceptual learning strategy in subjects with amblyopia17–20 as well as subjects with physiologically normal vision.21,22 Perceptual learning improvements are obtained after multiple repetitions of appropriately structured tasks, requiring the patient to interact with activities that are not always engaging. A gamification strategy can be used to more easily stimulate patient motivation and interaction. Gamification can be defined as the use of game thinking and game mechanics23 in non-game contexts to motivate users to solve problems. To the authors’ knowledge, there is no evidence of the potential utility of these gamified activities as an alternative method of measuring stereoacuity in perceptual learning treatments. The aim of the current study was to evaluate the level of agreement between stereoacuity results obtained with the conventional TNO stereo test and those measured with a new computerized, gamified, random dot stereo test developed by our research group.
Materials and Methods
Participants
Thirty-two stereo-deficient children aged from 7 to 14 years (mean age 9.4 ±2.0 years) participated in the study; 21 were female and 11 males. The participants had a history of treatment for amblyopia (optical correction and posterior occlusion and orthoptic/ vision therapy)24 and were enrolled in a proof of concept study, with a prospective, double blind and parallel group design, the goal of which was to improve stereopsis, using perceptual learning therapy with random dot stimuli in the form of a video game. This study was published in 2018.13 Summarizing, the difference between groups was significative, with a significance level of 5%; the statistical power associated to this analysis was 80%; and compliance was excellent (mean percentage of compliance was 88.36%, median 100% (IQ: 78.50 to 100).
The monocular best-corrected distance visual acuity of participants was ≥ 0.1 logMAR and the range of stereoacuity thresholds was from 200 to 800 arcsec (values according to Randot Preschool Stereoacuity Test).
The treatment consisted of using the computer game for a total of 60 daily sessions of 8 minutes (4,800 responses).
This research was conducted in compliance with the Declaration of Helsinki and approved by the Ethics Committee of Autonomous Community of the Basque Country, Spain (04/2013). The participants and their parents signed an informed consent before entering into the study.
Examination Protocol
All the participants underwent three complete ophthalmic examinations by an experienced examiner at an ophthalmology centre: once before entering the study, again after completion of the treatment (60 sessions of perceptual learning), and once again six months after completion of the treatment.
Visual evaluation included refraction under cycloplegic conditions and spectacle correction prescribed according to Pediatric Eye Disease Investigator Group (PEDIG) guidelines.25,26 The presence of ocular pathology was discarded by means of slit lamp and ophthalmoscopic examination. The binocular examination included a cover test at near distance using a 20/30 equivalent letter pasted on a tongue depressor held at 40 cm.27 Stereoacuity was evaluated using three different commercial tests: Randot Preschool Stereoacuity Test, Wirt circles and TNO. In addition, a new computerized stereoscopic game was used to evaluate stereopsis. The test measurements for the computerized stereoscopic game were obtained by a different specialist at an optometric centre. The practitioner ensured that the distance from the patient to the screen was maintained at a constant 80 cm to enable a fine level of stereoacuity. The illumination was consistent in both clinical settings for all participants during all three measurements (120 cd/m2).
The TNO stereo test and New Computerized Stereoscopic Game measurements were performed in different days and different Clinics.
Standard TNO Stereo Test
The TNO test uses random dot stimuli with red‐green glasses to separate the images presented to each eye. No monocular clues are present and the stereo target is not outlined by monocular visible contours. The commercial book includes seven sheets: sheets I to IV include different images to detect coarse stereopsis and possible suppression issues, and sheets V to VII are designed to measure stereoacuity. The measurement interval of this test ranges from 480 to 15 seconds of arc in five steps (50% improvement per step). To progress to subsequent levels, the patient has to successfully guess the location of a missed quadrant in two consecutive circles (forced choice procedure) of the level under evaluation.
New Computerized Stereoscopic Game Test
The New Computerized Stereoscopic Game test is an anaglyphic game. All scene elements are filtered using anaglyph technique, avoiding crosstalk and high discrepancy between each eye perceived images, caused by red or cyan pure elements. Different anaglyph techniques have been implemented in the game, allowing the user to choose the one that best fits both the computer screen colors and the anaglyph glasses he is using. User has also to set the screen size before using the game. The game runs in Microsoft Windows computers.
In this new test, as with other random dot stereo tests, a random dot image is used to conceal a silhouette (Figure 1, Supplementary Video S1). The program was designed to be used as a perceptual learning tool, and the test was gamified to enhance compliance. The test asks the child to find an object hidden in a sand box. The program presents a cloud of random dots, from which the silhouette of an object will be perceived by the child if they have the appropriate level of stereopsis. At the same time, four silhouettes are shown at the bottom of the screen; the child must choose the silhouette that corresponds to the object presented in the random dot image. If the child selects the correct silhouette, the real object appears in colour, providing positive feedback. If the wrong silhouette is chosen, two more attempts are allowed. After three failed attempts, the program automatically reveals the correct solution, and a new hidden object is displayed. Sounds also provide positive and negative feedback on each attempt (Supplementary Video S1). A total of 26 different hidden objects are used in the test to avoid repetition of the same examples. Three different categories (of difficulty) of working stereopsis are pre-defined in the game: poor (840–300 arcsec), coarse (480–210 arcsec) and moderate to fine stereopsis (210–30 arcsec). The program is set so that it operates in the category corresponding to the initial stereoacuity obtained by the patient. Once the patient has been allocated to one of the three categories described above, they will train in this category. Each category has 10 levels of stereoacuity, with different levels for each session; the patient’s goal is to advance to level 10. To advance to the next level, the patient must correctly identify the hidden object on three consecutive occasions. If the patient fails to identify the hidden object three times, the program maintains the same level of stereopsis. The program measures stereopsis as the last level of stereoacuity at which the subject correctly identifies the hidden object on three consecutive occasions (the probability of advancing to the next level by chance is 1/64 or 1.6%).
 |
Figure 1 Logical process of the game. The subject must identify the hidden silhouette, selecting one from those shown in the bottom part of the screen (left image). If the answer is correct, the software plays a high-pitched sound and the same image appears in the form of picture (right image). If the subject provides three consecutive correct answers, the software generates a new screen with a random dot image representing a finer stereopsis. If the subject provides a wrong answer, the software plays a deep sound and the random dot image does not change (left image). Finally, if the subject provides three consecutive wrong answers, the software shows the right answer (right image). |
The program was designed to measure stereoacuity levels up to 30 seconds of arc. In fact, the finest level stereoacuity capable of being measured depends on the distance from the screen and the pixel resolution. In the case of a screen with a width of 345 mm and a horizontal resolution of 1920 pixels, for example, if the child sits 80 cm from the screen – as in our study – the finest measurable stereoacuity will be 46.5 seconds of arc.
Participants spent approximately 2 minutes completing the stereo acuity measurement test.
Statistical Analyses
Agreement between the stereoacuity scores obtained with TNO and the new Computer Stereoacuity Game test was assessed using different methods. First, the raw results were presented to show and compare the data distribution, grouped per stereoacuity level, session number (1, 2 or 3), and type of test. The stereoacuity results were then transformed to natural log scale for a first statistical analysis. All stereo thresholds are expressed as log10, thereby meeting the normality assumption of the linear model and facilitating comparison of test variability at low and high stereoacuity thresholds, irrespective of which test is used. The use of log score in stereopsis, through unusual in clinical practice, is widely used in stereopsis research.10,19,28 The agreement between the two tests was compared by plotting the scores each participant obtained in one test against those they obtained in the other. Pearson correlation coefficients of the measurements obtained with the two stereoacuity tests were calculated. In addition, the difference between the test scores derived from each participant was plotted against their mean stereoacuity score (Bland–Altman plots). These approaches enabled the agreement between the two stereoacuity tests to be assessed across the entire spectrum of possible stereoacuity scores.
The third analysis examined the agreement between the two tests as a function of the category of stereoacuity achieved by each participant. Stereoacuity was categorized as moderate–fine (≤200 seconds; ≤2.30 log sec), coarse (200–600 seconds; 2.30–2.78 log sec), and poor (≥600 seconds; 2.78 log sec). Agreement was evaluated using the Kappa coefficient. Kappa values within the intervals 0.41–0.60, 0.61–0.80, and 0.81–1.0 indicate moderate, substantial, and almost perfect agreement, respectively.29 Positive predictive value (PPV) percentages were also calculated.
Finally, the categorical agreement between both tests was analyzed as a function of the session number. If there were a learning side effect of the Computerized Stereoscopic Game test as a result of the perceptual learning tasks carried out by the participants, an increase in the categorical differences would be discernible between trial #1 and trials #2 and #3, when compared to the TNO test.
Results
The sample consisted of a total of 32 patients with a history of amblyopia; four of these had a history of refractive amblyopia, and 28 had a history of strabismic amblyopia. The mean baseline monocular best-corrected distance visual acuity in the dominant eye was 0.01 logMAR ± 0.05, ranging from a minimum value of −0.01 logMAR to a maximum of 0.10 logMAR. In the eye with a history of amblyopia, the mean monocular best-corrected distance visual acuity was 0.06 logMAR ± 0.04, ranging from a minimum value of −0.04 logMAR to a maximum value of 0.10 logMAR. Thirty of the participants presented with hyperopia, one presented with myopia and one with emmetropia.
The raw test scores obtained by each of the participants in the sample are presented in Table 1, where they are grouped according to stage (#1, before the perceptual learning treatment; #2, upon completion of the treatment; and #3, six months after completion of the treatment) and type of test (TNO or computer-based test).
 |
Table 1 Raw Test Scores Obtained by Each Individual Subject per Session |
Those patients who showed stereopsis in response to the first sheets of TNO test, but failed the coarser TNO test sheets (480 arcsec), appear with an arbitrary level of 840 arcsec in Table 1. Table 2 shows the raw data distribution according to the stereoacuity level recorded in both tests, considering also the session number. For example, with the Computerized Stereoscopic Game test, a measure of 840 arcsec was obtained on 21 occasions. This level of stereoacuity was obtained 12 times in the first session, four times in the second session, and five times in the third.
 |
Table 2 Categorical Agreement Between the TNO Test and the CSG by Individual Subjects |
The results of the two tests have been plotted against each other in Figure 2A and B. The Pearson correlation coefficient between individual scores was r2=0.767 (p<0.001) (Figure 2A). The slope of the line of regression, with a specific value of 37.3 degrees, was less than 45 degrees.
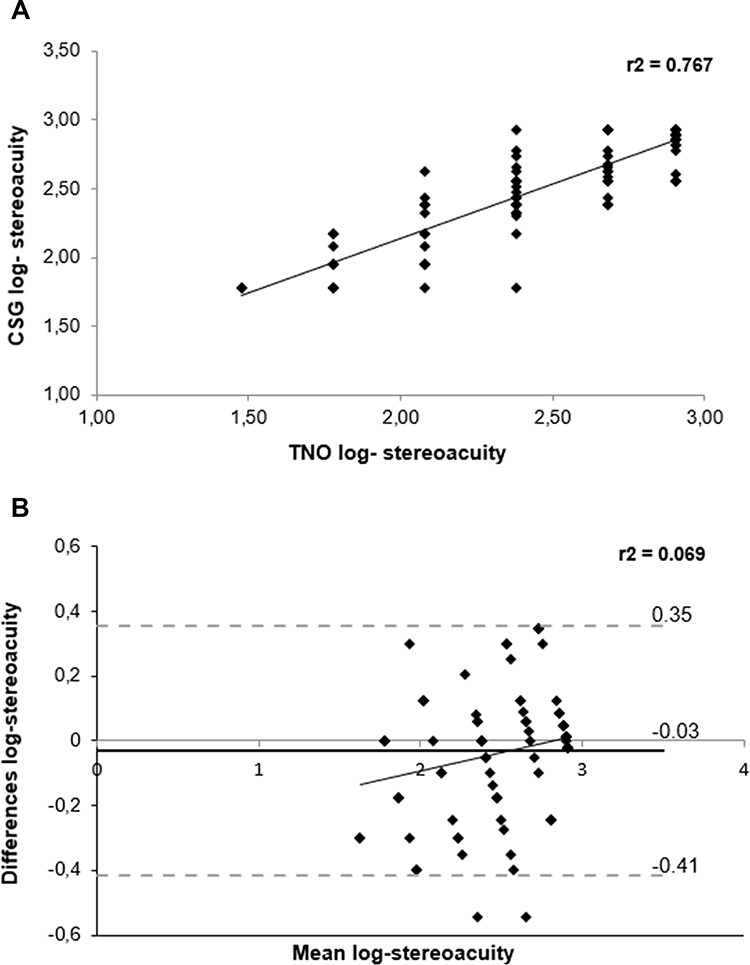 |
Figure 2 (A) Pearson’s correlation coefficient obtained through the comparison of measurements obtained by the CSG vs TNO test, both in logarithmic values. (B) Bland–Altman plot that compares stereoacuity logarithmic values measured by the CSG vs TNO test. The dashed lines show the limits of agreement for a 95% prediction of the population and the dotted line the mean difference between the methods compared and the confidence interval of the mean. |
The agreement between the two test scores was also represented in Figure 2B by plotting the differences between the test scores of each participant against the mean of their two test scores. This type of plot is known as a Bland–Altman plot, which also enables us to assess whether the agreement depends on the level of stereoacuity. The mean difference between the computer-based and TNO test scores was −0.03 SD ± 0.197 log sec, with a correlation coefficient of r2= 0.069 (p=0,04).
Table 2 shows the categorical agreement between the TNO test and the computer-based test by individual patient and by session. For example, 37 subjects obtained a poor level of stereopsis with the TNO test. In 32 of those subjects, the stereopsis was poor with the Computerized Stereoscopic Game test, while in five subjects the measurement was coarse. Statistical analysis is summarized in Table 3. Using all three session results, PPV was calculated for each category: 89.5% for moderate–fine, 72.7% for coarse, and 90.0% for poor stereoacuity. Using all three session results, the Kappa index calculated was 0.7433 (95% confidence interval: 0.6285 to 0.8585). PPV and Kappa values were also calculated for the results of session #1 and sessions #2 and #3 (pre- and post-perceptual learning therapy).
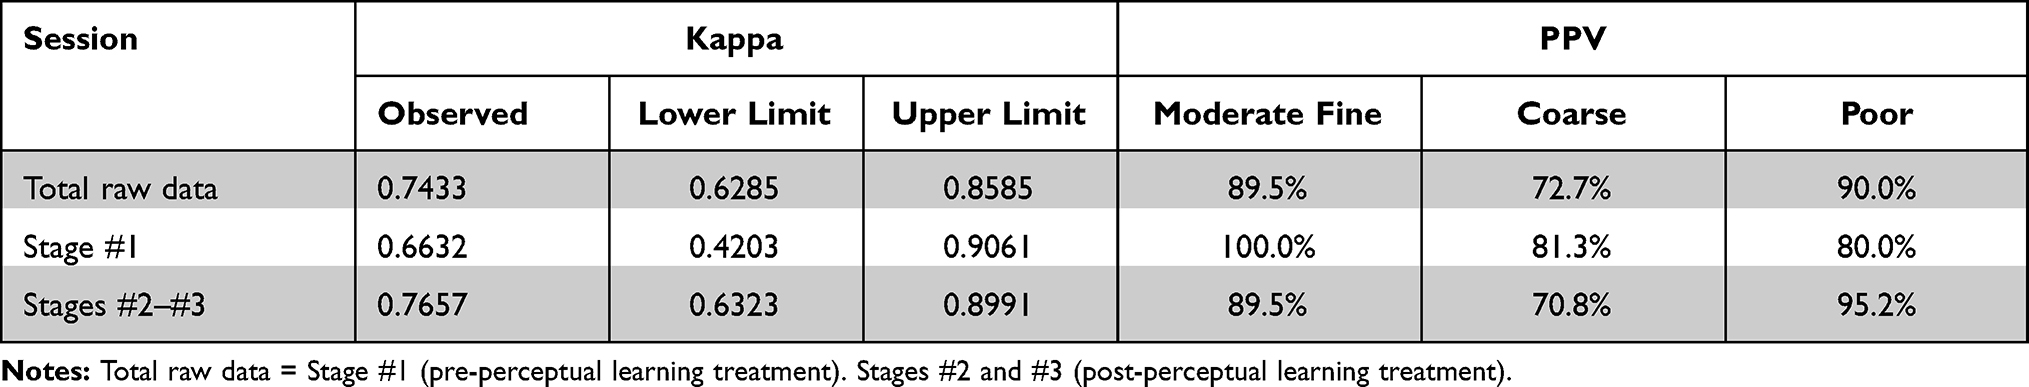 |
Table 3 Categorical Agreement Between TNO and Computerized Stereoscopic Game Tests: Kappa Value; 0.95 Confidence Interval Limits; and Positive Predictive Values (PPV) per Category |
Analysis of the results shows that the stereoacuity thresholds obtained with the Computerized Stereoscopic Game test are concordant with those obtained with the TNO test.
Discussion
In this study, we propose a new computer-based stereoacuity test that addresses all the previously mentioned limitations of random dot tests. Originally designed as a gamified version of the random dot stereo test, its main purpose is to ensure children’s compliance with a course of perceptual learning treatment for amblyopia. The results of the present study confirm that this test can be used as a stereoacuity test to detect stereo vision deficits and track stereo vision development.
The data collected in our sample covers the spectra of stereoacuity levels that can be measured with both tests reasonably well. If only session #1 had been considered, the data would have been insufficient to cover all levels of moderate to fine stereoacuity, as shown in Table 2. Since all the patients were enrolled on a course of perceptual learning therapy, stereoacuity improved during the follow-up and better stereoacuity values were able to be obtained. Pearson’s correlation coefficient between individual scores obtained with the Computer Stereoscopic Game and TNO tests was sufficient to confirm a positive correlation between the two tests (r2 = 0.767), as shown in Figure 2A. The slope of the regression line linking the results of the two tests in Figure 2A, which may have been affected by the choice of an arbitrary value for coarse stereopsis in the TNO test, was lower than 45 degrees. However, despite the correlation, this result does not enable us to state that the two tests are interchangeable. An agreement analysis was therefore performed, using a Bland–Altman plot (Figure 2B). This showed that the limits of agreement (−0.41 to 0.35 log sec), calculated as 1.96 times the standard deviation of differences, cannot be considered clinically relevant. The Bland–Altman plot further shows that the agreement between tests was not dependent on the level of stereoacuity (r2 = 0.069).
It can be argued that the stereoacuity levels provided by the two tests cannot be correlated, given that the TNO, apart from detecting the presence of coarse stereopsis, provides only six levels of measurement, whereas the computer-based test provides up to 22. This problem is solved by means of an analysis of the categorical differences. Adams et al (2009)28 found that, when a subject’s stereopsis level is measured with a commercial stereoacuity test, a variance of at least two levels must be detected to ensure test-retest reliability. Following these authors, each category proposed in the current study includes at least two levels of the TNO test: poor category (>600 sec) detected with the TNO Test when using sheets, I to IV, coarse category (600–200 sec) detected with the first two TNO levels (480 and 240 seconds), and moderate–fine category (<200 sec), detected with the last four TNO levels (120, 60, 30 and 15 seconds). The risk of passing one category purely by chance is thus drastically reduced. Tables 2 and 3 show that the results within each category, defined for both tests, were highly correlated. A Kappa analysis further demonstrated the presence of substantial or almost perfect agreement between the two tests. Even considering session #1 and sessions #2 and #3 separately (pre- and post-training), the results were excellent. This outcome is especially important because there is always a risk of learning side effects with perceptual learning exercises. Several studies have demonstrated that, even using random dot stereograms, subjects take less time to perceive figure and depth with repeated observation.30 The computer-based test evaluated in the present study uses up to 26 different silhouettes to avoid such a problem. As previously noted, the agreement between the two tests was high, both before and after the therapy, hence any learning side-effect altered the relationship substantially. However, a more detailed study of Table 2 shows a slight tendency toward finer stereopsis. For example, four subjects up to 24 showed moderate to fine stereopsis measured with the Computerized Stereoscopic Game-Test in session #2 and #3, through the same subjects presented coarse stereopsis with TNO. One possible explanation is the possible learning side-effect that would facilitate the detection of disparity. Notwithstanding, it could be argued that the design of the Computerized Stereoscopic Game test, with 26 different silhouettes, would make learning more difficult. Another plausible reason takes into account that TNO tends to overestimate stereopsis thresholds.9,31 Vancleef et al9 conclude that the factors behind overestimation are (a) the nature of the cognitive task (the patient has to point to the missing piece of the cake or pie and (b) the use of red-green glasses. Anaglyph filters affect the luminous transmittance, and could potentially alter suppression. The Computerized Stereoscopic Game test is a gamified test in which the silhouette is an easily-identifiable image requiring low cognitive demand. The hidden silhouette paradigm resembles the Randot Dot Stereo-Acuity Preschool test, which provides a high level of testability.32 More importantly, anaglyph problems due to luminance reduction are much more critical in printed paper tests. Screen illumination should decrease the effect of red-green filters and reduce interference in the detection of disparity. Finally, another important advantage of computerized tests over commercial tests (not only the TNO test) is the reduced possibility of the subject improving their stereopsis level by chance, from 480 to 240 arcsec, for example. The possibility of this happening with the TNO test is 6.4%, whereas with the Computerized Stereoscopic Game test, the possibility is remote.
A number of ideas for improving the computer-based test have been proposed since the study was completed. Patients with strabismus have more difficulty in identifying shapes in random dot tests, as they rely more on monocular cues and are more sensitive to noise crowding.33 The dots are small and dense, low in contrast, and static, making them less than optimal for a subject with strabismus to detect depth.3 Indeed, random dot tests detect strabismus with highly sensitivity.34 On the other hand, they are also highly sensitive to monocular acuity deficits. Stereoacuity thresholds are more easily degraded by reduced monocular visual acuity using random dot tests than real depth tests.35 Anisometropia leads to reduced stereopsis at high spatial frequencies but not at low frequencies.36 Stereopsis is possible at frequencies perceived by both eyes. To overcome these problems, we propose to reduce the density of the dots in our computer-based test.37 Variable low-density random dot patterns could also be implemented to measure poor stereopsis. This improvement will be implemented in future versions of the computer-based test.
Recently, several investigations have been published proposing evaluation models based on the use of specific hardware, as Nintendo 3D14,15 or 3D tablets.16 These models have technical advantages over the model proposed in this article. On the one hand, the use of anaglyph glasses is not necessary. Even in the study by Vancleef et al with a 3D tablet,16 the viewing distance was monitored automatically using the device’s front camera (wearing the user a sticker as a target for distance tracking).
However, the model we present has other advantages that should be highlighted: it is a universal model that can be implemented on any computer, no matter the screen; and the measurement procedure is gamified, which facilitates the attentional response during the measurement of stereo acuity.38
The pass level condition used in the present study is another area that could be improved. Psychometric-function procedures such as a one-up, one-down staircase, or even a more sophisticated method such as QUEST,39 could provide thresholds and might improve accuracy.40 Using any of these methods, the program iterates back and forth around the estimated threshold until a valid result is obtained, although this could make the test itself more time-consuming. In a clinical setting, therefore, these alternatives will need to be carefully considered.
Conclusion
The computer-based test developed and evaluated in the current study is able to provide consistent measurements of stereoacuity, with no learning side effects and results comparable to those provided by other commercially available random dot tests. The test can be used for both detecting deficits in stereo vision and tracking stereo vision development.
Ethical Approval
This study was approved by the Ethics Committee of Autonomous Community of the Basque Country, Spain (04/2013). All the procedures used in this research were performed in accordance with the 1964 Declaration of Helsinki and its later amendments or comparable ethical standards. Informed consent was obtained from all the individuals that took part in the study.
Informed Consent
Informed consent was obtained from all the individuals that took part in the study.
Acknowledgment
The authors would like to thank Dr David Piñero-Llorens for his important contribution to the final version of this article.
Funding
Financial support in the form of a grant was provided by the European University of Madrid as part of its doctoral programme (2013 UEM 20; to JR-A). The sponsor had no role in the design or performance of this research.
Disclosure
The computer-based test itself was developed at the University of Oviedo by the IdeasCAD research team (www.ideascad.es) under the direction of Dr Martín-González, co-author of this manuscript.
Subsequent to completion of this study, a private company, VISIONARY TOOL, S.L., (www.visionarytool.com) invited Dr Martín-González and Dr Portela-Camino to participate in the development of a computerized vision training tool which includes several games and tests. The one used in this paper, based on random dot images, is one of them.
Dr Juan A. Portela-Camino reports grants from European University of Madrid, during the conduct of the study. Dr Santiago Martín-González reports: after this work was finished, I participated in the creation of a new company which commercializes the computerized test described in this work. The authors reported no conflicts of interest for this work.
References
1. Read JCA. Stereo vision and strabismus. Eye. 2015;29(2):214–224. doi:10.1038/eye.2014.279
2. Dadeya S, Kamlesh K, Shibal F. The effect of anisometropia on binocular visual function. Indian J Ophthalmol. 2001;49:261–263.
3. Levi DM, Knill DC, Bavelier D. Stereopsis and amblyopia: a mini-review. Vision Res. 2015;114:17–30. doi:10.1016/j.visres.2015.01.002
4. McKee SP, Levi DM, Movshon JA. The pattern of visual deficits in amblyopia. J Vis. 2003;3:380–405. doi:10.1167/3.5.5
5. Westheimer G. Clinical evaluation of stereopsis. Vision Res. 2013;90:38–42. doi:10.1016/j.visres.2012.10.005
6. Fawcett SL, Birch EE. Validity of the Titmus and Randot circles tasks in children with known binocular vision disorders. J AAPOS. 2003;7:333–338. doi:10.1016/S1091-8531(03)00170-8
7. Birch E, Williams C, Hunter J, et al. Random dot stereoacuity of preschool children. ALSPAC “Children in Focus” study team. J Pediatr Ophthalmol Strabismus. 1997;34:247–248. doi:10.3928/0191-3913-19970701-08
8. Walraven J, Janzen P. TNO stereopsis test as an aid to the prevention of amblyopia. Ophthalmic Physiol Opt. 1993;13:350–356. doi:10.1111/j.1475-1313.1993.tb00490.x
9. Vancleef K, Read JCA, Herbert W, et al. Overestimation of stereo thresholds by the TNO stereotest is not due to global stereopsis. Ophthalmic Physiol Opt. 2017;37:507–520. doi:10.1111/opo.12371
10. Antona B, Barrio A, Sanchez I, et al. Intraexaminer repeatability and agreement in stereoacuity measurements made in young adults. Int J Ophthalmol. 2015;18:374–381.
11. Breyer A, Jiang X, Rütsche A, et al. A new 3D monitor-based random-dot stereotest for children. Investig Ophthalmol Vis Sci. 2006;47:4842–4846. doi:10.1167/iovs.06-0238
12. Kriegbaum-Stehberger B, Jiang X, Mojon DS. Performance of a new, 3D-monitor based random-dot stereotest for children under 4 years of age. Graefes Arch Clin Exp Ophthalmol. 2008;246:1–7. doi:10.1007/s00417-007-0632-3
13. Han SB, Yang HK, Kim J, et al. New stereoacuity test using a 3-dimensional display system in children. PLoS One. 2015;10(2):e0116626. doi:10.1371/journal.pone.0116626
14. Smith KA, Damarjian AG, Molina A, et al. Calibrated measurement of acuity, color and stereopsis on a Nintendo® 3DS™ game console. Clin Optom. 2019;11:47–55. doi:10.2147/OPTO.S199992
15. Smith KA, Arnold AW, Sprano JH, et al. Performance of a quick screening version of the nintendo 3DS PDICheck game in patients with ocular suppression. J Pediatr Ophthalmol Strabismus. 2019;56:234–237. doi:10.3928/01913913-20190502-01
16. Vancleef K, Serrano-Pedraza I, Sharp C, et al. ASTEROID: a new clinical stereotest on an autostereo 3D tablet. Transl Vis Sci Technol. 2019;8:25. doi:10.1167/tvst.8.1.25
17. Xi J, Jia WL, Feng LX, et al. Perceptual learning improves stereoacuity in amblyopia. Invest Ophthalmol Vis Sci. 2014;55:2384. doi:10.1167/iovs.13-12627
18. Vedamurthy I, Knill DC, Huang SJ, et al. Recovering stereo vision by squashing virtual bugs in a virtual reality environment. Philos Trans R Soc Lond Ser B Biol Sci. 2016;371(1697):10.
19. Portela-Camino JA, Martín-González S, Ruiz-Alcocer J, et al. A random dot computer video game improves stereopsis. Optom Vis Sci. 2018;95:523–535. doi:10.1097/OPX.0000000000001222
20. Martín-González S, Portela-Camino J, Ruiz-Alcocer J, et al. Stereoacuity improvement using random-dot video games. J Vis Exp. 2020;155:e60236.
21. Gantz L, Patel SS, Chung STL, Harwerth RS. Mechanisms of perceptual learning of depth discrimination in random dot stereograms. Vision Res. 2007;47:2170–2178. doi:10.1016/j.visres.2007.04.014
22. Fahle M, Edelman S, Poggio T. Fast perceptual learning in hyperacuity. Vision Res. 1995;35:3003–3013. doi:10.1016/0042-6989(95)00044-Z
23. Kapp KM. The Gamification of Learning and Instruction: Game-Based Methods and Strategies for Training and Education. New York: Pfieffer: An Imprint of John Wiley & Sons; 2012.
24. Molina-Martin A, Martín-González S, Illarramendi-Mendicute I, et al. Combined passive and active treatment in strabismic amblyopia with accommodative component. Clin Exp Optom. 2020;103:885–894. doi:10.1111/cxo.13140
25. Cotter SA; Pediatric Eye Disease Investigator Group. Treatment of anisometropic amblyopia in children with refractive correction. Ophthalmology. 2006;113:895–903. doi:10.1016/j.ophtha.2006.01.068
26. Cotter SA, Foster NC, Holmes JM; Pediatric Eye Disease Investigator Group. Optical treatment of strabismic and combined strabismic–anisometropic amblyopia. Ophthalmology. 2012;119:150–158. doi:10.1016/j.ophtha.2011.06.043
27. Holmes JM, Leske DA, Hohberger GG. Defining real change in prism-cover test measurements. Am J Ophthalmol. 2008;145:381–385. doi:10.1016/j.ajo.2007.09.012
28. Adams WE, Leske DA, Hatt SR, et al. Defining real change in measures of stereoacuity. Ophthalmology. 2009;116:281–285. doi:10.1016/j.ophtha.2008.09.012
29. Cohen J. A coefficient of agreement for nominal scales. Educ Psychol Meas. 1960;20:37–46. doi:10.1177/001316446002000104
30. O’Toole AJ, Kersten DJ. Learning to see random-dot stereograms. Perception. 1992;21:227–243. doi:10.1068/p210227
31. Piano ME, Tidbury LP, O’Connor AR. Normative values for near and distance clinical tests of stereoacuity. Strabismus. 2016;24:169–172. doi:10.1080/09273972.2016.1242636
32. Tarczy-Hornoch K, Lin J, Deneen J, et al. Stereoacuity testability in African-American and Hispanic pre-school children. Optom Vis Sci. 2008;85:158–163. doi:10.1097/OPX.0b013e3181643ea7
33. Greenwood JA, Tailor VK, Sloper JJ, et al. Visual acuity, crowding, and stereo-vision are linked in children with and without amblyopia. Invest Ophthalmol Vis Sci. 2012;53:7655–7665. doi:10.1167/iovs.12-10313
34. Leske DA, Birch EE, Holmes JM. Real depth vs randot stereotests. Am J Ophthalmol. 2006;142:699–701. doi:10.1016/j.ajo.2006.04.065
35. Odell NV, Hatt SR, Leske DA, et al. The effect of induced monocular blur on measures of stereoacuity. J AAPOS. 2009;13:136–141. doi:10.1016/j.jaapos.2008.09.005
36. Legge GE, Yuanchao YC. Stereopsis and contrast. Vis Res. 1989;29:989–1004. doi:10.1016/0042-6989(89)90114-4
37. Gantz L, Bedell HE. Variation of stereothreshold with random-dot stereogram density. Optom Vis Sci. 2011;88(9):1066–1071. doi:10.1097/OPX.0b013e3182217487
38. Portela-Camino JA, Martín-González S, Ruiz-Alcocer J, et al. Predictive factors for the perceptual learning in stereodeficient subjects. J Optom. 2021;14:156–165. doi:10.1016/j.optom.2020.03.001
39. Watson AB. QUEST: a general multidimensional Bayesian adaptive psychometric method. J Vis. 2017;17:10. doi:10.1167/17.3.10
40. Shen Y. Comparing adaptive procedures for estimating the psychometric function for an auditory gap detection task. Atten Percept Psychophys. 2013;75:771–780. doi:10.3758/s13414-013-0438-9
 © 2021 The Author(s). This work is published and licensed by Dove Medical Press Limited. The
full terms of this license are available at https://www.dovepress.com/terms
and incorporate the Creative Commons Attribution
- Non Commercial (unported, 3.0) License.
By accessing the work you hereby accept the Terms. Non-commercial uses of the work are permitted
without any further permission from Dove Medical Press Limited, provided the work is properly
attributed. For permission for commercial use of this work, please see paragraphs 4.2 and 5 of our Terms.
© 2021 The Author(s). This work is published and licensed by Dove Medical Press Limited. The
full terms of this license are available at https://www.dovepress.com/terms
and incorporate the Creative Commons Attribution
- Non Commercial (unported, 3.0) License.
By accessing the work you hereby accept the Terms. Non-commercial uses of the work are permitted
without any further permission from Dove Medical Press Limited, provided the work is properly
attributed. For permission for commercial use of this work, please see paragraphs 4.2 and 5 of our Terms.