
Back to Journals » Journal of Pain Research » Volume 19
An Erythroid Gene Expression Signature in Preoperative Whole-Blood RNA-Seq Associated with Rebound Pain After Brachial Plexus Block: A Prospective Observational Study
Authors Zhou D, Liu F, Gong X  , Chen L
Received 4 February 2026
Accepted for publication 28 May 2026
Published 3 June 2026 Volume 2026:19 601099
DOI https://doi.org/10.2147/JPR.S601099
Checked for plagiarism Yes
Review by Single anonymous peer review
Peer reviewer comments 2
Editor who approved publication: Dr Karina Gritsenko
Dongxu Zhou,1,2,* Fan Liu,2,* Xingrui Gong,2 Lijian Chen1
1Department of Anesthesiology, The First Affiliated Hospital of Anhui Medical University, Anhui, Hefei, 230022, People’s Republic of China; 2Department of Anesthesiology, Xiangyang Central Hospital, Affiliated Hospital of Hubei University of Arts and Science, Hubei, Xiangyang, 441000, People’s Republic of China
*These authors contributed equally to this work
Correspondence: Lijian Chen, Email [email protected]
Background: Preoperative whole-blood transcriptomic profiles may reflect systemic biological variation before surgery, but their association with rebound pain after brachial plexus block remains unclear. This study investigated whether preoperative whole-blood transcriptomic profiles are associated with pain escalation after brachial plexus block resolution.
Methods: This single center prospective study enrolled patients who underwent upper extremity surgery with ultrasound guided brachial plexus block. Preoperative whole blood RNA sequencing was used to compare the transcriptomic profiles between patients with and without rebound pain. Differential expression, functional enrichment, protein–protein interaction analysis, LASSO regression, and random forest analysis were performed. The selected hub gene was further validated by qRT-PCR in an independent cohort using the same matching strategy.
Results: Among the 47 analyzed patients, 28 experienced rebound pain. The RNA-seq discovery cohort included 24 matched patients, with 12 patients in each group. RNA-seq analysis identified 110 differentially expressed genes, most of which were upregulated in the rebound pain group. Enrichment analyses highlighted erythrocyte differentiation, hemoglobin metabolism, porphyrin biosynthesis, and oxygen–carbon dioxide exchange. Protein–protein interaction analysis identified a 13-gene cluster, from which GYPB was selected by LASSO and random forest analyses. In the independent validation cohort of 45 patients, 15 matched pairs were included in qRT-PCR analysis, which confirmed significantly increased GYPB mRNA expression in patients with rebound pain, showing a 3.390-fold increase compared with patients without rebound pain (95% CI: 1.258– 3.523; P < 0.05).
Conclusion: Preoperative whole-blood erythrocyte-related transcriptional signals, including GYPB upregulation, were associated with rebound pain after brachial plexus block. As these exploratory findings were based on a limited RNA-seq cohort, larger studies incorporating blood cell composition are needed to validate their clinical relevance and specificity.
Trial Registration: This study was registered with the Chinese Clinical Trial Registry. No. ChiCTR2400081153. Registered 23 February 2024. An infographic titled “An Erythroid Gene Expression Signature in Preoperative Whole-Blood RNA-Seq Associated With Rebound Pain After Brachial Plexus Block: A Prospective Observational Study” summarizes a study on 47 patients undergoing upper extremity surgery with brachial plexus block. The study compares 28 patients with rebound pain to 19 without. Methods include sequencing, screening, validation, transcriptome analysis, protein interaction networks and machine learning (LASSO, random forest). Key findings reveal 110 genes, mainly upregulated in the rebound pain group, with a focus on erythrocyte-related transcriptional activity, particularly GYPB upregulation, linked to rebound pain. Visuals include a scatter plot and a multi-stream pathway chart.An infographic on RNA-seq gene expression and rebound pain after brachial plexus block in 47 patients.
Keywords: rebound pain, brachial plexus block, whole-blood RNA sequencing, transcriptomics, erythroid differentiation
Background
Peripheral nerve blocks are widely used in upper extremity surgery to provide reliable regional analgesia and reduce early postoperative opioid exposure.1–3 Although these techniques confer well-documented perioperative analgesic benefits, an increasing body of evidence has described rebound pain, defined as a marked increase in pain as the numbness from the block resolves.4,5 Rebound pain has been associated with sleep disruption, delayed functional recovery, and increased use of rescue analgesics.6,7
To date, research has focused on perioperative and procedural factors, including local anesthetic type, adjuvant use, block duration, psychological factors, and surgical characteristics.8–10 However, these factors may explain only part of the substantial interindividual variability in rebound pain severity. Notably, postoperative pain trajectories often diverge after block resolution, even among patients with similar demographics, comparable surgical procedures, and similar regional techniques.11
The mechanisms underlying rebound pain after peripheral nerve block remain incompletely understood.1 Current evidence suggests that rebound pain may involve spontaneous hyperexcitability of peripheral nerve fibers, inflammation secondary to tissue injury, neurotoxic effects of local anesthetics, and local nerve damage.12–16 Small fiber neuropathy, which affects thinly myelinated Aδ fibers and unmyelinated C fibers and is difficult to diagnose and treat, may also influence postoperative pain trajectories and rebound pain assessment.17
Although neural and local tissue mechanisms are directly relevant to rebound pain, sampling these tissues before surgery is generally impractical and may expose patients to unnecessary risk. Whole-blood transcriptomic profiling may instead provide a feasible way to assess systemic gene expression patterns relevant to pain biology.18 Erythroid differentiation is closely linked to heme synthesis and hemoglobin production, while heme metabolism has been implicated in nociceptive biology.19,20 For preoperative systemic profiling, whole blood preserves transcriptomic information from multiple circulating cell populations, whereas isolated cell populations provide cell-type-specific profiles but require additional processing that may introduce processing-related variability.21 However, bulk whole-blood RNA-seq may be influenced by blood cell composition, so erythroid-related signals should be interpreted with this potential confounding in mind. Although transcriptomic studies have been conducted in several acute and chronic pain models,22,23 gene expression patterns specific to rebound pain have not been characterized.
In this study, we compared preoperative blood gene expression profiles between patients who developed rebound pain after nerve block and those who did not to delineate transcriptomic features associated with differential pain responses. Protein-protein interaction analysis and machine learning analyses were used to identify coordinated gene clusters and candidate transcripts, and key findings were validated in an independent cohort using qRT-PCR. With further validation, preoperative biomarkers associated with rebound pain may help identify patients at increased risk before surgery and support individualized analgesic planning, perioperative counseling, and closer postoperative follow-up after block resolution.
Methods
This was a single-center, prospective observational study. The study was carried out in accordance with the Declaration of Helsinki, and the research protocol was approved by the Ethics Committee of Xiangyang Central Hospital, Affiliated Hospital of Hubei University of Arts and Science, Xiangyang, China. All participants provided written informed consent. Reporting followed the Strengthening the Reporting of Observational Studies in Epidemiology (STROBE) statement.24
Study Setting and Population
Patients aged 18–75 yr with American Society of Anesthesiologists (ASA) physical status I–III who were scheduled to undergo open reduction and internal fixation (ORIF) of upper-extremity fractures under brachial plexus block at Xiangyang Central Hospital (Xiangyang, China) were eligible.
The exclusion criteria were as follows: concurrent surgery at other anatomical sites; emergency surgery; peripheral neuropathy or pre-existing nerve injury of the operative upper limb; prior axillary surgery on the operative side; more than one previous surgery on the operative upper limb; allergy to local anesthetics or contraindications to postoperative analgesics (eg. nonsteroidal anti-inflammatory drugs, ibuprofen); pregnancy; diabetes mellitus or vascular disease; chronic use of opioids; antipsychotics; or antidepressants; infection at the injection site; acute porphyria; or renal disease requiring dialysis; contraindications to regional anesthesia; requirement for supplemental general anesthesia because of an inadequate block or inadequate anesthesia; or conversion to general anesthesia; chronic pain syndrome; inability to complete perioperative questionnaires because of language barriers or cognitive impairment; or participation in similar studies within the preceding 3 months. Participants were recruited from April 2024 until the required sample size was achieved in September 2024.
Clinical Management
Midazolam (2 mg) and dexamethasone (8 mg) were given intravenously preoperatively. Brachial plexus block was performed by trained anesthesiologists under real-time ultrasound guidance, with the approach selected according to the patient’s surgical site: 20 mL of 0.4% ropivacaine for interscalene block, 15 mL of 0.4% ropivacaine for axillary block, or a combination of both approaches. To assess sensory block adequacy prior to skin incision, cold testing (using a 0°C glass ampoule) was conducted across multiple anatomical territories. Patients with incomplete blocks were converted to general anesthesia and excluded from the analysis.
Throughout the surgery, sedation was provided with dexmedetomidine: a loading dose of 1 μg/kg infused over 10 min, followed by a continuous infusion of 0.5 μg·kg−1·h−1 until the end of surgery. For postoperative pain management, patients were transferred to the ward and received a standardized regimen consisting of oral ibuprofen 400 mg every 8 h and patient-controlled analgesia (PCA) with sufentanil (background infusion 5 μg/h, bolus 3 μg, lockout 15 min).
The primary outcome was the incidence of postoperative rebound pain within 48 h after brachial plexus block. Pain intensity was assessed using an 11-point numeric rating scale (NRS), where 0 indicated no pain and 10 indicated the worst imaginable pain. NRS scores were recorded preoperatively and at 08:00 and 20:00 on postoperative days 1, 2, and 3 by trained research staff. Rebound pain was defined as a transition from well-controlled pain, defined as NRS ≤ 3, to severe pain, defined as NRS ≥ 7, within the first 48 h after block performance. This definition was adapted from the criteria proposed by Tim et al.25 Patients who met this criterion were assigned to the rebound pain (RP) group, whereas those who did not were assigned to the no rebound pain (NRP) group.
Transcriptome Analysis
RNA Extraction
RNA extraction, library preparation, and sequencing were performed by Wuhan Metware Biotechnology Co. Ltd. (Wuhan, China) in accordance with the manufacturer’s protocols (Illumina, San Diego, CA, USA). Before induction of anesthesia, 2 mL of peripheral venous blood was collected from each participant into EDTA tubes. TRIzol® (6 mL) was added, the sample was mixed gently by inversion, incubated for 5 min, and then stored at −80°C until processing. RNA concentration was measured using a fluorometer (Thermo Fisher Scientific, Waltham, MA, USA), and RNA integrity was assessed with a Qsep400 Bioanalyzer (Bioptic, Changzhou, China). Libraries were constructed only from samples that met quality requirements.
mRNA Library Construction
Poly(A)+ mRNA was enriched using oligo(dT) magnetic beads. Purified mRNA was fragmented under controlled conditions using fragmentation buffer. First-strand cDNA was synthesized by reverse transcription with random hexamer primers. For strand-specific library preparation, dUTP was substituted for dTTP during second-strand synthesis to prevent amplification of the uracil-containing strand by the high-fidelity DNA polymerase, thereby preserving strand specificity. End repair and dA-tailing were performed. Adapter ligation was performed. Libraries were purified and size selected using magnetic beads to obtain insert sizes of 250–350 bp, then PCR-amplified and purified again. Final libraries were eluted in nuclease-free water. Library concentration was quantified by fluorescence, and fragment size distribution was evaluated using the Qsep400 system. Qualified libraries were pooled based on effective concentration and target sequencing depth and sequenced on an Illumina® platform to generate 150-bp paired-end reads.
RNA-Seq Quality Control, Alignment, and Quantification
Raw sequencing reads were subjected to quality control using fastp v0.23.2. Adapter-containing reads were removed. Paired reads were discarded if the proportion of N bases in either read exceeded 10% of the read length or if bases with Q ≤ 20 accounted for more than 50% of either read. Clean reads were used for subsequent analyses. Sequencing quality was evaluated using raw reads, clean reads, clean bases, overall sequencing error rate, Q20, Q30, and GC content for each sample. Per-base sequencing error-rate and GC-content distributions were also inspected as part of quality assessment. Clean reads were aligned to the human reference genome from the Ensembl database, annotation version Homo sapiensGRCh38.109, using HISAT2 v2.2.1 with default parameters. Gene-level raw read counts were generated using featureCounts v2.0.3 with default parameters. FPKM and TPM values were calculated for descriptive expression-level visualization, whereas raw count matrices were used as input for differential expression analysis. All RNA-seq samples were processed and sequenced together in a single experimental batch by the same sequencing service provider using the same platform and workflow. Therefore, no predefined technical batch covariate, such as library-preparation batch or sequencing run, was available for batch-effect adjustment, and batch-effect correction was not performed. PCA, multidimensional scaling, and sample-distance heatmap analyses were performed as unsupervised sample-level quality assessment and are shown in Supplementary Figure 1–3.
Gene Set Enrichment Analysis
Gene set enrichment analysis (GSEA) was conducted to identify biological processes associated with susceptibility to rebound pain using a ranked list of all expressed genes.26 Genes were ranked according to the differential expression test statistic derived from the RP versus NRP comparison. Enrichment was assessed against Gene Ontology gene sets using the fgsea package. Enrichment significance was evaluated using the normalized enrichment score (NES), and multiple testing across gene sets was controlled using the false discovery rate (FDR). Gene sets with FDR-adjusted P values < 0.05 were considered significantly enriched. Among the significantly enriched gene sets, positively and negatively enriched terms were ranked separately according to the absolute value of NES in descending order. The top 10 positively enriched and top 10 negatively enriched terms were first selected. Within each direction, the five terms with the lowest FDR-adjusted P values were further prioritized as core enriched terms for downstream interpretation and visualization.
Differential RNA Expression Analysis and GO Enrichment Analysis
Differential gene expression (DGE) analysis was performed using DESeq2 v.1.38.327 by comparing the RP group with the NRP group in the age-, and sex-matched RNA-seq cohort. Raw count matrices were normalized using the median-of-ratios method implemented in DESeq2 to account for differences in sequencing depth and RNA composition across samples. P values were adjusted for multiple testing across all tested genes using the Benjamini-Hochberg procedure to control the false discovery rate.28 Fold changes were moderated using adaptive shrinkage. Genes were considered differentially expressed if they met both criteria: |log2FC| ≥ 0.585, corresponding to fold change ≥ 1.5, and FDR-adjusted P value ≤ 0.05.
Protein–Protein Interaction Network and Gene Module Identification
Protein‒protein interaction (PPI) analysis of the DEGs was conducted through the STRING database (https://string-db.org).29 We uploaded the list of DEGs to the STRING database with the following settings: network type: full STRING network, meaning of network edges: confidence, minimum required interaction score: highest confidence (0.4). We subsequently imported the results into Cytoscape (version: v3.10.0) for visualization and subsequent analysis.30 To identify core hub genes, we leveraged the CytoHubba plugin in Cytoscape and evaluated gene connectivity using six canonical scoring approaches: MNC, MCC, EPC, Degree, Stress, and Radiality (full names: Maximum Neighborhood Component, Maximal Clique Centrality, Edge Percolated Component, Degree centrality, Stress centrality, and Radiality centrality).31 Hub genes that appeared in the top 20 rankings of all six methods were ultimately selected as the prioritized hub genes.
Selection of Hub Genes via Machine Learning
Prioritized hub genes initially screened by the Cytohubba plugin were further refined using two machine learning approaches: least absolute shrinkage and selection operator (LASSO) regression and random forest. LASSO regression was implemented using the glmnet R package, and 5-fold cross-validation was performed to determine the optimal regularization parameter (λ). The data was split into five subsets for training and validation, ensuring the model was tested on different portions of the data, which helps reduce overfitting. The optimal λ was selected using λ.1se (one standard error above the minimum λ), which results in a simpler model by limiting the number of selected features, thus reducing the risk of overfitting.32 For Random Forest analysis, the randomForest R package was used, training the model with 800 trees and evaluating gene importance using the MeanDecreaseGini index. Only genes with a MeanDecreaseGini score greater than 1 were retained, ensuring that only the most important genes were included in the final model. Additionally, 10-fold cross-validation was applied to assess the model’s stability and generalizability, further minimizing the possibility of overfitting. By combining results from both methods, three genes were consistently selected.
Predictive Performance Analysis of GYPB
Receiver operating characteristic (ROC) analysis was performed to evaluate the ability of GYPB expression to discriminate between patients with and without rebound pain in the RNA-seq cohort (n = 24; 12 with rebound pain, 12 without rebound pain). ROC curves were constructed using GYPB expression values, and the area under the ROC curve (AUC) was calculated as a measure of overall discriminative performance. To account for the small sample size, 95% confidence intervals for the AUC were estimated using a stratified bootstrap procedure with 5000 resamples, in which samples were resampled with replacement within each outcome group; the 2.5th and 97.5th percentiles of the bootstrap AUC distribution were used as the 95% confidence interval. Statistical significance of the observed AUC was further assessed using a permutation test: group labels were randomly permuted 5000 times, and the AUC was recalculated for each permutation to generate a null distribution. An empirical P value was calculated as the proportion of permuted AUCs greater than or equal to the observed AUC.
Validation of GYPB Expression by qRT-PCR
To independently validate the differential expression of GYPB identified in the discovery cohort, an additional independent validation cohort was recruited for qRT-PCR analysis. This cohort was registered at the Chinese Clinical Trial Registry under the registration number ChiCTR2500099214. The validation cohort included 45 patients, comprising 27 patients in the RP group and 18 patients in the NRP group. Patients were recruited using the same inclusion and exclusion criteria as those applied to the discovery cohort, and peripheral venous blood samples were collected specifically for qRT-PCR confirmation. Total RNA was extracted from peripheral venous blood using TRIzol® reagent (Takara) according to the manufacturer’s protocol. Complementary DNA (cDNA) was synthesized using the PrimeScriptTM RT reagent Kit with gDNA Eraser (Takara). qRT-PCR was performed using SYBR Premix Ex TaqTM II (Takara) on ABI 7500 system. The primers used for qRT‒PCR were as follows:
GYPB Forward: 5′-TGGCAATGCACACTTCAACC-3′,
GYPB Reverse: 5′-GGAGCTGGTACAGTGAAACGA-3′.
Relative mRNA expression was calculated using the 2^−ΔΔCt method, with β-actin as the internal reference gene.
Statistical Analysis
The sample size for the transcriptomic analysis was estimated a priori using a negative binomial model. Assuming a coefficient of variation of 0.3, a minimum fold change of 1.5, and a two-sided significance level of 0.05, 12 patients per group would provide an estimated statistical power of 0.88. Given the exploratory nature of RNA-seq analysis and the limitations of model-based power estimation, these results were interpreted as hypothesis-generating. On the basis of previous studies reporting an incidence of rebound pain after brachial plexus block of 45.2%–56.3%,8 the lower estimate of 45.2% was used to determine the total enrollment requirement. A binomial probability model showed that 37 evaluable patients would provide a >95% probability of identifying at least 12 patients with rebound pain. After allowing for a 10% dropout rate, the planned enrollment sample size was 41 patients. In total, 47 patients were ultimately enrolled.
Statistical analyses were performed with R software (version: 4.5.1) and IBM SPSS Statistics (version: 26.0). Prior to analysis, the Shapiro–Wilk test was applied to verify the normality of continuous variables. Continuous variables with a normal distribution were summarized as the mean (± standard deviation, SD) and were compared between the two groups via independent-samples t tests; those with a non-normal distribution were reported as the median (25th–75th percentile, IQR) and were analyzed via the Wilcoxon rank-sum test (Mann–Whitney U-test). Statistical significance was defined as a two-tailed P value < 0.05 for all analyses. Given the limited sample size, multivariable analysis was not performed because the number of events per variable would be limited. Potential confounding was therefore addressed by baseline comparisons and propensity score matching for the transcriptomic analysis.
Results
Characteristics of the Participants
From April 2024 to September 2024, 51 consecutive patients met the inclusion criteria. Among these, 3 patients had their anesthesia method changed, and 1 patient refused postoperative blood sampling. These 4 patients were not included in the final analysis, resulting in 47 patients being analyzed. The 47 patients were stratified into the RP group and NRP group according to the definition of rebound pain. For transcriptome analysis, a matched subset was generated using 1:1 nearest-neighbor propensity score matching based on age and sex. This matching procedure yielded 12 matched pairs, including 12 patients in the RP group and 12 patients in the NRP group. No additional patients were excluded after matching.
Baseline characteristics were compared between the RP group (n=28) and the NRP group (n=19) (Table 1). No significant differences were observed in demographic variables (age, BMI), hematological parameters (WBC, NEUT, and LYM counts), procedural variables (tourniquet application time, ropivacaine dose), sex distribution, comorbidities (cerebrovascular disease, hypertension, diabetes mellitus), education level, ASA classification (II/III), nerve block site, or surgical type (P >0.05). However, two procedural indicators differed significantly between the two cohorts: surgical time (median [interquartile range]: 85.00 [60.00, 98.25] min in the RP group vs. 70.00 [49.00, 74.50] min in the NRP group; P<0.05) and PCA sufentanil dose (mean ± SD, 275.14±12.36 μg in the RP group vs. 207.42±11.46 μg in the NRP group; P<0.05).
 |
Table 1 Demographic and Clinical Data |
To evaluate whether whole-blood transcriptomic differences might be influenced by blood-cell composition, we further compared CIBERSORT-estimated leukocyte fractions and routinely measured preoperative hematological indices in the RNA-seq cohort. The top ten estimated leukocyte subsets showed no systematic group-wide separation between RP and NRP samples. Similarly, no significant between-group differences were observed in RBC, HGB, HCT, MCV, MCH, MCHC, RDW-SD, or RDW-CV. These exploratory analyses are shown in Supplementary Figures 4–5.
GSEA Enrichment Results Against the GO Database
GSEA of GO terms revealed distinct transcriptional programs associated with susceptibility to rebound pain. The gene sets related to ribosome biogenesis, rRNA maturation, ncRNA processing, tRNA processing, and catalytic activity acting on tRNA were significantly enriched at the positive end of the ranked gene list (Figure 1A). These enrichment patterns suggest enhanced translational capacity and RNA-processing activity in patients with rebound pain.
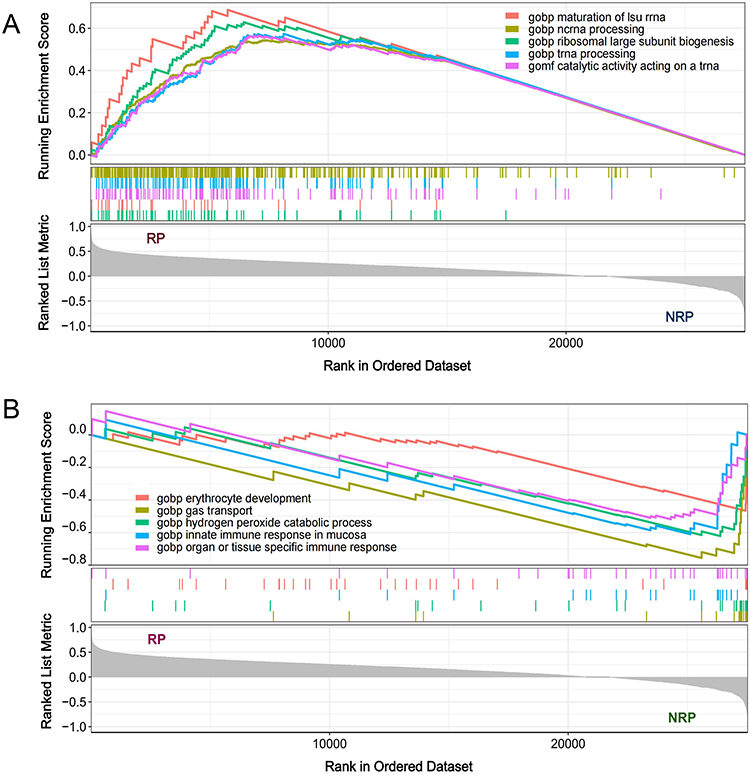 |
Figure 1 GSEA of GO pathways between rebound pain and non-rebound pain patients. (A) GSEA plot of top 5 most significantly upregulated GO pathways with smallest adjusted P values in RP patients, enriched in positive-value gene regions. (B) GSEA plot of top 5 most significantly downregulated GO pathways with smallest adjusted P values in RP patients, enriched in negative-value gene regions. |
In contrast, gene sets associated with erythrocyte development, gas transport, hydrogen peroxide catabolic process, innate immune response in mucosa, and organ- or tissue-specific immune response were preferentially enriched at the negative end of the ranked gene list (Figure 1B). These enrichment patterns may reflect peripheral blood transcriptomic alterations, although their mechanistic relevance to rebound pain remains to be further established. Detailed GSEA data for GO terms are provided in Supplementary Table 1.
Analysis of Differential Genes and Enriched Pathways
Among the 27,551 genes detected in both RP and NRP groups, 110 were identified as differentially expressed genes (DEGs), including 108 upregulated and 2 downregulated DEGs (Figure 2A). The distribution of upregulated and downregulated DEGs is visualized in a volcano plot, and the 10 DEGs with the largest fold changes are annotated (Figure 2B). Heatmap analysis of the DEGs revealed that samples from the RP and NRP groups clustered distinctly: the RP samples were primarily distributed on the left side with relatively high expression, whereas the NRP samples were mainly concentrated on the right side with relatively low expression (Figure 2C). Detailed DEG data was provided in Supplementary Table 2. The raw sequencing data have been deposited in the NCBI SRA (BioProject: PRJNA1392155).
 |
Figure 2 Identification of DEGs between rebound pain patients and non-rebound pain patients. (A) Number of upregulated and downregulated genes. (B) Volcano plot of DEGs. The upregulated genes are marked in red; the downregulated genes are marked in blue. (C) Heatmap showing the DEGs between rebound pain patients and non-rebound pain patients. |
GO analysis revealed that differentially expressed genes were predominantly enriched in erythrocyte related biological processes, including erythrocyte development, erythrocyte differentiation, erythrocyte homeostasis, and hemoglobin metabolic process. In addition, pathways involved in myeloid cell development and differentiation, gas transport, and iron ion homeostasis were also significantly overrepresented. Genes such as ALAS2, AHSP, EPB42, SLC4A1, RHAG, TAL1, KLF1, and BPGM contributed to these enriched terms, indicating the presence of erythrocyte- and hemoglobin-related transcriptional signals in the differential expression profile (Figure 3). Detailed GO enrichment data was provided in Supplementary Table 3.
 |
Figure 3 GO enrichment analysis of differentially expressed genes between patients with rebound pain and non-rebound pain. Top 10 GO biological processes enriched among differentially expressed genes between rebound pain and non-rebound pain patients, together with representative shared genes contributing to each pathway, ranked by adjusted P value. |
PPI Network Analysis of DEGs
DEGs were entered into the STRING database for PPI network construction and 65 nodes and 500 edges were ultimately identified from the resulting network (Figure 4A). In addition, we identified the hub cluster with the genes shared by the top 20 hub genes ranked by each of the six different CytHubba algorithms, which consisted of 13 genes (Figure 4B). The hub gene cluster containing 13 genes (SLC4A1, GYPB, EPB42, AHSP, ALAS2, ANK1, BPGM, CA1, HBM, KLF1, OSBP2, RHAG, SNCA) exhibited prominent clustering characteristics in the PPI network (Figure 4C).
 |
Figure 4 Protein–protein interactions (PPIs) between DEGs and selection of hub genes. (A) PPI network (110 DEGs filtered into the PPI network that contained 162 nodes and 756 edges). (B) Distribution of common genes among the top 20 hub genes identified by different CytHubba algorithms. (C) Hub gene cluster containing 13 genes identified by different CytHubba algorithms. |
Identification of the Hub Gene GYPB
Based on the 13 candidate hub genes screened from the hub cluster using CytoHubba, we applied LASSO regression and random forest analyses to identify genes associated with the occurrence of rebound pain. Following the 5-fold cross-validation procedure, LASSO regression identified three hub genes associated with rebound pain in the model (Figure 5A). Random forest analysis identified three hub genes associated with rebound pain (Figure 5B). Intersecting the results from the two methods yielded one shared hub gene (Figure 5C). Accordingly, GYPB was selected as a candidate gene for subsequent predictive analysis and experimental validation.
 |
Figure 5 Identification of hub genes via two machine learning strategies. (A) Coefficient profiles corresponding to the log(λ) sequence derived from the LASSO regression model. The optimal λ value was determined using 5-fold cross-validation and the λ.1se criterion. (B) The random forest algorithm was utilized to screen 3 hub genes, all of which presented MeanDecreaseGini values greater than 1. (C) Venn diagram depicting the overlapping gene set identified by the two machine learning approaches. |
Validation of the Predictive Performance of GYPB for Rebound Pain
ROC analysis was performed to assess the predictive performance of GYPB expression for distinguishing RP from NRP patients in 24 samples, including 12 patients in each group. The AUC was 0.792, with a stratified bootstrap 95% CI of 0.585–0.999, suggesting preliminary discriminative ability with limited precision due to the small sample size (Figure 6A).
 |
Figure 6 ROC analysis and permutation test evaluating the discriminative performance of GYPB for rebound pain. (A) ROC curve illustrating the ability of GYPB expression to distinguish RP from NRP patients (AUC = 0.792, 95% CI: 0.585–0.999). (B) Distribution of AUC values derived from 5000 permutation tests; the red dashed line denotes the observed AUC based on GYPB expression, with a permutation P value of 0.013. |
To further evaluate whether the observed discriminative performance could be attributed to random chance, a permutation test was performed using 5000 random label permutations. The observed AUC of 0.792 was significantly higher than the majority of permuted AUCs (P = 0.013) (Figure 6B). Nevertheless, given the small sample size, this result should be regarded as exploratory and requires validation in a larger independent cohort.
Validation of GYPB Through qRT-PCR
RNA-seq differential expression analysis revealed a statistically significant upregulation of GYPB in the RP group (P < 0.05) (Figure 7A). To further validate this expression signature, qRT-PCR was performed using preoperative peripheral blood samples from an independent validation cohort of 45 patients, including 27 patients in the RP group and 18 patients in the NRP group. The detailed demographic and clinical characteristics of this validation cohort are provided in Supplementary Table 4. To maintain consistency with the transcriptome analysis, the same 1:1 nearest-neighbor propensity score matching method based on age and sex was applied to the validation cohort using a maximum matching strategy, yielding 15 matched pairs for qRT-PCR analysis. In this matched validation subset, qRT-PCR analysis showed that GYPB mRNA expression was significantly higher in RP patients than in NRP patients, corresponding to a 3.390-fold increase (RP: n = 15; NRP: n = 15; 95% CI: 1.258–3.523; P < 0.05) (Figure 7B).
 |
Figure 7 Expression profiles of GYPB in RNA sequencing and qPCR assays. (A) The expression level of GYPB in the RP group was significantly greater than that in the NRP group. (B) The qPCR assays further confirmed that the relative mRNA abundance of GYPB in the RP group was markedly greater than that in the NRP group. Statistical significance is indicated as follows: *P < 0.05; ***P < 0.001. |
Discussion
This prospective transcriptomic study identified a distinctive preoperative gene signature in patients who developed rebound pain after brachial plexus block. Among the differentially expressed transcripts, GYPB showed the most consistent association, with higher expression confirmed in an independent cohort. These findings raise the possibility that preoperative systemic hematologic-related transcriptomic patterns, particularly erythrocyte homeostasis and erythrocyte-mediated gas transport signatures, may be associated with interindividual differences in pain escalation after sensory block resolution.
The preoperative alterations in the erythroid signature observed in this study may help generate exploratory biomarker hypotheses for rebound pain susceptibility. Among these signals, GYPB emerged as a key representative gene of interest. GYPB, which encodes glycophorin B, stabilizes the erythrocyte membrane and mediates interactions between red blood cells, vascular endothelium and immune components.33–35 These findings raise the hypothesis that erythroid-related systemic physiology may be linked to rebound pain susceptibility, but they do not establish a direct mechanistic relationship between erythrocyte biology, tissue oxygenation, and pain sensitivity.
Recent research focusing on surgical and neuropathic pain has focused on the role of systemic physiology in modulating pain vulnerability.36–38 When systemic stressors such as operative anemia occur, they may impair perioperative rehabilitation and negatively influence clinical outcomes.39,40 Although direct evidence linking erythrocyte biology to rebound pain after regional anesthesia is limited, studies in other pain conditions provide indirect biological plausibility for a relationship between oxygenation-related physiology and pain phenotypes. For example, in complex regional pain syndrome, near-infrared spectroscopy studies have shown reduced deep tissue oxygen saturation in the affected limb, findings that have been correlated with pain intensity and functional impairment.41 In parallel, leukocyte transcriptome profiling after trauma has highlighted heme-handling programs that track systemic inflammatory severity and septic complications,42 and blood transcriptomics has been used to explore susceptibility to persistent pain phenotypes in other clinical contexts.22,43 In our study, GO and GSEA analyses suggested erythrocyte function, gas transport, ribosomal, and RNA-processing-related transcriptomic differences between RP and NRP groups. Collectively, these findings suggest that erythroid-related transcriptomic variation may be associated with rebound pain susceptibility, although the underlying mechanistic relationship remains to be clarified. Although blood-cell composition, systemic inflammation, and perioperative stress-related states remain possible alternative explanations, exploratory CIBERSORT and routine hematological analyses did not reveal systematic group-wide differences between RP and NRP samples; however, residual confounding cannot be fully excluded.
These preoperative transcriptomic signatures may represent preliminary biomarker candidates for rebound pain susceptibility following brachial plexus block. These findings suggest that individual hematologic-related characteristics before surgery could be associated with rebound pain susceptibility after neural blockade resolves. From a clinical perspective, they may encourage future studies evaluating whether preoperative hemoglobin trends, red-cell indices, oxygenation status, and transcriptomic information could improve risk stratification in patients scheduled for regional anesthesia. This perspective is consistent with existing patient blood management and enhanced recovery frameworks,44 and may conceptually complement them by highlighting physiological variation not fully captured by routine laboratory tests.45 However, clinical application of these transcriptomic markers remains premature and will require validation in larger independent cohorts.
This study has several limitations that should be acknowledged. Its modest sample size and single-center design limit generalizability. Additionally, the observational nature of the data means that causal relationships cannot be established. Although exploratory CIBERSORT and routine hematological analyses did not reveal systematic group-wide differences between RP and NRP samples, residual confounding from unmeasured blood-cell composition, systemic inflammation, or perioperative stress-related physiology cannot be fully excluded. In addition, the modest RNA-seq sample size limited the feasibility of comprehensive adjusted multivariable modeling. The group differences in operative time and sufentanil consumption could introduce residual confounding, although we attempted to mitigate these influences in our analyses. Although ROC curve analysis combined with permutation testing was employed to evaluate the discriminative performance of the model in this study, the relatively small sample size may limit the stability of the AUC estimates and the statistical power of the permutation test. Consequently, these findings should be interpreted as preliminary and hypothesis-generating, and further validation in larger, independent cohorts with appropriate adjustment for clinical and biological confounders is warranted.
Conclusion
These findings suggest that preoperative GYPB upregulation and erythroid-related whole-blood transcriptomic signatures are associated with rebound pain following brachial plexus block. This association may reflect baseline hematologic-related physiological variation, but should be considered preliminary and requires validation in larger independent cohorts with appropriate adjustment for clinical and biological confounders.
Data Sharing Statement
The data that support the findings of this study are available upon request from the corresponding author.
Ethics Approval and Consent to Participate
Informed consent was obtained from all participants, and approval was granted by the Ethics Committee of Xiangyang Central Hospital, Affiliated Hospital of Hubei University of Arts and Science, Xiangyang, China (Approval No. 2024-008 and No. 2025-032).
Acknowledgments
We would like to express our gratitude to Professor Lei Zhang from the Department of Anesthesiology, The First Affiliated Hospital of Anhui Medical University, and Professor Xihong Ye from the Department of Anesthesiology, Xiangyang Central Hospital, Affiliated Hospital of Hubei University of Arts and Science, Xiangyang, Hubei, for their assistance and guidance in the experiment.
Author Contributions
All authors made a significant contribution to the work reported, whether that is in the conception, study design, execution, acquisition of data, analysis and interpretation, or in all these areas; took part in drafting, revising or critically reviewing the article; gave final approval of the version to be published; have agreed on the journal to which the article has been submitted; and agree to be accountable for all aspects of the work.
Disclosure
The authors declare that they have no competing interests.
References
1. Yin W, Luo D, Mi H, et al. Rebound pain after peripheral nerve block: a review. Drugs. 2025;85(8):991–15. doi:10.1007/s40265-025-02196-8
2. Chung AR, Mather RV, Gutierrez R, et al. Association of peripheral nerve blocks with increased postoperative pain and opioid use in orthopaedic surgery: a single-centre retrospective cohort study. Br J Anaesth. 2025;135(5):1286–1296. doi:10.1016/j.bja.2025.05.030
3. Cunningham DJ, LaRose M, Zhang G, et al. Regional anesthesia associated with decreased inpatient and outpatient opioid demand in tibial plateau fracture surgery. Anesthesia Analg. 2022;134(5):1072–1081. doi:10.1213/ANE.0000000000005980
4. Williams BA, Bottegal MT, Kentor ML, Irrgang JJ, Williams JP. Rebound pain scores as a function of femoral nerve block duration after anterior cruciate ligament reconstruction: retrospective analysis of a prospective, randomized clinical trial. Reg Anesth Pain Med. 2007;32(3):186–192. doi:10.1016/j.rapm.2006.10.011
5. Hamilton DL. Rebound pain: distinct pain phenomenon or nonentity? Br J Anaesth. 2021;126(4):761–763. doi:10.1016/j.bja.2020.12.034
6. Hade AD, Okano S, Pelecanos A, Chin A. Factors associated with low levels of patient satisfaction following peripheral nerve block. Anaesth Intensive Care. 2021;49(2):125–132. doi:10.1177/0310057X20972404
7. Muñoz-Leyva F, Cubillos J, Chin KJ. Managing rebound pain after regional anesthesia. Kor J Anesthesiol. 2020;73(5):372–383. doi:10.4097/kja.20436
8. Barry GS, Bailey JG, Sardinha J, Brousseau P, Uppal V. Factors associated with rebound pain after peripheral nerve block for ambulatory surgery. Br J Anaesth. 2021;126(4):862–871. doi:10.1016/j.bja.2020.10.035
9. Uppal V, Barry G, Ke JX, et al. Reducing rebound pain severity after arthroscopic shoulder surgery under general anesthesia and interscalene block: a two-centre randomized controlled trial of pre-emptive opioid treatment compared with placebo. Canad J Anaesthes J Canad D’anesthesie. 2024;71(6):773–783. doi:10.1007/s12630-023-02594-0
10. Singh NP, Makkar JK, Chawla JK, Sondekoppam RV, Singh PM. Prophylactic dexamethasone for rebound pain after peripheral nerve block in adult surgical patients: systematic review, meta-analysis, and trial sequential analysis of randomised controlled trials. Br J Anaesth. 2024;132(5):1112–1121. doi:10.1016/j.bja.2023.09.022
11. Lindberg MF, Miaskowski C, Rustøen T, et al. The impact of demographic, clinical, symptom and psychological characteristics on the trajectories of acute postoperative pain after total knee arthroplasty. Pain Med. 2017;18(1):124–139. doi:10.1093/pm/pnw080
12. Kleggetveit IP, Namer B, Schmidt R, et al. High spontaneous activity of C-nociceptors in painful polyneuropathy. Pain. 2012;153(10):2040–2047. doi:10.1016/j.pain.2012.05.017
13. Marinelli S, Basilico B, Marrone MC, Ragozzino D. Microglia-neuron crosstalk: signaling mechanism and control of synaptic transmission. Semin Cell Dev Biol. 2019;94:138–151. doi:10.1016/j.semcdb.2019.05.017
14. Verlinde M, Hollmann MW, Stevens MF, Hermanns H, Werdehausen R, Lirk P. Local anesthetic-induced neurotoxicity. Int J Mol Sci. 2016;17(3):339. doi:10.3390/ijms17030339
15. Sunderland S, Yarnold CH, Head SJ, et al. Regional versus general anesthesia and the incidence of unplanned health care resource utilization for postoperative pain after wrist fracture surgery: results from a retrospective quality improvement project. Reg Anesth Pain Med. 2016;41(1):22–27. doi:10.1097/AAP.0000000000000325
16. Hewson DW, Bedforth NM, Hardman JG. Peripheral nerve injury arising in anaesthesia practice. Anaesthesia. 2018;73 Suppl 1:51–60. doi:10.1111/anae.14140
17. Vecchio M, Chiaramonte R, Romano M, Pavone P, Musumeci G, Mauro GL. A systematic review of pharmacologic and rehabilitative treatment of small fiber neuropathies. Diagnostics. 2020;10(12). doi:10.3390/diagnostics10121022
18. Grace PM, Hurley D, Barratt DT, et al. Harnessing pain heterogeneity and RNA transcriptome to identify blood-based pain biomarkers: a novel correlational study design and bioinformatics approach in a graded chronic constriction injury model. J Neurochem. 2012;122(5):976–994. doi:10.1111/j.1471-4159.2012.07833.x
19. Chiabrando D, Fiorito V, Petrillo S, Bertino F, Tolosano E. HEME: a neglected player in nociception? Neurosci Biobehav Rev. 2021;124:124–136. doi:10.1016/j.neubiorev.2021.01.011
20. Chiabrando D, Mercurio S, Tolosano E. Heme and erythropoieis: more than a structural role. Haematologica. 2014;99(6):973–983. doi:10.3324/haematol.2013.091991
21. Gautam A, Donohue D, Hoke A, et al. Investigating gene expression profiles of whole blood and peripheral blood mononuclear cells using multiple collection and processing methods. PLoS One. 2019;14(12):e0225137. doi:10.1371/journal.pone.0225137
22. Dorsey SG, Renn CL, Griffioen M, et al. Whole blood transcriptomic profiles can differentiate vulnerability to chronic low back pain. PLoS One. 2019;14(5):e0216539. doi:10.1371/journal.pone.0216539
23. Parisien M, Lima LV, Dagostino C, et al. Acute inflammatory response via neutrophil activation protects against the development of chronic pain. Sci Trans Med. 2022;14(644):eabj9954. doi:10.1126/scitranslmed.abj9954
24. von Elm E, Altman DG, Egger M, Pocock SJ, Gøtzsche PC, Vandenbroucke JP. The strengthening the reporting of observational studies in epidemiology (STROBE) statement: guidelines for reporting observational studies. Lancet. 2007;370(9596):1453–1457. doi:10.1016/S0140-6736(07)61602-X
25. Jen TTH, Ke JX, Wing KJ, et al. Development and internal validation of a multivariable risk prediction model for severe rebound pain after foot and ankle surgery involving single-shot popliteal sciatic nerve block. Br J Anaesth. 2022;129(1):127–135. doi:10.1016/j.bja.2022.03.030
26. Subramanian A, Tamayo P, Mootha VK, et al. Gene set enrichment analysis: a knowledge-based approach for interpreting genome-wide expression profiles. Proc Natl Acad Sci USA. 2005;102(43):15545–15550. doi:10.1073/pnas.0506580102
27. Love MI, Huber W, Anders S. Moderated estimation of fold change and dispersion for RNA-seq data with DESeq2. Genome Biol. 2014;15(12):550. doi:10.1186/s13059-014-0550-8
28. Korthauer K, Kimes PK, Duvallet C, et al. A practical guide to methods controlling false discoveries in computational biology. Genome Biol. 2019;20(1):118. doi:10.1186/s13059-019-1716-1
29. Liu Q, Zheng J, Sun W, et al. A proximity-tagging system to identify membrane protein-protein interactions. Nat Meth. 2018;15(9):715–722. doi:10.1038/s41592-018-0100-5
30. Shannon P, Markiel A, Ozier O, et al. Cytoscape: a software environment for integrated models of biomolecular interaction networks. Genome Res. 2003;13(11):2498–2504. doi:10.1101/gr.1239303
31. Chin CH, Chen SH, Wu HH, Ho CW, Ko MT, Lin CY. cytoHubba: identifying hub objects and sub-networks from complex interactome. BMC Syst Biol. 2014;8 Suppl 4(Suppl 4):S11. doi:10.1186/1752-0509-8-S4-S11
32. Zhang L, Liang X. Bayesian regularization in multiple-indicators multiple-causes models. Psychol Meth. 2024;29(4):679–703. doi:10.1037/met0000594
33. Siebert PD, Fukuda M. Molecular cloning of a human glycophorin B cDNA: nucleotide sequence and genomic relationship to glycophorin A. Proc Natl Acad Sci USA. 1987;84(19):6735–6739. doi:10.1073/pnas.84.19.6735
34. Hassan SN, Thirumulu Ponnuraj K, Mohamad S, Hassan R, Wan Ab Rahman WS. Molecular detection of glycophorins A and B variant phenotypes and their clinical relevance. Transfusion Med Rev. 2019;33(2):118–124. doi:10.1016/j.tmrv.2019.02.003
35. Deb B, Das A, Vilvadrinath R, et al. Glycophorin B-PfEMP1 interaction mediates robust rosetting in Plasmodium falciparum. Int J Biol Macromol. 2024;262(Pt 1):129868. doi:10.1016/j.ijbiomac.2024.129868
36. Finnerup NB, Attal N, Haroutounian S, et al. Pharmacotherapy for neuropathic pain in adults: a systematic review and meta-analysis. Lancet Neurol. 2015;14(2):162–173. doi:10.1016/S1474-4422(14)70251-0
37. Kehlet H, Jensen TS, Woolf CJ. Persistent postsurgical pain: risk factors and prevention. Lancet. 2006;367(9522):1618–1625. doi:10.1016/S0140-6736(06)68700-X
38. Zouikr I, Bartholomeusz MD, Hodgson DM. Early life programming of pain: focus on neuroimmune to endocrine communication. J Transl Med. 2016;14(1):123. doi:10.1186/s12967-016-0879-8
39. McCormack G, Faraoni D, DiNardo JA, Goobie SM. Association between preoperative anaemia, transfusion, and outcomes in children undergoing noncardiac surgery. Br J Anaesth. 2025;135(2):375–381. doi:10.1016/j.bja.2025.04.050
40. Desai N, Schofield N, Richards T. Perioperative patient blood management to improve outcomes. Anesthesia Analg. 2018;127(5):1211–1220. doi:10.1213/ANE.0000000000002549
41. Garzón SJ, Poveda DS, Guardo LA, et al. Evaluation through transcutaneous tissue oximetry (near infrared spectroscopy) of spinal cord stimulation in patients with complex regional pain syndrome type I. Neuromodulation. 2020;23(5):698–703. doi:10.1111/ner.12931
42. Tullie S, Nicholson T, Bishop JRB, et al. Severe thermal and major traumatic injury results in elevated plasma concentrations of total heme that are associated with poor clinical outcomes and systemic immune suppression. Front Immunol. 2024;15:1416820. doi:10.3389/fimmu.2024.1416820
43. Kang JH. Transcriptomes in peripheral blood of young females with temporomandibular joint osteoarthritis. Scient Rep. 2021;11(1):8872. doi:10.1038/s41598-021-88275-8
44. Mueller MM, Van Remoortel H, Meybohm P, et al. Patient blood management: recommendations from the 2018 frankfurt consensus conference. JAMA. 2019;321(10):983–997. doi:10.1001/jama.2019.0554
45. Rittirsch D, Schoenborn V, Lindig S, et al. An Integrated Clinico-transcriptomic Approach Identifies a Central Role of the Heme Degradation Pathway for Septic Complications after Trauma. Ann Surg. 2016;264(6):1125–1134. doi:10.1097/SLA.0000000000001553
 © 2026 The Author(s). This work is published and licensed by Dove Medical Press Limited. The
full terms of this license are available at https://www.dovepress.com/terms
and incorporate the Creative Commons Attribution
- Non Commercial (unported, 4.0) License.
By accessing the work you hereby accept the Terms. Non-commercial uses of the work are permitted
without any further permission from Dove Medical Press Limited, provided the work is properly
attributed. For permission for commercial use of this work, please see paragraphs 4.2 and 5 of our Terms.
© 2026 The Author(s). This work is published and licensed by Dove Medical Press Limited. The
full terms of this license are available at https://www.dovepress.com/terms
and incorporate the Creative Commons Attribution
- Non Commercial (unported, 4.0) License.
By accessing the work you hereby accept the Terms. Non-commercial uses of the work are permitted
without any further permission from Dove Medical Press Limited, provided the work is properly
attributed. For permission for commercial use of this work, please see paragraphs 4.2 and 5 of our Terms.