Back to Journals » Drug Design, Development and Therapy » Volume 20
An Efficient Pharmacogenomic Assay for Psychotropic Drugs by Multiplex Fluorescence Melting Curve Analysis
Authors Zheng J, Zou Q, Wang C, Yang Q, Ren J ![]() , Cao X, Wang H
, Cao X, Wang H ![]() , Gao H
, Gao H
Received 4 December 2025
Accepted for publication 21 April 2026
Published 4 June 2026 Volume 2026:20 586665
DOI https://doi.org/10.2147/DDDT.S586665
Checked for plagiarism Yes
Review by Single anonymous peer review
Peer reviewer comments 2
Editor who approved publication: Prof. Dr. Georgios Panos
Jun Zheng,1,* Qiqi Zou,2,3,* Chuyan Wang,1 Qianqian Yang,2 Jiuyu Ren,2,3 Xiangyue Cao,2 Huijuan Wang,2,3 Hui Gao1
1Department of Anesthesiology, Affiliated Hospital of Yan’an University, Yan’an, Shaanxi, 716000, People’s Republic of China; 2National Engineering Research Center for Miniaturized Detection Systems, College of Life Science, Northwest University, Xi’an, Shaanxi, 710069, People’s Republic of China; 3Shaanxi Lifegen Co. Ltd, Xi’an, Shaanxi, 710068, People’s Republic of China
*These authors contributed equally to this work
Correspondence: Hui Gao, Department of Anesthesiology, Affiliated Hospital of Yan’an University, No. 43, Beida Street, Baota District, Yan’an, Shaanxi, 716000, People’s Republic of China, Email [email protected] Huijuan Wang, College of Life Science, Northwest University, No. 229 North Taibai Road, Beilin District, Xi’an, Shaanxi, 710069, People’s Republic of China, Email [email protected]
Background: Long-term pharmacotherapy is the primary approach for alleviating the symptoms of mental disorders. Numerous pharmacogenomic studies have confirmed that genetic polymorphisms are key factors underlying inter-ethnic and inter-individual differences in drug response. Pharmacogenomic testing is an essential pathway to achieve precision medicine.
Methods: In this study, seven common single nucleotide polymorphisms (SNPs) closely associated with the efficacy of antidepressants, and antipsychotics were screened and identified through comprehensive literature retrieval and mining of authoritative databases. These SNPs are located in the ANKK1, DRD2, FKBP5, GRIK4, HTR1A, HTR2A, and MC4R genes. Utilizing multiplex fluorescence melting curve analysis (mFMCA), a four-channel multiplex fluorescent PCR system was successfully established, enabling the simultaneous genotyping of 14 distinct alleles across 7 SNP loci in a single tube. Analytical performance including sensitivity and specificity as well as reproducibility was rigorously evaluated. Specifically, a two phase validation was conducted. An initial calibration phase using 98 clinical samples within a training cohort was used to establish integrative genotyping criteria. These criteria combined statistical melting temperature (Tm) intervals, defined as the Mean Tm± 3 standard deviations (SDs), with peak morphology. The established criteria were then evaluated in a blinded validation phase using an independent cohort of 124 clinical samples.
Results: The mFMCA system can accurately detect genomic DNA at concentrations as low as 100 copies/μL, and exhibits high specificity and no cross-reactivity. In the validation cohort (n=124), the mFMCA-derived genotypes achieved 100% concordance with Sanger sequencing. Furthermore, the high stability of the system was further evidenced by its consistent performance across varying DNA concentrations, different clinical samples, and multiple instruments.
Conclusion: This study successfully established a dedicated and cost-effective mFMCA assay for psychotropic pharmacogenomic testing. The method provides an efficient, accurate, rapid, economical tool for personalized medicine in psychiatric care.
Keywords: multiplex qPCR, melting curve, SNP, mental diseases, personalized medicine
Introduction
Common mental disorders often need long-term psychiatric medications (antidepressants, antipsychotics, etc.), which are proven effective.1 Yet without reliable treatment outcome predictors, clinicians mostly use empiricism or trial-and-error to select drugs and adjust doses.2 This leads to prolonged medication trials for patients, or ineffective symptom control and adverse reactions.3,4 In 8–12 week trials with selective serotonin reuptake inhibitors (SSRI), non-response was observed in 17.61% of patients.5,6 A meta-analysis found the number of dropouts due to adverse effects of antidepressants was 85 per 1000, which means the treatment with antidepressants increases the risk of adverse effects by 49%, compared to placebo.7 In about 20% to 30% of schizophrenia cases, the patients fail to respond to two or more first-line antipsychotic medications that are properly dosed and of sufficient duration.8 While the source of inter-individual variability in response to psychotropic drugs is not completely understood, genetics is a major contributing factor.9
Pharmacogenetic and pharmacogenomic studies have confirmed that nucleotide polymorphisms in multiple genes contribute to the efficacy and safety of psychotropic drugs.10 The most clinical relevant genetic polymorphisms are located in drug-metabolizing enzyme (DME) genes, primarily represented by CYP2D6, CYP2C19, and CYP2C9. Polymorphisms in these genes alter the metabolic and clearance rates of drugs, which may in turn affect the dosage, efficacy, and tolerability of the medications. International authoritative organizations, such as the Clinical Pharmacogenetics Implementation Consortium (CPIC) and the Dutch Pharmacogenetics Working Group (DPWG), have released guidelines specifying how to adjust the dosages of antidepressants and antipsychotics based on the genotypes of DME genes.11–13 In recent years, accumulating evidence from further studies has revealed that functional variants in pharmacodynamic-related genes also modulate the efficacy and adverse events of psychotropic drugs by altering an individual’s sensitivity to these medications.14 Specifically, genes encoding drug targets for currently available antipsychotics and antidepressants, such as DRD2 (Dopamine Receptor D2), HTR1A (5-Hydroxytryptamine Receptor 1A), and HTR2A (5-Hydroxytryptamine Receptor 2A),15–20 play a pivotal role. In the Chinese population, the DRD2 rs1799732 (−141C Ins/Del) polymorphism has been validated to significantly affect clinical response of antipsychotics.15,21 Similarly, the rs6295 variant (C-1019G) in the HTR1A gene and the rs6313 (c.102T/C) variant in the HTR2A gene have been confirmed as key modulators of antidepressant and antipsychotic efficacy among Chinese psychiatric patients.15,19,22,23 Furthermore, functional variants in genes coding pivotal proteins involved in neuroprotection and stress-response, such as rs1954787 in GRIK4 (Glutamate Receptor Ionotropic, Kainate 4), rs1800497 in ANKK1 (Ankyrin Repeat And Kinase Domain Containing 1), and rs4713916 in FKBP5 (FK506-Binding Protein 5), have been shown to influence treatment response and susceptibility to adverse drug reactions in multiple populations, including Han Chinese.24–31 Additionally, the melanocortin 4 receptor (MC4R) rs489693 polymorphism is closely linked to antipsychotic-induced weight gain (AIWG) in Chinese patients, which remains a significant challenge in long-term psychiatric treatment.32 On this basis, a series of prospective clinical studies have conducted, and their findings demonstrated that genetic testing-particular multigene pharmacogenomic testing—can significantly improve patient outcomes in psychiatric treatment, shorten the “trial-and-error period” of medication selection, and reduce overall medical expenditures.33–35 Therefore, multigene pharmacogenomic testing is expected to become an effective tool for guiding individualized pharmacotherapy in the field of psychiatry.33
Pharmacogenomic testing is a crucial step in promoting the translation of pharmacogenomics knowledge into clinical practice. Accurate, rapid, and convenient pharmacogenetic tests serve as the core carriers and tools for achieving this translation.14 Currently, a variety of commercial reagents and tools for DME gene testing are available. For instance, the Amplichip® CYP450 Genotyping Chip, developed by Roche, is the first pharmacogenomic chip approved by the U.S. Food and Drug Administration (FDA) for clinical use.36 In China, the National Medical Products Administration (NMPA) has approved dozens of kits for detecting CYP gene polymorphisms.37 However, to date, methods and reagents for detecting pharmacodynamic-related genetic polymorphisms that affect psychiatric drug responses remain relatively scarce. Currently, the commonly used methods for single nucleotide polymorphisms (SNP) detection include PCR-based technologies, sequencing technologies, and MassARRAY DNA mass spectrometry, etc.38,39 Among these, the fluorescent PCR method has become one of the mainstream detection technologies owing to its advantages of rapidity, high sensitivity, closed-tube operation, ease of interpretation, and cost-effectiveness. As the most widely used molecular diagnostic technology, fluorescent PCR assays employing TaqMan probes typically require dual probes (targeting wild-type and mutant alleles) for SNP genotyping.40 This requirement, coupled with the limited number of available fluorescence detection channels (usually 4–6), imposes a severe constraint on multiplexing capability, usually restricting the detection of only 2–3 SNP loci per reaction. In recent years, melting curve analysis technology based on dual-labeled probes has significantly improved detection throughput by integrating multicolor fluorescence with melting curves characterized by specific melting temperatures (Tm).41 Within this technical system, only one fluorescent probe is required: accurate SNP genotyping can be achieved by analyzing the shifts in the melting curves of the double strands formed by the fluorescent probe with fully matched templates and mismatched templates. Leveraging fluorescence melting curve analysis (FMCA) on a standard 4-channel real-time PCR platform enables the simultaneous detection of 8 SNP loci in a single tube with just 8 TaqMan probes. In contrast, the conventional qPCR method would require 4 reaction tubes and 16 fluorescent probes. Thus, while increasing the throughput by four-fold, FMCA also reduces the cost of probe consumption by half. To date, reports of pharmacogenomic tests that leverage this technology to target PD-related genes to guide antipsychotic medication remain scarce.
In this study, a multiplex fluorescence melting curve analysis (mFMCA) was successfully developed to simultaneously detect seven SNP loci in a single tube. All these targeted variants are closely associated with antipsychotic drug response and are cataloged in the PharmGKB database with relatively high levels of evidence. Furthermore, each of these SNPs exhibits a frequency of over 5% in the Chinese population, ensuring the clinical relevance and robustness of this multiplex assay for personalized psychiatric treatment. The core performance and clinical application value of this assay were systematically validated using plasmid standards and clinical samples. The establishment of this assay system not only fills the gap in existing pharmacogenomic detection technologies and reagents but also holds great significance for advancing the clinical practice and research progress of “genotype-guided individualized medication” in the field of psychiatric diseases.
Materials and Methods
Drug-Related SNPs Selection
After conducting a thorough literature review, 7 genetic variants associated with antipsychotic response were selected.42 These comprise of the following: rs6295 in 5-hydroxytryptamine receptor 1A (HTR1A) gene, rs6313 in 5-hydroxytryptamine receptor 2A (HTR2A) gene, rs1800497 in ankyrin repeat and kinase domain containing 1 (ANKK1) gene, rs1954787 in glutamate receptor ionotropic, kainate 4 (GRIK4) gene, rs1799732 in dopamine receptor D2 (DRD2) gene, rs489693 in melanocortin 4 receptor (MC4R) gene, rs4713916 in FK506-binding protein 5 (FKBP5) gene (Table 1). All these variants have a frequency of over 5% in the Chinese population and are included in the pharmacogenomics database PharmGKB, with relatively high levels of evidence. All selected variants met three key criteria: (1) a minor allele frequency (MAF) exceeding 5% in the Chinese population; (2) inclusion in the Pharmacogenomics Knowledge Base (PharmGKB, https://www.pharmgkb.org/), an authoritative repository for pharmacogenomic data; and (3) possession of relatively high levels of evidence for their association with antipsychotic response, as classified by PharmGKB or relevant consensus guidelines.
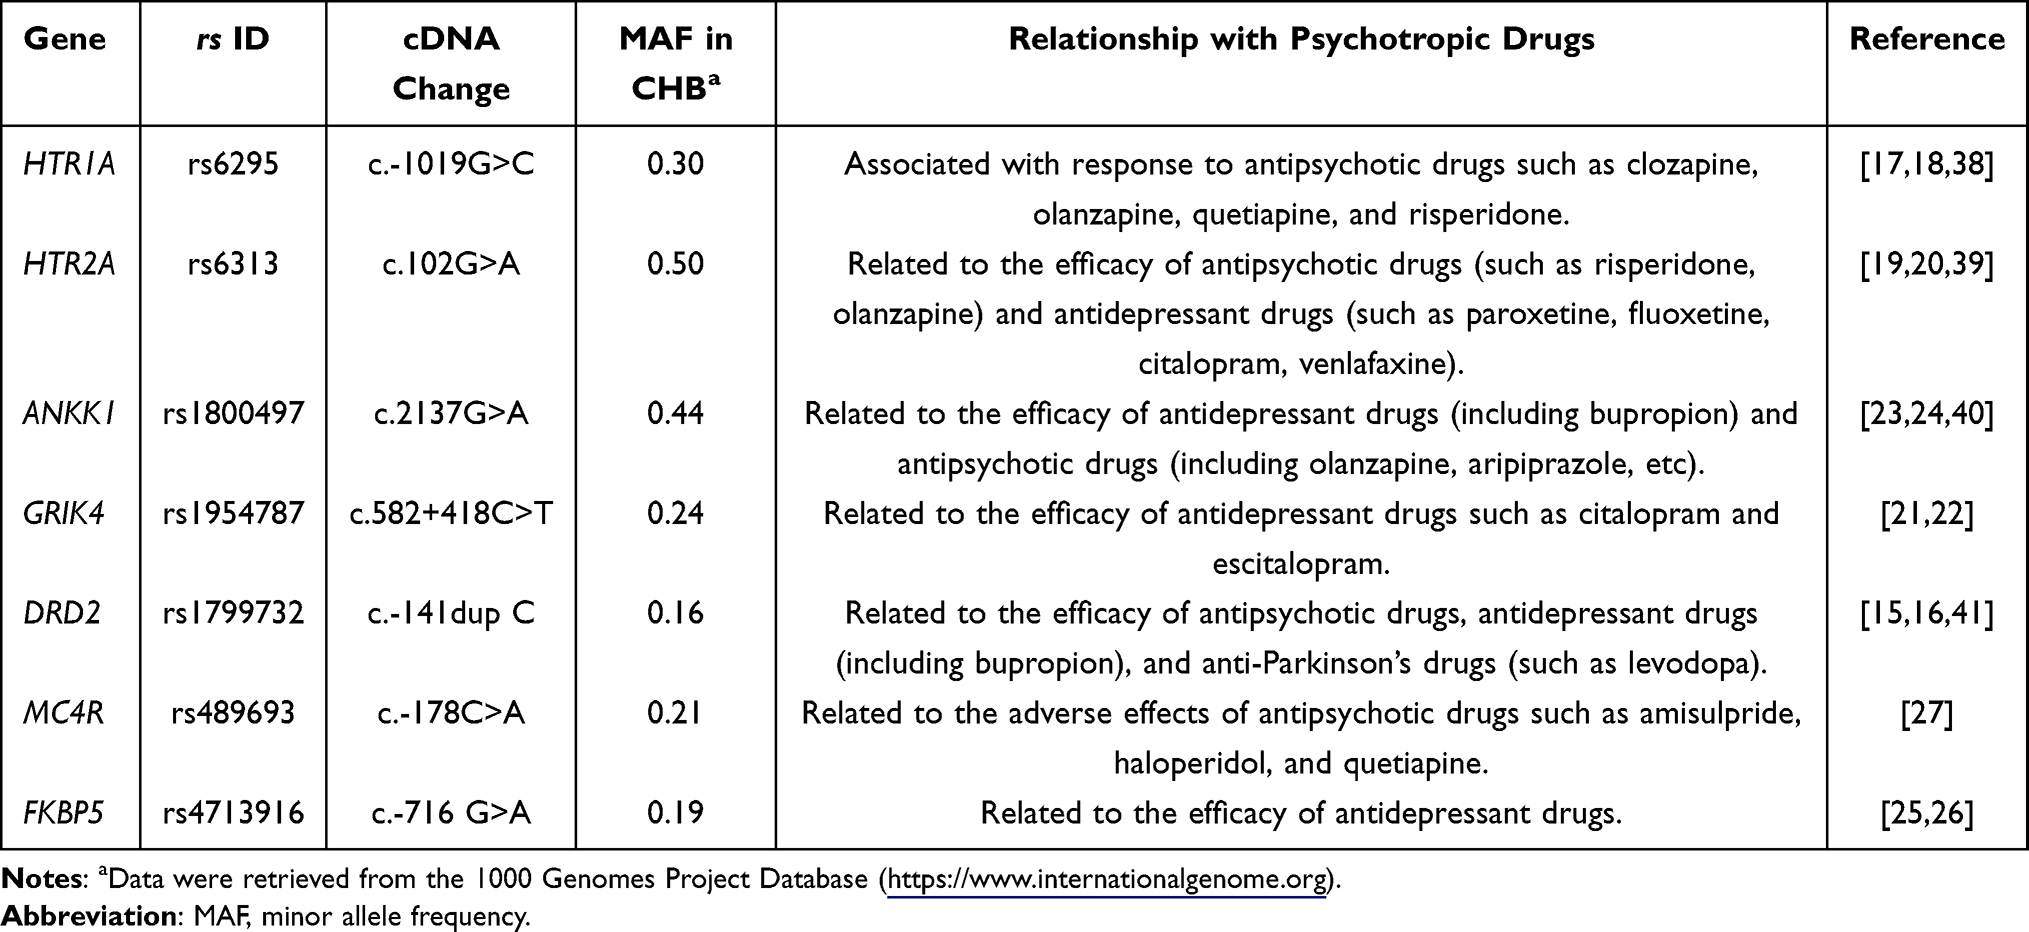 |
Table 1 Genetic Loci Associated with Response to Psychotropic Drugs Selected in This Study |
Gene sequences containing the selected SNPs were retrieved from the National Center for Biotechnology Information (NCBI) database and the UCSC Genome Browser (https://genome.ucsc.edu/). For PCR amplification, a DNA fragment of approximately 100–200 base pairs (bp) that encompassing the target SNP locus was designated as the amplification template. Recombinant plasmids corresponding to this target DNA sequence were custom-synthesized by Sangon Biotech Co. Ltd. (Shanghai, China). Specifically, for each SNP, two distinct recombinant plasmid constructs were generated, one carrying the wild-type (WT) allele and the other harboring the mutant (MT) allele.
Primers and Probe Design
For each SNP locus, a pair of sequence-specific primers and a sequence-specific TaqMan probe was designed using the IDT OligoAnalyzer™ tool (https://www.idtdna.com/site/home/home/sessiontimeout).The probe sequence was complementary to either the wild-type or mutant template. To ensure assay specificity, all primer and probe sequences were subjected to bioinformatic verification using the BLAST alignment tool against the NCBI human genomic database. This confirmed that all sequences were uniquely complementary to their respective target gene regions, with no significant cross-reactivity with other genomic sequences. Furthermore, to create differences in binding affinity and thermodynamic stability when the same probe was hybridized to both wild-type and mutant templates, two strategies were employed: first, SNP sites were placed in the middle of the probe during design; second, Locked Nucleic Acid (LNA) modifications were applied to nucleotides adjacent to specific mutation sites on the probe. These two measures ensured a >5°C difference in Tm between the probe-wild-type duplex and probe-mutant duplexes. The design also adhered to criteria such as no G base at the 5′-end of the TaqMan probe, optimal Tm values, and the absence of secondary structures. Primers and TaqMan probes were synthesized by Sangon Biotech (Shanghai, China) and are listed in Table 2.
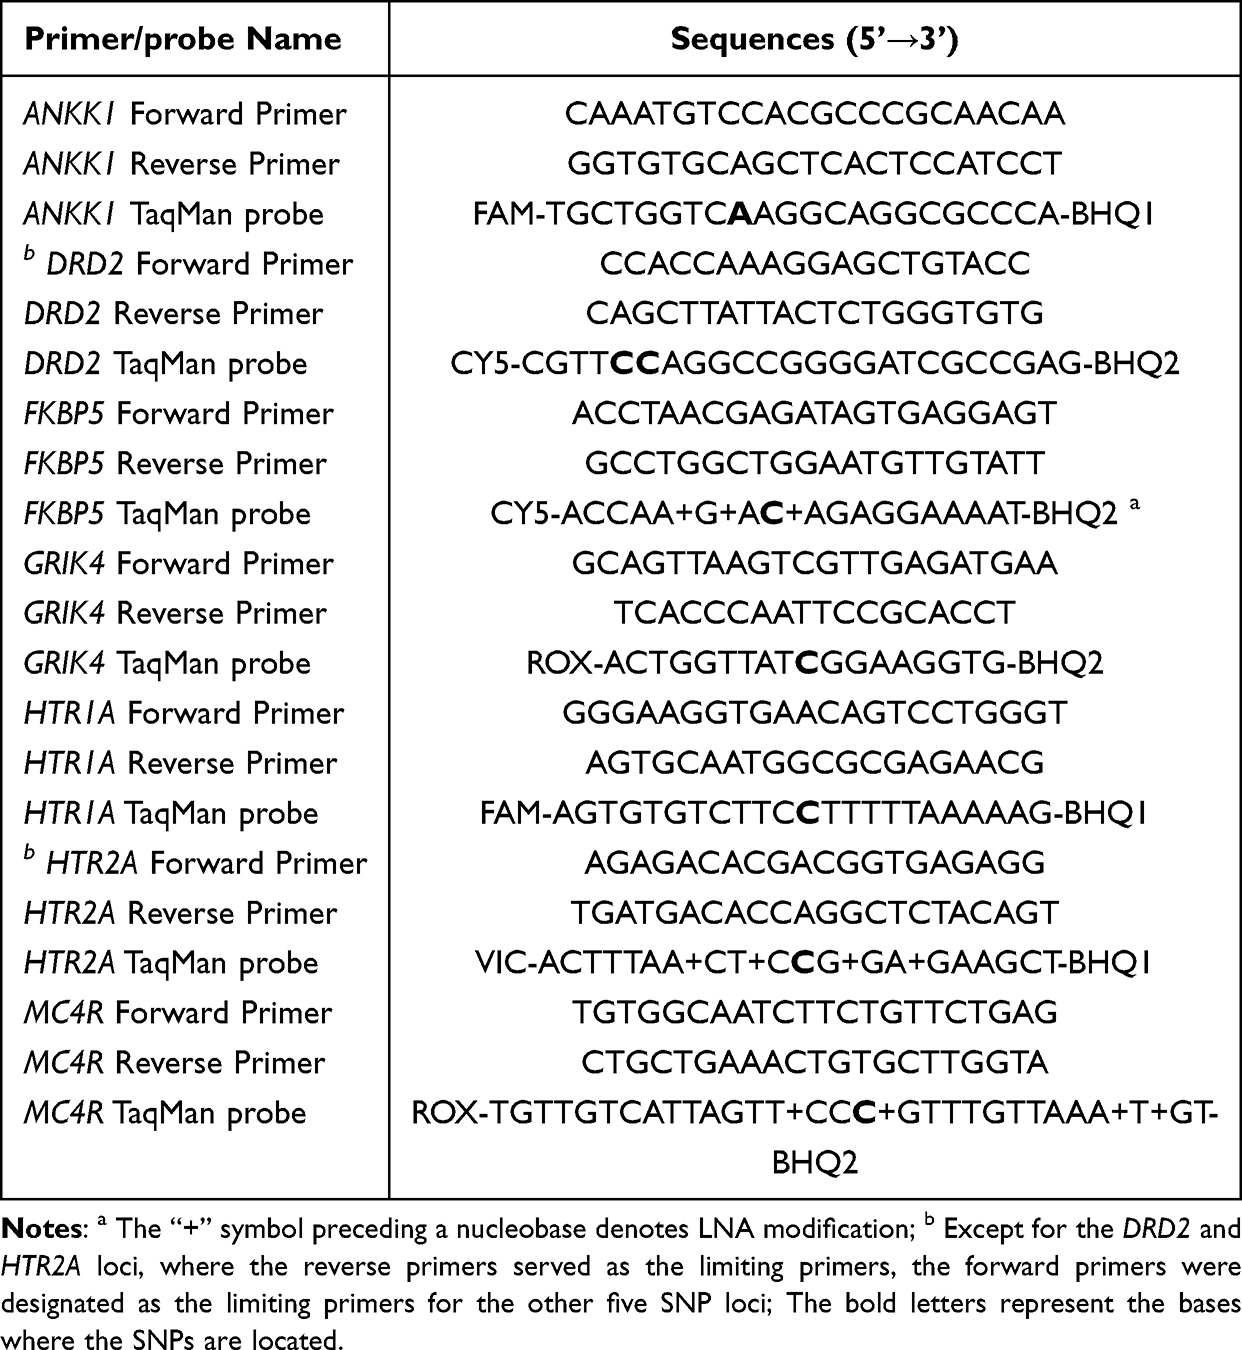 |
Table 2 Primers and TaqMan Probes Used in This Study |
Singleplex Assay System Establishment and Optimization
First, DNA plasmids containing the target gene fragments were used as standard templates and a singleplex assay system for each SNP was established. To establish an optimal assay system for detecting SNPs, the optimization process primarily focused on three key aspects: probe selection (to generate distinguishable melting peaks), molar ratios of limiting primer to excess primer (tested at 1:10, 1:20, and 1:50), and probe volume (evaluated at 0.4 μL, 0.6 μL, 0.8 μL, and 1 μL). Finally, the optimized reaction mixture consists of 10 μL 2 × FastAmpli Premix (Zhuhai Biori Biotech, China), 0.4 μL each of limiting primer (1μM) and excess primer (10μM), 0.4 μL TaqMan probe (10μM), 1 μL DNA template, and Tris-EDTA (TE) buffer was added to a total volume of 20 μL. The PCR conditions were as follows: an initial denaturation at 95°C for 5 min, followed by 40 cycles of 95°C for 5 s and 60°C for 30s. Subsequently, the melting curve analysis was performed under the following conditions: denaturation at 95°C for 15s, annealing at 40°C for 60s, and a temperature ramp from 40°C to 85°C at 0.05°C/s with fluorescence acquisition. All PCR analyses were performed on a ViiATM 7 Dx Real-Time PCR System (Thermo Fisher Scientific, USA).
Multiplex Assay Establishment and Optimization
Based on the established singleplex detection system, we constructed a duplex system that enabled simultaneous detection of two SNP loci in a single fluorescent channel. The optimization objective of this system is to generate specific melting peaks that can distinguish the four alleles of these two SNP loci.
Finally, the optimal multiplex system for simultaneous detection of the seven SNP loci was composed of 10 μL of 2 × FastAmpli Premix (Zhuhai Biori Biotech, China), 2.8 μL of forward primer mixture, 2.8 μL of reverse primer mixture, and 2.8 μL of TaqMan probe mixture. Within this mixture, each SNP locus was allocated a uniform volume of components: 0.4 μL of limiting primer (1μM), 0.4 μL of excess primer (10μM), and 0.4 μL of TaqMan probe (10μM) per locus. Additionally, 1 μL of the DNA template and TE buffer was added to adjust the total reaction volume to 20 μL. Four fluorescent channels were used for the detection: FAM (518 nm), VIC (554 nm), ROX (615 nm), and CY5 (667 nm). All channels were designed to detect two SNP loci, except the VIC channel, which was designed to detect one SNP locus. PCR amplification and melting curve procedures were the same as those described above.
Analytic Performance Evaluation of the Multiplex Assay
To determine the amplification efficiency of the established assay,10-fold serial dilutions of wild-type plasmids were utilized as templates, with concentrations ranging from 1×10⁷ copies/μL to 1×10² copies/μL. For these reactions, each plasmid template was added individually to the multiplex system. Standard curves for each target were constructed based on the Ct values, and amplification efficiency was calculated using the following formula: Efficiency (E) = [10^(–1/slope)] – 1.
To determine the limit of detection (LOD), a plasmid mixture containing all 14 alleles was used as the template. This mixture was 10-fold serially diluted to reach concentrations ranging from 1×10⁴ copies/μL to 1×10° copies/μL per allele. Each dilution was then tested to establish the lowest detectable concentration for each target within the multiplex environment.
To assess the repeatability and reproducibility of the assay, plasmid mixture templates at three different concentrations (1 × 10⁷ copies/μL, 1×10⁵ copies/μL, and 1×10³ copies/μL) were used for PCR amplification. For each concentration, three parallel replicates were included within a single run to determine intra-assay variation. Furthermore, the experiments were performed across three independent batches, with a one-day interval between each batch, to evaluate inter-assay reproducibility. The coefficients of variation (CVs) for the Tm values were then calculated.
To evaluate the cross-platform compatibility of the established assay, multiplex detections were performed using plasmid standards at a concentration of 1×10⁴copies/μL as templates. The assays were conducted in parallel on the ViiATM 7 system and another mainstream commercial qPCR instrument, the SLAN-96S (Hongshi, Shanghai, China). For each platform, three parallel replicates were included. The mean Tm values for each allele were calculated for both instruments, and the temperature deviation (ΔTm) between the two platforms was determined to assess the robustness of the system across different hardware environments.
To validate the specificity of the assay, multiplex PCR was performed using 14 distinct plasmid genotypes or samples with known genotypes as templates. This was performed to analyze potential cross-reactivity with non-target sequences. Additionally, no-template controls (NTC) were included to confirm the absence of false-positive amplification.
Melting Curve Data Processing
Melting curve data were analyzed and processed using the ViiATM 7 software (v1.2.2, Thermo Fisher Scientific, USA) or the SLAN 8.2.2 software (Hongshi, Shanghai, China). The software employs a negative derivative algorithm (−dF/dT) combined with linear baseline subtraction to transform fluorescence inflection points into distinct melting peaks. To ensure objective signal identification, automated fluorescence thresholds were applied based on global background noise levels, effectively distinguishing valid target signals from non-specific products such as primer dimers.
Sample Collection and DNA Extraction
A total of 222 peripheral blood samples (2 mL each) from healthy Han Chinese individuals were obtained from the Affiliated Hospital of Yan’an University (Shaanxi, China). These samples were divided into a training cohort (n=98) for establishing genotyping criteria and an independent validation cohort (n=124) for performance evaluation. This study was approved by the Ethics Committee of Affiliated Hospital of Yan’an University (Approval No. IIT-R-2025316L; Date of Approval: Sep 8, 2025), and written informed consent was obtained from all participants prior to sample collection. All procedures were performed in accordance with the Declaration of Helsinki. Sample collection strictly followed standard operating procedures to ensure high quality and representativeness. Genomic DNA was extracted from 200 μL of whole blood using the NPure Blood DNA Extraction Plus Kit (Biokeystone, China; Cat. No. M2010-01), according to the manufacturer’s protocol. The extracted DNA was eluted and stored in Tris-EDTA buffer provided in the kit. All the specimens were subjected to Sanger sequencing. The total DNA concentration was measured using a NanoDrop One spectrophotometer (Thermo Fisher Scientific, USA), and the DNA quality was assessed using the 260/280 absorbance ratio. The concentration of the extracted DNA was determined to be between 30 and 120 ng/μL, with A260/A280 ratios ranging from 1.7 to 2.0, indicating high purity and suitability for subsequent molecular analysis. The purified genomic DNA was stored at −80°C until further use. Finally, all of these specimens were subjected to Sanger sequencing as the reference standard.
Clinical Validation and Performance Evaluation
To assess the clinical utility and diagnostic accuracy of the developed mFMCA assay, a two-phase analytical workflow was implemented, prioritizing independence, robustness, and clinical applicability.
Initially, a theoretical Tm baseline was established based on the replicated measurements of plasmid standards (Mean Tm ± 2.0°C). To account for the systematic thermal shifts induced by complex matrix effects in clinical samples, a calibration set of 98 Han Chinese individuals with genotypes pre-verified by Sanger sequencing was analyzed. For each SNP locus, the genotyping criteria were refined based on the Tm distribution observed in clinical samples. Beyond numerical Tm values, characteristic melting curve morphologies (eg., peak broadening and coalescence patterns in heterozygotes) were formally incorporated into the diagnostic criteria to facilitate the interpretation of complex profiles with overlapping allelic peaks.
Then, to rigorously evaluate the performance of the finalized criteria, an additional, independent cohort of 124 clinical samples was recruited for a prospective validation. Genotype calling for this cohort was performed in a strictly blinded manner. Samples yielding results that deviated from the established integrative criteria were re-tested in triplicate. If the results consistently failed to align with the criteria upon repeat analysis, the samples were designated as genotyping failures or recorded as discordant cases. Following the finalization of the mFMCA calls, the results were compared against Sanger sequencing (the reference standard) to determine the sensitivity, specificity, and Cohen’s kappa coefficient.
The deviation between plasmid-derived Tm and clinical Tm (ΔTm) was recorded for all loci. To minimize human-mediated variability, a secondary expert review protocol was implemented for any profiles exhibiting atypical morphology. Statistical analyses were performed using Microsoft Excel (Microsoft Corp., Redmond, WA, USA) and IBM SPSS Statistics version 20.0 (IBM Corp., Armonk, NY, USA), and the diagnostic metrics were calculated with 95% confidence intervals (95% CIs).
Results
Working Procedure and Principle of the Multiplex Fluorescence Melting Curve Analysis (mFMCA)
Multiplex asymmetric PCR was performed to generate abundant single-stranded products complementary to their corresponding fluorescent probes. Adjustment of the ratio of limited primers to excess primers effectively minimized probe hydrolysis without compromising amplification efficiency, ensuring robust target amplification while preserving sufficient residual probes for template binding. Subsequently, melting curve analysis of the probe-strand duplexes was conducted across all fluorescent channels and different SNPs were genotyped by recording the number of melting peaks and their corresponding Tm values. For a certain SNP locus, the homozygous wild type corresponds to a single melting peak with a higher Tm value, the homozygous mutant type corresponds to a single melting peak with a lower Tm value, and the presence of both melting peaks indicates the heterozygous type (Figure 1). For the seven loci detected in this study, the single-tube assay system was designed as follows: three fluorescent channels (FAM, ROX, and CY5) each allocated two SNPs, whereas the VIC channel detected only one locus.
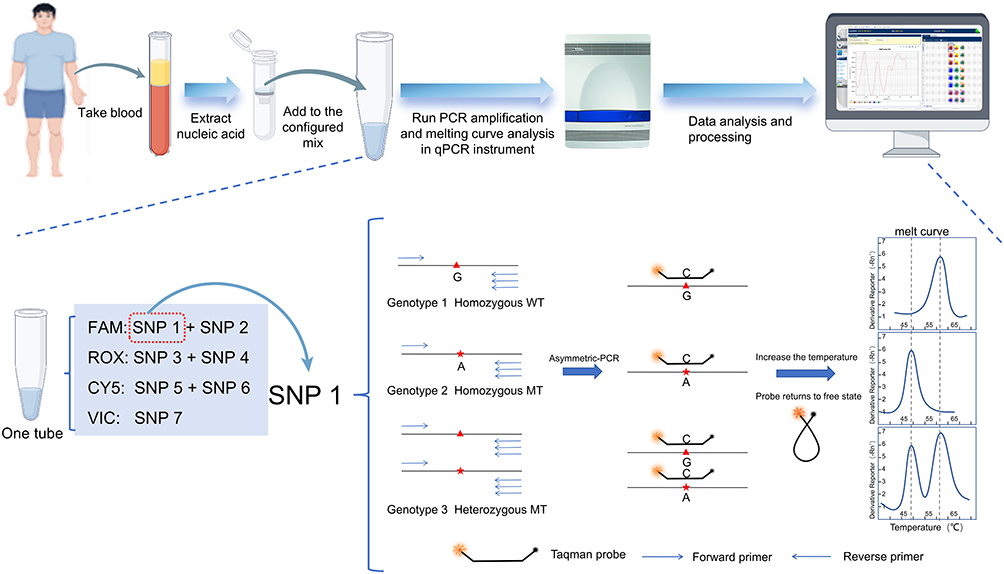 |
Figure 1 Technical principle of the mFMCA system. Notes: The system employs asymmetric PCR followed by high-resolution melting curve analysis.By generating distinct Tm values or unique Tm patterns, the system enables the precise discrimination of different alleles and genotypes for a given SNP. In the sequence schematic, the red triangles (▲) and asterisks (*) denote the position of target SNPs, Specifically, the red triangles denote the wild-type (reference) alleles, while the red asterisks represent the corresponding mutant (variant) alleles. |
Singleplex Assay System for 7 SNPs
First, we utilized the sequence design and Tm value prediction functions of the online software IDT to design and screen fluorescent probes suitable for SNP detection. This ensured that each probe generated significantly different Tm values when hybridized with matched and mismatched sequences of the SNP.
Subsequently, using plasmid standards for the two alleles of each SNP and samples with known genotypes as templates, we established a singleplex detection system for each SNP. We verified the Tm values of the probe-target strand duplexes and optimized the system by refining the probe sequences, adjusting the molar ratio of restricted primers to excess primers, and modifying the probe concentrations. These optimizations were aimed at achieving clear differentiation of the melting peaks and corresponding Tm values for the three genotypes of a certain SNP. Efforts were made to ensure that the Tm values of the melting peaks corresponding to the two SNPs planned to be detected in the same fluorescent channel could be clearly distinguished from each other. Experimental data indicate that when the molar ratio of the limiting primer to the excess primer is 1:10 and the probe dosage is 0.4 μL (0.2μM final concentration), almost all seven singleplex systems achieve optimal performance (Figure 2). At this point, each melting peak had a steep shape, and the two peaks of the heterozygous genotype for each SNP were clearly distinguishable. Thus, an optimal detection system was established for each SNP (Figure 3 and Figure S1–S3).
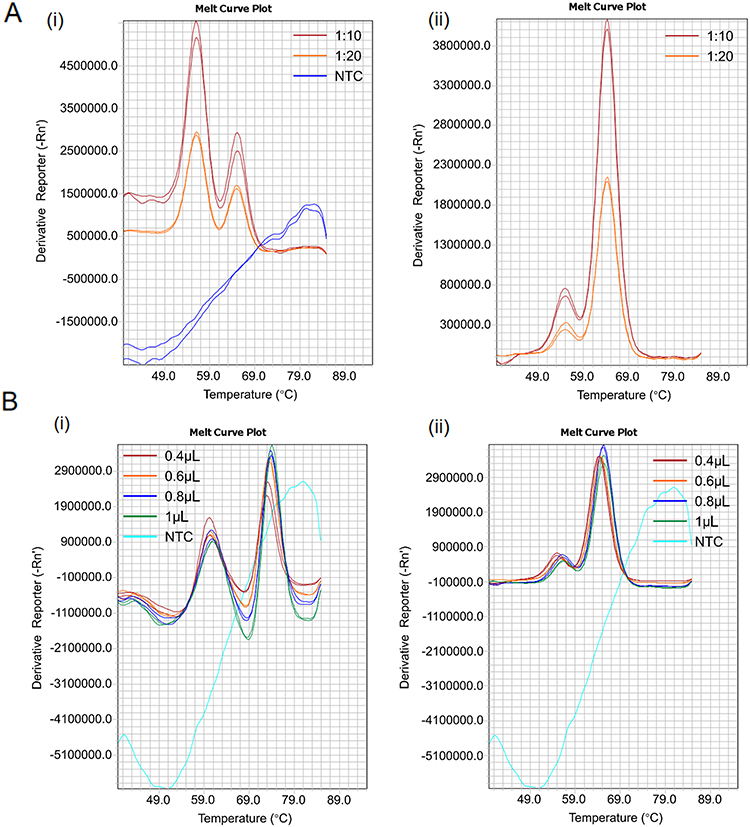 |
Figure 2 Optimization of primer and probe concentrations in the reaction system. Abbreviations: NTC, no template control. Notes: (A) Evaluation of molar ratios between limiting and excess primers in asymmetric PCR; ratios of 1:10 and 1:20 were tested for (i) DRD2 and (ii) GRIK4 variants. (B) Optimization of probe concentrations; volumes of 0.4, 0.6, 0.8, and 1.0 μL were assessed for (i) DRD2 and (ii) GRIK4 variants. |
 |
Figure 3 Representative melting curves for HTR1A and ANKK1 genotyping in the FAM channel. Notes: (A–C) HTR1A C/C (mutant), G/G (wild-type), and C/G (heterozygote). (D–F) ANKK1 A/A (mutant), G/G (wild-type), and A/G (heterozygote). Genotypes are distinguished by their characteristic Tm values or specific Tm patterns. |
Multiplex Assay System Optimization and Establishment
Subsequently, we constructed a duplex detection system capable of simultaneously detecting the two SNPs. A common issue encountered in duplex systems is that the four melting peaks corresponding to the two SNPs may undergo partial overlap or fusion, which poses significant challenges for interpreting the results. When such issues arise, they are usually addressed by adjusting the probe sequence (eg., changing the probe’s complementary strand to the antisense strand of the target gene or performing LNA modification on the bases adjacent to the SNP site) or altering the fluorescence channel of the target SNP, ultimately achieving a state where the melting peaks of the two detected SNPs in the same fluorescence channel are clearly distinguishable. For example, we initially selected the ROX channel to detect DRD2 rs1799732 and GRIK4 rs1954787. As shown in Figure 4A, the singleplex systems for these two SNPs could both clearly distinguish wild-type and mutant alleles, with a minimum Tm difference of 3.42°C. However, when a duplex assay was conducted for these two SNPs, the melting peaks at 60.63°C and 64.05°C merged into a single composite peak at 63.97°C. At the same time, for the FKBP5 and MC4R loci originally intended for co-detection in the CY5 channel, two of their melting peaks (at 57.74°C and 65.83°C) merged into one at 64.86°C when co-detected in a single reaction tube (Figure 4C). By redesigning the probes and swapping the detection channels for the DRD2 and MC4R loci, we successfully constructed two duplex detection systems: one that could clearly detect the GRIK4 and MC4R loci in the ROX channel (Figure 4B), and the other that enabled the simultaneous detection of the DRD2 and FKBP5 loci in the CY5 channel (Figure 4D).
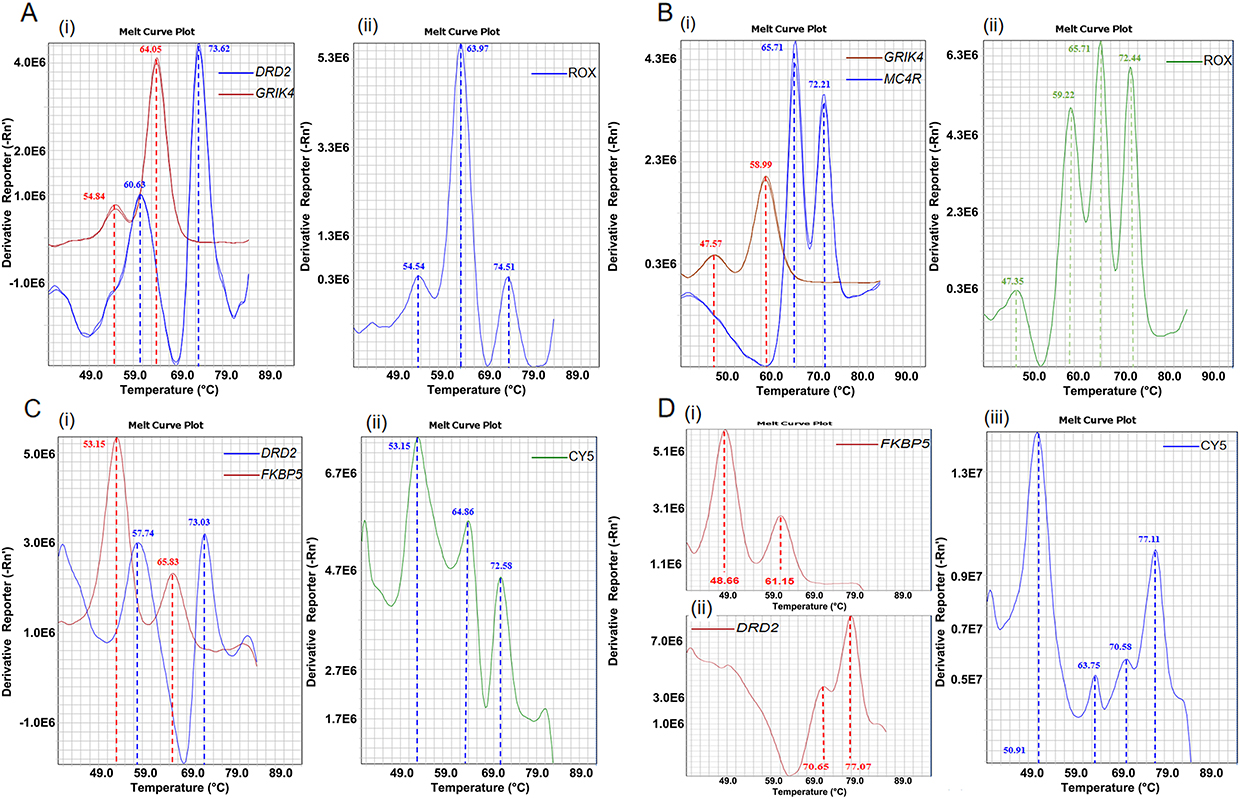 |
Figure 4 Establishment and optimization of the duplex reaction system in ROX and CY5 channels. Notes: The optimization was achieved through strategic selection of target loci and refining probes. (A and B) Duplex system performance in the ROX channel before (A) and after (B) optimization. (C and D) Duplex system performance in the CY5 channel before (C) and after (D) optimization. For panels A,B,C: (i) represents the respective singleplex reactions for the two individual loci, and (ii) represents the integrated duplex reaction within the same channel. For panel (D) (i) and (ii) represent the singleplex reactions for each of the two loci, and (iii) represents the integrated duplex reaction within the same channel. |
Ultimately, by pooling all primers and probes in a single reaction system, we successfully established a single-tube multiplex detection system capable of simultaneously genotyping the seven SNPs in a single reaction. By assigning SNP loci to distinct fluorescent channels and leveraging four discrete Tm values per channel, this system facilitates high-resolution genotyping of all seven SNPs through dual-parameter discrimination, that is, fluorescence channel and Tm value. The experimental data are presented in Figure 5 and Table 3 and Figure S4.
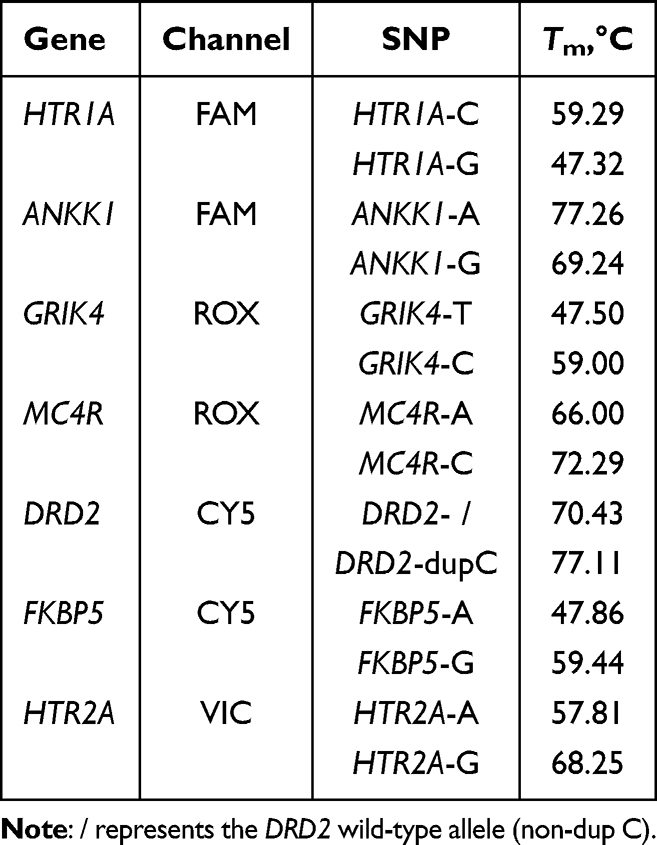 |
Table 3 Optimized Allocation of the Seven Target SNPs Across Four Fluorescence Channels and Their Respective Allele-Specific Tm Values in the mFMCA System |
 |
Figure 5 Validation of the mFMCA system using a mixture of 14 DNA plasmid representing both alleles of each of the seven target SNP loci. Notes: (A) Integrated multiplex melting curves across all four detection channels, demonstrating simultaneous multi-locus detection. (B) Individual melting profiles for each channel: (i) FAM channel: identification of HTR1A and ANKK1 alleles; (ii) ROX channel: identification of GRIK4 and MC4R alleles; (iii) CY5 channel: identification of DRD2 and FKBP5 alleles; (iv) VIC channel: identification of the HTR2A allele. |
Fundamental Performance Evaluation Using DNA Plasmids
The amplification efficiency of the multiplex system was evaluated using 10-fold serial dilutions of wild-type plasmids, ranging from 1×10² copies/μL to 1×10⁷ copies/μL. Standard curves were constructed by plotting the Ct values against the log-transformed template concentrations.The results demonstrated high amplification efficiency for each SNP target, with all correlation coefficients (R2) exceeding 0.998 (Figure 6 and Figure S5–S7). These data confirm that the use of asymmetric PCR did not compromise the amplification efficiency of the multiplex assay.
 |
Figure 6 Evaluation of amplification efficiency for HTR1A and ANKK1 genes in the FAM channel. Notes: (A) amplification curves of HTR1A gene using a ten-fold serial dilution of plasmid standards; (B) corresponding standard curve of HTR1A gene showing the linear relationship between the log of the starting template quantity and the Ct value. (C) amplification curves of ANKK1 gene; (D) corresponding standard curve of ANKK1 gene. ΔRn, represents the magnitude of the normalized fluorescence signal generated by the reporter dye, calculated by subtracting the baseline fluorescence from the normalized reporter signal (Rn); Ct, cycle threshold value. |
To determine the limit of detection (LOD) of the multiplex system, a plasmid mixture containing all 14 alleles was prepared in 10-fold serial dilutions,ranging from 1 × 10⁴ copies/μL to 1×10° copies/μL. The experimental results showed that at a concentration of 100 copies/μL, all expected distinct melting peaks across each channel remained clearly distinguishable. However, at concentrations below this threshold, the system failed to consistently generate the full profile of melting peaks, indicating that the analytical sensitivity of the assay is 100 copies/μL per reaction. (Figure 7).
 |
Figure 7 Evaluation of the analytical sensitivity for each detection channel in the mFMCA system. Notes: The detection limits were determined using ten-fold serially diluted mixed DNA templates containing all 14 allelic variants of the seven target SNPs. The concentration of the plasmid DNA standards ranged from 104 to 10° copies/μL. Representative melting curve profiles (-dF/dT vs. Temperature) are displayed for the: (A) FAM channel; (B) ROX channel; (C) CY5 channel; and (D) VIC channel. In each panel, the four distinct melting peaks represent the characteristic Tm signatures of the four different alleles associated with the two SNP loci detected in that specific channel. The different colored melting curves correspond to the gradient of plasmid standard concentrations, with the units expressed as copies/μL. |
In terms of precision, we performed multiplex reactions using plasmid DNA templates at three concentrations (103 copies/μL, 105 copies/μL, 107 copies/μL), and evaluated the reproducibility of the multiplex system by analyzing Tm value variations across three replicate experiments and among different template concentrations. The experimental results showed that the coefficients of variation (CVs) of the Tm values for the 14 melting peaks corresponding to the seven SNPs were all less than 1–3%, confirming the high repeatability and stability of the multiplex system established in this study (Table 4). Furthermore, the developed multiplex detection system exhibited excellent compatibility with another commercial qPCR instrument, SLAN-96S (Hongshi, Shanghai, China), in which the melting peaks corresponding to each genotype were clearly distinguishable. The Tm difference range for the same genotype on ViiATM 7 and SLAN-96S was between 0.1 and 3°C (Table S1 and Figure S8).
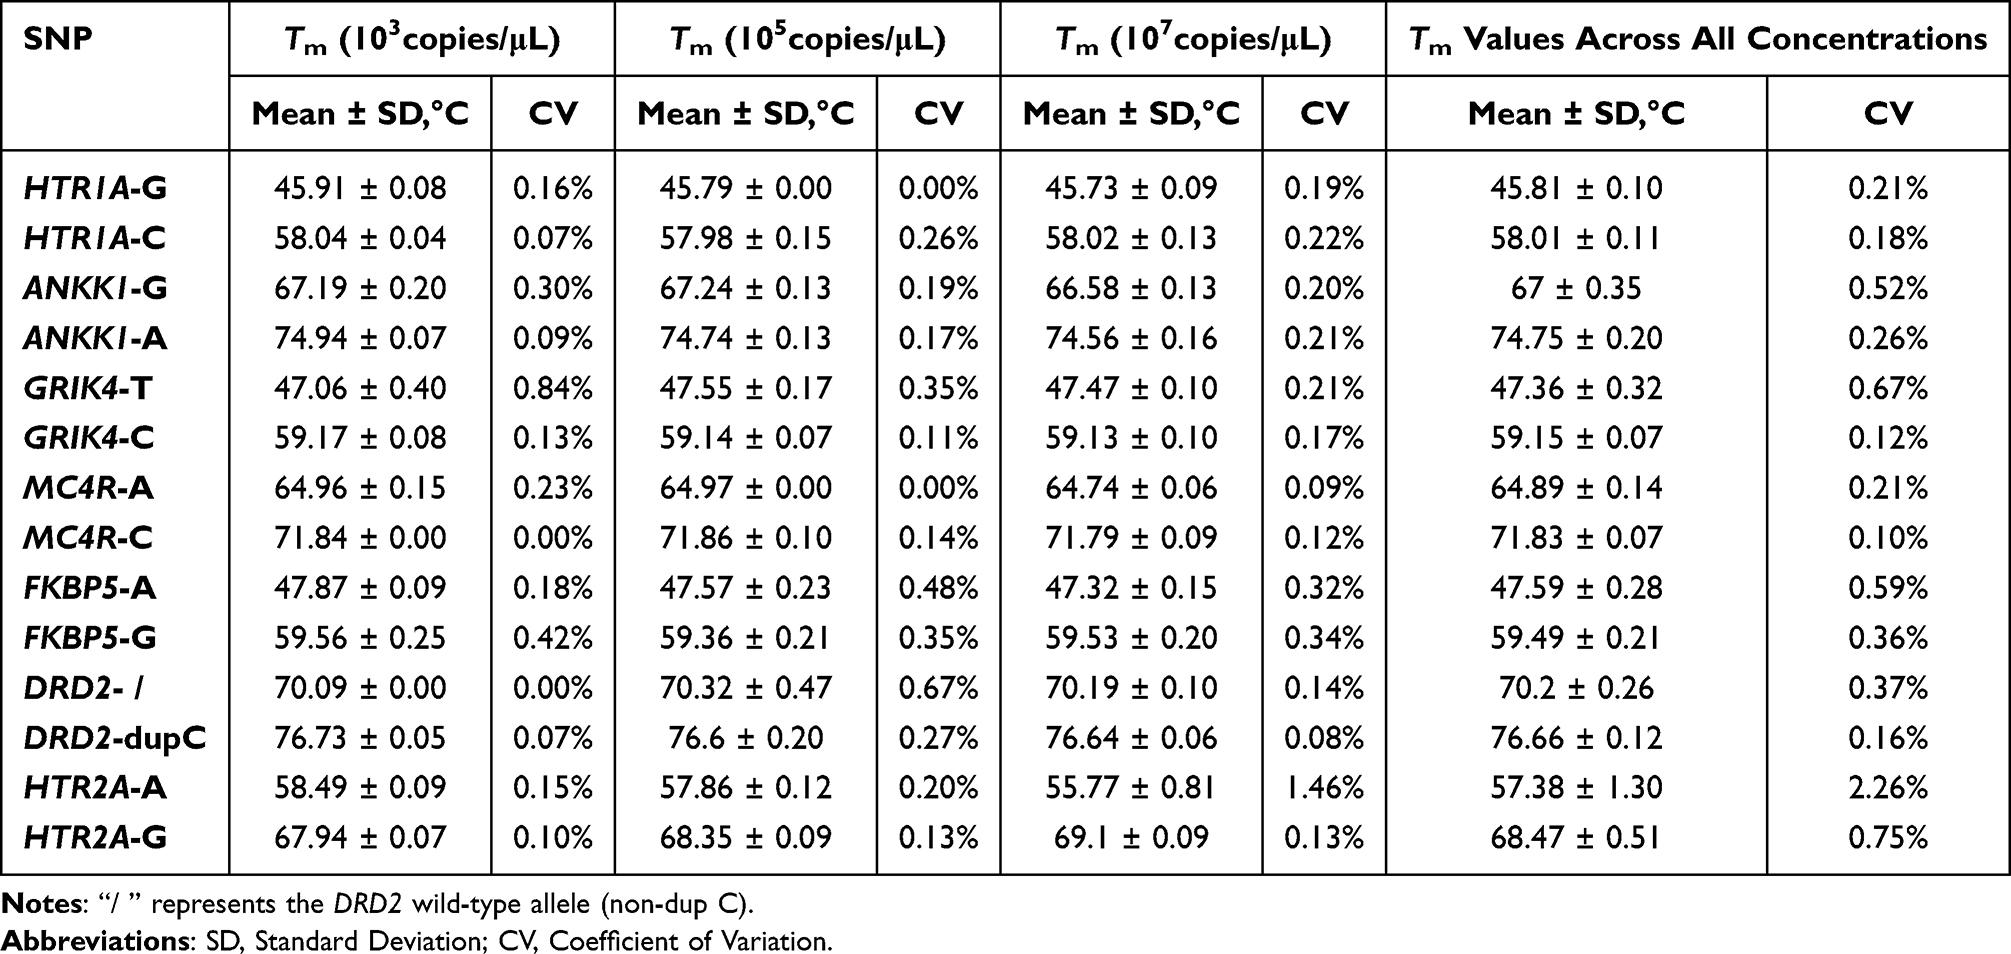 |
Table 4 Repeatability of Tm Values for the Seven Target SNPs Across Three Different Concentrations in the mFMCA System |
To evaluate the specificity of this detection method, a mixture of 14 distinct plasmids of the 7 SNPs (each SNP corresponding to two alleles, wild-type and mutant-type) was co-amplified in a single reaction tube in the presence of two target-specific fluorescent probes. Melting curve analysis demonstrated that only specific melting peaks of the target SNPs corresponding to these probes were observed with no detectable non-specific amplification or cross-reactivity. These results confirm the high specificity of the assay (Figure 8).
 |
Figure 8 Specificity validation of the mFMCA system. Notes: To evaluate the channel-specific identification of the multiplex assay, a mixed DNA plasmid template containing all 14 alleles of the seven target SNPs was amplified in the presence of specific probes for each corresponding fluorescence channel. Representative melting curve profiles (-dF/dT vs. Temperature) demonstrate that only the four specific alleles associated with the two dedicated SNPs were detected in each respective channel, with no cross-channel interference observed. (A) FAM channel; (B) ROX channel; (C) CY5 channel; (D) VIC channel. |
Finally, based on the global mean Tm calculated from the three tested plasmid concentrations, we established the initial genotype calling criteria for unknown samples, defined as the mean Tm ± 2°C. Within these predefined windows, the melting peaks of the four alleles in each fluorescence channel exhibited excellent spatial resolution, with their Tm intervals remaining distinct and non-overlapping.
Clinical Performance Evaluation and Diagnostic Accuracy
To transition from analytical standards to clinical application, a training cohort of 98 Han Chinese individuals with known genotypes pre-verified by Sanger sequencing was utilized to calibrate the initial plasmid-derived criteria (Mean Tm ± 2.0°C). For most SNP loci, the genotyping results were highly accurate and consistent with the plasmid benchmarks. However, a consistent rightward thermal shift of 2.0–3.0°C was observed for the DRD2 wild-type (non-dup C) allele in clinical specimens compared to plasmid templates. Notably, this shift demonstrated high inter-sample reproducibility, with a 3-fold SDs of only 1.59°C across the clinical cohort. This phenomenon underscores the influence of complex clinical matrices on melting peak profiles. Despite these matrix-induced shifts, the three distinct genotypes for DRD2 remained clearly distinguishable. In heterozygous samples, the thermal shift caused the two allelic peaks to partially overlap, coalescing into a single broadened peak (Figure S9). For these profiles, manual inspection was employed to identify the Tm values of both alleles. For all other alleles, mean Tm deviations from the plasmid-derived values remained below 1.0°C. Further analysis revealed that only the HTR2A-A allele exhibited an SD greater than 1.0°C (1.42), specifically originating from heterozygous samples (Table 5 and Table S2). This variance resulted from partial peak coalescence, which yielded an atypical morphology with an indistinct apex. Nevertheless, all HTR2A genotypes were unambiguously identified by integrating characteristic curve shapes with their specific thermal positions (Figure S10).
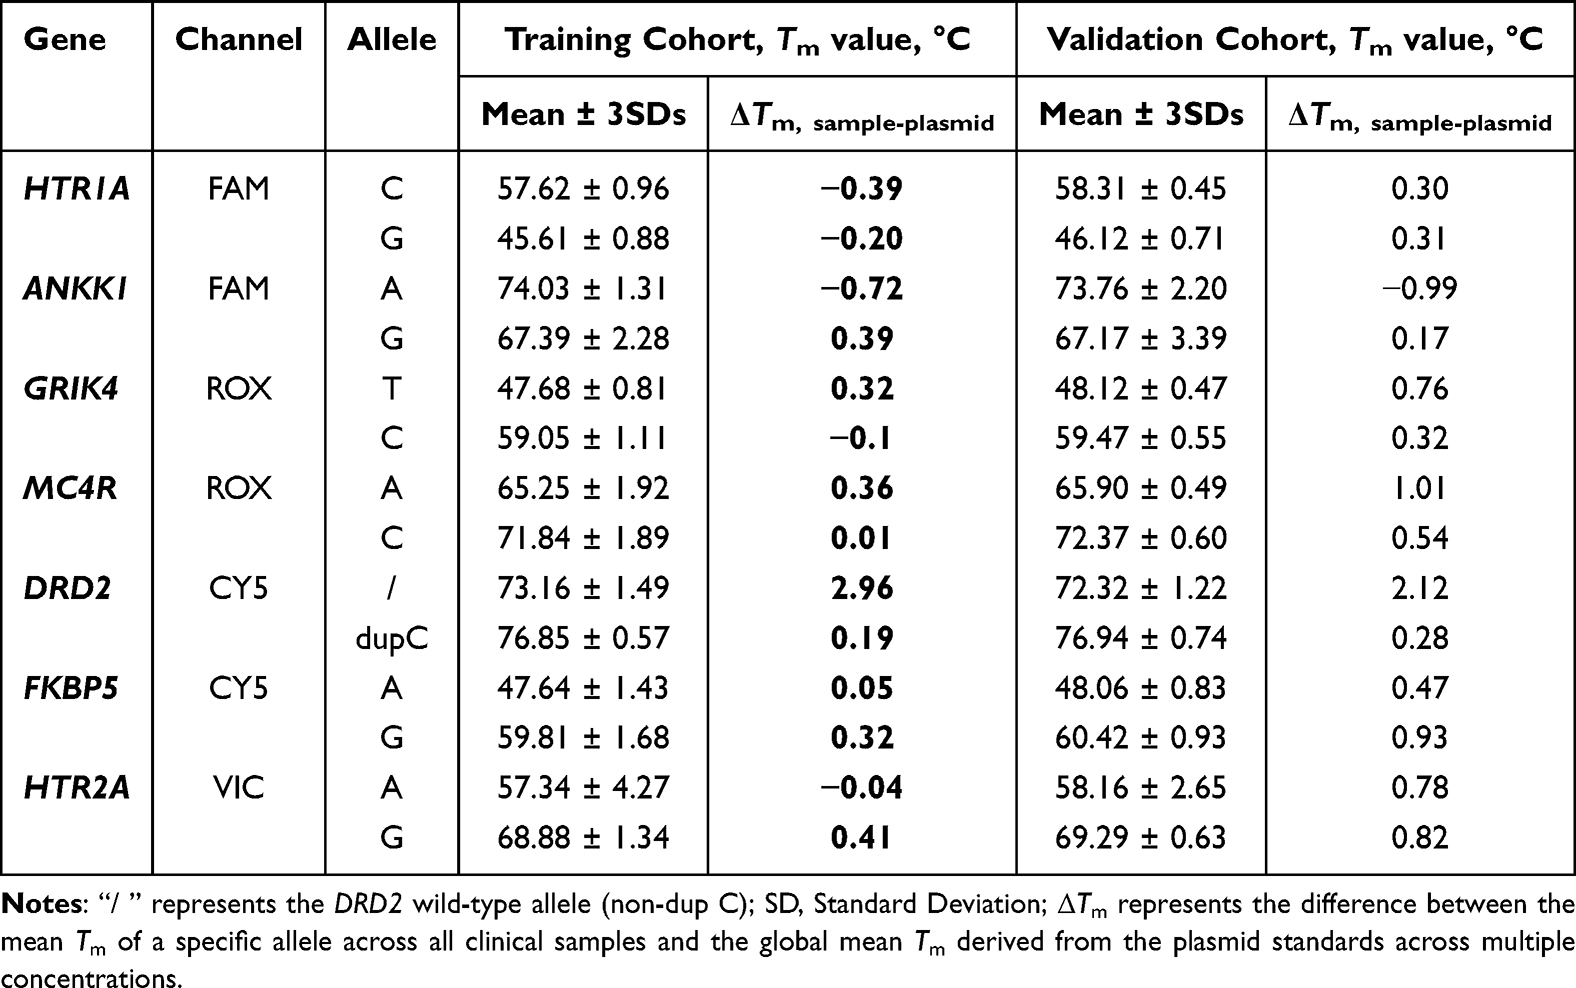 |
Table 5 Tm Values of the Seven Target SNPs in the Training and Validation Cohorts |
Based on these findings, we established integrative genotyping criteria for subsequent analysis, combining qualitative melting peak morphologies with statistical Tm windows (Mean Tm ± 3 SDs) derived specifically from the measurements of the 98 clinical samples in the training cohort, which represents a 99.7% confidence interval.
To rigorously evaluate the reliability of the integrative criteria, an independent validation cohort of 124 clinical samples was analyzed. Genotype calling was performed in a blinded manner, and the results demonstrated 100% inter-operator consistency. Interestingly, the SD values for Tm in the validation cohort were generally lower than those in the training cohort (Table 5 and Table S2), likely reflecting increased technical proficiency during the study. Statistical analysis revealed a 100% concordance rate between the mFMCA assay and gold-standard Sanger sequencing across all 124 clinical samples. The sensitivity and specificity for each locus were consistently 100% (95% CI: 96.3%–100.0%). Cohen’s kappa coefficients (κ) were calculated as 1.00 for all targeted loci, indicating an excellent and reliable genotyping performance (Table S3).
The minor allele frequencies (MAFs) for the seven SNPs were calculated for both cohorts. The genetic distributions were highly consistent between the training and validation groups and aligned with the data for the Han Chinese population in international public databases (Table 6 and Table S4). Representative genotyping profiles and detailed metrics are provided in Figure 9 and Figures S11–S14, and Table S5.
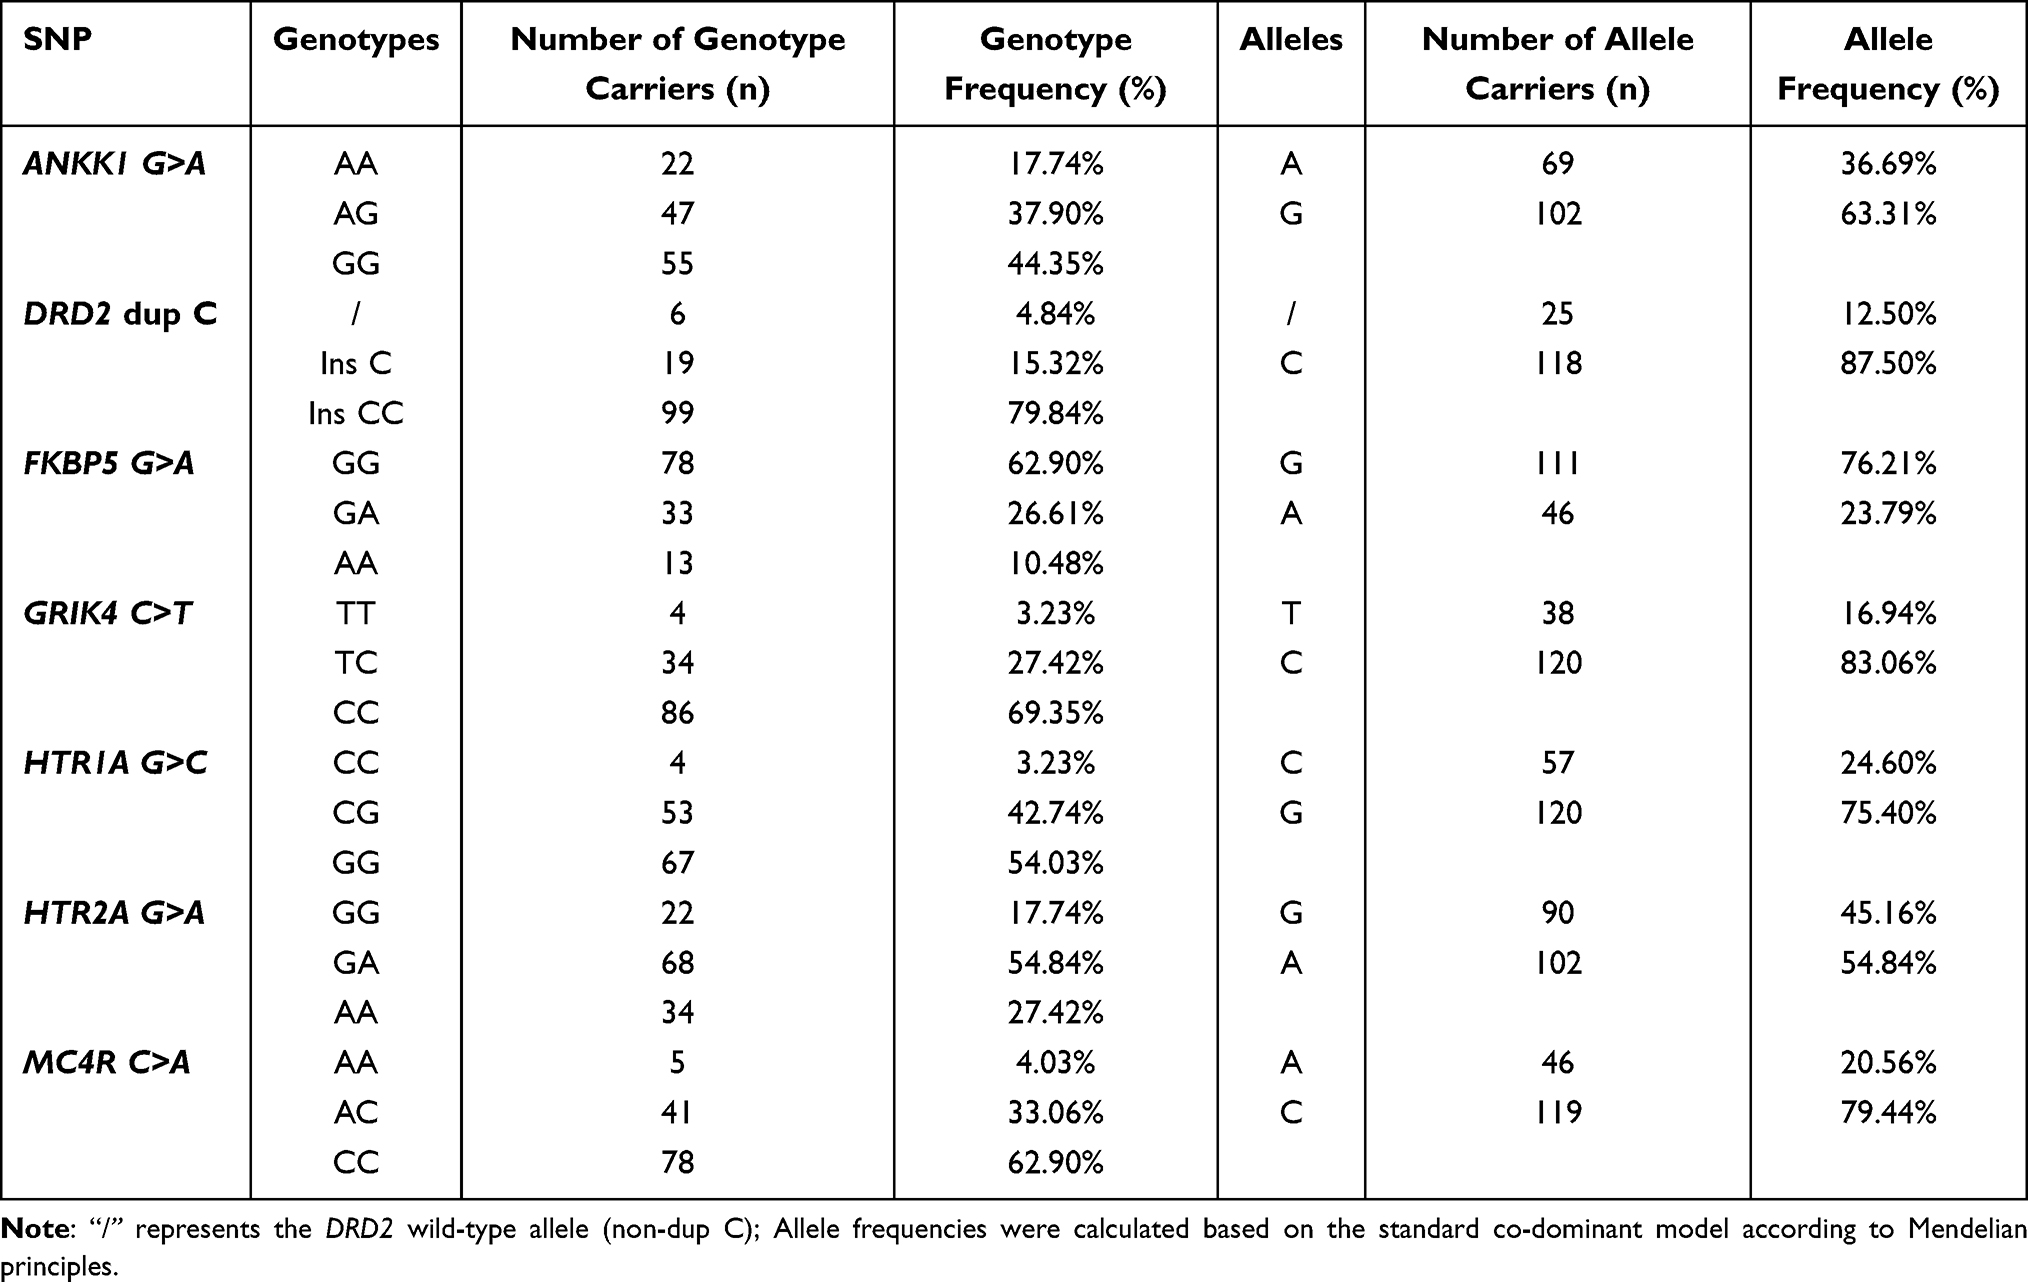 |
Table 6 Distribution of Genotypes and Allele Frequencies for the Seven Target SNPs in the Validation Group (n=124) |
 |
Figure 9 Representative Melting curve profiles of clinical samples evaluated using the mFMCA system. Notes: Four representative clinical samples: (A) No. 201, (B) No. 226, (C) No. 243, and (D) No. 279. In each panel, the overlapping melting curves of different colors represent the simultaneous detection across the four fluorescence channels within a single reaction tube. |
Discussion
Pharmacogenomic studies have demonstrated that individual genetic polymorphisms significantly influence therapeutic efficacy and adverse events associated with pharmacotherapy for psychiatric disorders. Currently, the clinical utility of polymorphisms in genes encoding drug-metabolizing enzymes CYP450 in improving individualized medication of psychotropic drugs is well established, with corresponding detection techniques and commercial kits already widely adopted in clinical practice. However, accumulating evidence indicates that functional variants related to drug targets and signaling molecules also markedly affect the treatment response to psychotropic medications. Despite the increasing recognition of the clinical relevance of these polymorphisms, detection technologies targeting such variants remain underdeveloped as standardized and clinically applicable multiplex assays are still lacking. To address this gap, we successfully developed a multiplex detection system capable of simultaneously genotyping seven SNP loci associated with responses to psychotropic drugs, primarily antidepressants and antipsychotics.
In this study, multiplex fluorescence melting curve analysis (mFMCA) was used for SNP genotyping, enabling simultaneous detection of multiple SNPs in a single tube, thereby overcoming the limitations imposed by the number of available fluorescence channels. Through two-dimensional discrimination (fluorescence channel + Tm), each SNP genotype was assigned a unique signature, allowing for accurate genotyping. Compared to conventional qPCR, this method increases the detection throughput by 3- to 4-fold and reduces costs by requiring only one probe per SNP site. To obtain clear, easily distinguishable, and interpretable melting peaks, a critical requirement for this assay is that the ΔTm between adjacent melting peaks within the same channel should exceed 5 °C. To achieve this, we optimized several parameters: probe length (20–30 bp was optimal; longer probes increased background fluorescence and reduced peak height), SNP positioning within the probe (central placement for maximal ΔTm), chemical modifications and their locations (LNA and MGB modifications enhanced discriminatory power by increasing probe binding affinity and Tm values),43 and incorporation of thermodynamic principles (building on previous studies elucidating how various mismatch types affect PCR efficiency.44 The final system successfully differentiated 21 genotypes across 7 loci, with significantly higher detection throughput than previously reported mFMCA-based SNP detection methods.45–47 Most existing mFMCA assays, possibly limited by low melting curve resolution and suboptimal systems, are confined to detecting one SNP per fluorescent channel, failing to fully leverage this technology’s advantages. Furthermore, our multiplex system accurately detected genomic DNA at concentrations as low as 100 copies/ μL (~ 0.1 ng/reaction). Although slightly less sensitive than conventional singleplex qPCR systems (10 pg/reaction), its sensitivity is comparable to—and in some cases slightly better than—most reported multiplex SNP detection assays.46,48 This is primarily due to the inherent limitations of multiplex systems; in the design phase, the complexity of creating numerous primer pairs that operate harmoniously in a single reaction becomes a major bottleneck; the most obvious bottleneck is the formation of primer dimers and non-specific amplification, which consume key reaction components and inhibit the overall amplification yield. In addition, sequence-specific changes result in certain amplicons being amplified more preferentially than others, leading to severe product imbalance and making accurate quantification of low-abundance targets particularly difficult. The fundamental reason for these issues is the inherent limitations of traditional DNA polymerases, which are typically optimized for simpler single-complex reactions and lack stability to maintain high fidelity and processability when processing multiple templates simultaneously in an environment of intense competition among enzymes, nucleotides, and cofactors. Finally, even if the amplification is successful, there will still be obstacles in the analysis stage: when the Tm of various probes or amplicons is too close, the detection of multiple targets, especially through melting curve analysis, often exceeds the resolution limit of the instrument, making it difficult to clearly distinguish true positive signals.49,50
To ensure the clinical robustness of the assay, we implemented a rigorous two-phase validation workflow. Initially, a calibration phase involving 98 clinical samples was conducted to refine the genotyping criteria. We observed that while purified plasmid standards provide a theoretical baseline, clinical genomic DNA matrices can induce systematic thermal shifts, as exemplified by the 2.0–3.0°C rightward shift in the DRD2 wild-type allele. By establishing integrative criteria that combine statistical Tm windows (Mean Tm ± 3 SDs) with qualitative peak morphology, we successfully accommodated these matrix-induced fluctuations. The subsequent independent validation phase using a blinded cohort of 124 samples yielded 100% concordance with Sanger sequencing, confirming that our established criteria are highly objective and reproducible. Notably, our system is compatible with the current mainstream fluorescent PCR instruments, including ABI ViiA™ 7 (Applied Biosystems, USA) and Hongshi SLAN-96S (Hongshi, Shanghai, China). These results confirm the accuracy, reliability, stability, and applicability of this method, laying the foundation for large-scale clinical application.
However, this study has several limitations. Most notably, there is a lack of prospective clinical trials to assess the clinical and health economic value of this assay for guiding personalized treatment with psychotropic drugs. While previous studies, such as those from the Mayo Clinic, have demonstrated that pharmacogenomic testing can yield significant cost savings and improve treatment outcomes by reducing trial-and-error prescriptions and adverse drug reactions,51 the direct applicability of these findings to our multiplex system warrants further validation. Moreover, it should be noted that while our approach reduces the number of probes needed compared to conventional fluorescent PCR, it increases probe design complexity due to the stringent thermodynamic constraints necessary for Tm differentiation and assay specificity. Furthermore, while the establishment of Tm ± 3SDs criteria and a secondary expert review protocol has minimized interpretive subjectivity, the analysis of complex profiles still benefits from experienced analysts. In instances of significant matrix-induced thermal shifts or peak coalescence (eg., in DRD2 and HTR2A heterozygotes), relying solely on Tm values without considering morphological profile could compromise diagnostic accuracy. To address these challenges, future research should explore the integration of artificial intelligence (AI) tools to streamline probe design and automate the deconvolution of melting curves, thereby enhancing the objectivity and scalability of the assay.52,53
Conclusions
This study is the first to employ multiplex fluorescence melting curve technology to establish a pharmacogenomic assay-specifically designed to detect genetic polymorphisms in Pharmacodynamic (PD) biomarkers associated with psychotropic drug responses and adverse drug reactions. This assay enables the simultaneous detection of 21 genotypes across 7 SNPs in a single reaction tube, exhibits high accuracy, specificity, sensitivity, and stability, and thus provides a reliable tool to support personalized medicine for psychiatric disorders. Future research should focus on prospective clinical studies and AI-powered big data analytics to further align the assay with clinical guidelines, thereby addressing the current gaps in pharmacogenomic testing for PD-related genetic polymorphisms and promoting precision in treatment decision-making.
Data Sharing Statement
The data that support the findings of this study are available from the corresponding author upon reasonable request.
Informed Consent
Written informed consent was obtained from all participants prior to specimen collection. All individuals agreed to the use of their data for research and publication purposes.
Acknowledgment
The authors would like to thank Yehua Wen for her valuable contributions to sample testing, data analysis, and result verification.
Author Contributions
All authors made a significant contribution to the work reported, whether that is in the conception, study design, execution, acquisition of data, analysis and interpretation, or in all these areas; took part in drafting, revising or critically reviewing the article; gave final approval of the version to be published; have agreed on the journal to which the article has been submitted; and agree to be accountable for all aspects of the work.
Disclosure
The authors report no conflicts of interest in this work.
References
1. Cipriani A, Furukawa TA, Salanti G, et al. Comparative Efficacy and Acceptability of 21 Antidepressant Drugs for the Acute Treatment of Adults with Major Depressive Disorder: A Systematic Review and Network Meta-Analysis. Vol. 16. Focus (American Psychiatric Publishing); 2018:420–21
2. Serretti A, Chiesa A, Calati R, Perna G, Bellodi L, De Ronchi D. Common genetic, clinical, demographic and psychosocial predictors of response to pharmacotherapy in mood and anxiety disorders. Int. Clin. Psychopharmacol. 2009;24:1–18. doi:10.1097/YIC.0b013e32831db2d7
3. Machado M, Iskedjian M, Ruiz I, Einarson TR. Remission, dropouts, and adverse drug reaction rates in major depressive disorder: a meta-analysis of head-to-head trials. Curr. Med. Res. Opin. 2006;22:1825–1837. doi:10.1185/030079906X132415
4. Trivedi MH, Rush AJ, Wisniewski SR, et al. Evaluation of outcomes with citalopram for depression using measurement-based care in STAR*D: implications for clinical practice. Am J Psychiatry. 2006;163:28–40. doi:10.1176/appi.ajp.163.1.28
5. Bandelow B, Rüther E. Treatment-resistant panic disorder. CNS Spectrums. 2004;9:725–739. doi:10.1017/S1092852900022379
6. Freire RC, Hallak JE, Crippa JA, Nardi AE. New treatment options for panic disorder: clinical trials from 2000 to 2010. Expert Opin. Pharmacother. 2011;12:1419–1428. doi:10.1517/14656566.2011.562200
7. Bighelli I, Castellazzi M, Cipriani A, et al. Antidepressants versus placebo for panic disorder in adults. Cochrane Database Syst. Rev. 2018;4:Cd010676. doi:10.1002/14651858.CD010676.pub2
8. Hasan A, Falkai P, Wobrock T, et al. World federation of societies of biological psychiatry (wfsbp) guidelines for biological treatment of Schizophrenia, part 1: update 2012 on the acute treatment of schizophrenia and the management of treatment resistance. World J. Biol. Psychiatry. 2012;13:318–378. doi:10.3109/15622975.2012.696143
9. Elsheikh SSM, Müller DJ, Pouget JG. Pharmacogenetics of Antipsychotic Treatment in Schizophrenia. Methods Mol Biol. 2022;2547:389–425.
10. Altar CA, Carhart JM, Allen JD, Hall-Flavin DK, Dechairo BM, Winner JG. Clinical validity: combinatorial pharmacogenomics predicts antidepressant responses and healthcare utilizations better than single gene phenotypes. Pharmacogenomics J. 2015;15:443–451. doi:10.1038/tpj.2014.85
11. Hicks JK, Sangkuhl K, Swen JJ, et al. Clinical pharmacogenetics implementation consortium guideline (CPIC) for CYP2D6 and CYP2C19 genotypes and dosing of tricyclic antidepressants: 2016 update. Clin Pharmacol Ther. 2017;102:37–44. doi:10.1002/cpt.597
12. Beunk L, Nijenhuis M, Soree B, et al. Dutch Pharmacogenetics Working Group (DPWG) guideline for the gene-drug interaction between CYP2D6, CYP3A4 and CYP1A2 and antipsychotics. EJHG. 2024;32:278–285. doi:10.1038/s41431-023-01347-3
13. Bousman CA, Stevenson JM, Ramsey LB, et al. Clinical Pharmacogenetics Implementation Consortium (CPIC) Guideline for CYP2D6, CYP2C19, CYP2B6, SLC6A4, and HTR2A Genotypes and Serotonin Reuptake Inhibitor Antidepressants. Clin Pharmacol Ther. 2023;114:51–68. doi:10.1002/cpt.2903
14. van Westrhenen R, Aitchison KJ, Ingelman-Sundberg M, Jukić MM, van Westrhenen R. Pharmacogenomics of antidepressant and antipsychotic treatment: how far have we got and where are we going? Front. Psychiatry. 2020;11:94. doi:10.3389/fpsyt.2020.00094
15. Yan P, Song M, Gao B, et al. Association of the genetic polymorphisms of metabolizing enzymes, transporters, target receptors and their interactions with treatment response to olanzapine in Chinese Han schizophrenia patients. Psychiatry Res. 2020;293:113470. doi:10.1016/j.psychres.2020.113470
16. Del Casale A, Simmaco M, Modesti MN, et al. DRD2, DRD3, and HTR2A single-nucleotide polymorphisms involvement in high treatment resistance to atypical antipsychotic drugs. Biomedicines. 2023;11:2088. doi:10.3390/biomedicines11072088
17. Yoshikawa A, Li J, Meltzer HY. A functional HTR1A polymorphism, rs6295, predicts short-term response to lurasidone: confirmation with meta-analysis of other antipsychotic drugs. Pharmacogenomics J. 2020;20:260–270. doi:10.1038/s41397-019-0101-5
18. Takekita Y, Fabbri C, Kato M, et al. HTR1A gene polymorphisms and 5-ht1a receptor partial agonist antipsychotics efficacy in schizophrenia. J. Clin. Psychopharmacol. 2015;35:220–227. doi:10.1097/JCP.0000000000000304
19. Wang Y, Tan X, Chen Z, Zhang B, Gao Y, Wang Y. Association between the rs6313 polymorphism in the 5-HTR2A gene and the efficacy of antipsychotic drugs. BMC Psychiatry. 2023;23:682. doi:10.1186/s12888-023-05165-1
20. Maffioletti E, Valsecchi P, Minelli A, et al. Association study between HTR2A rs6313 polymorphism and early response to risperidone and olanzapine in schizophrenia patients. Drug Dev. Res. 2020;81:754–761. doi:10.1002/ddr.21686
21. Wu S, Xing Q, Gao R, et al. Response to chlorpromazine treatment may be associated with polymorphisms of the DRD2 gene in Chinese schizophrenic patients. Neurosci. Lett. 2005;376:1–4. doi:10.1016/j.neulet.2004.11.014
22. Yu YW, Tsai SJ, Liou YJ, Hong CJ, Chen TJ. Association study of two serotonin 1A receptor gene polymorphisms and fluoxetine treatment response in Chinese major depressive disorders. Eur Neuropsychopharmacol. 2006;16:498–503. doi:10.1016/j.euroneuro.2005.12.004
23. Hong CJ, Chen TJ, Yu YW, Tsai SJ. Response to fluoxetine and serotonin 1A receptor (C-1019G) polymorphism in Taiwan Chinese major depressive disorder. Pharmacogenomics J. 2006;6:27–33. doi:10.1038/sj.tpj.6500340
24. Chappell K, Colle R, El Asmar K, et al. Association of the GRIK4 rs1954787 polymorphism with clinical response in antidepressant-treated depressed patients: results from a prospective cohort and meta-analysis. Mol. Psychiatry. 2025;30:1529–1538. doi:10.1038/s41380-024-02765-5
25. Kawaguchi DM, Glatt SJ. GRIK4 polymorphism and its association with antidepressant response in depressed patients: a meta-analysis. Pharmacogenomics. 2014;15:1451–1459. doi:10.2217/pgs.14.96
26. Mullally JA, Chung WK, LeDuc CA, et al. Weight-loss response to naltrexone/bupropion is modulated by the Taq1A genetic variant near DRD2 (rs1800497): a pilot study. Diabetes Obes Metab. 2021;23:850–853. doi:10.1111/dom.14267
27. Kibitov AA, Kiryanova EM, Salnikova LI, Bure S, Kibitov AB, Kibitov AO. The ANKK1/DRD2 gene TaqIA polymorphism (rs1800497) is associated with the severity of extrapyramidal side effects of haloperidol treatment in CYP2D6 extensive metabolizers with schizophrenia spectrum disorders. Drug Metab Pers Ther. 2023;38:133–142. doi:10.1515/dmpt-2022-0143
28. Fang T, Liu MN, Tian XY, et al. The association of FKBP5 polymorphisms with the severity of depressive disorder in patients with methamphetamine use disorders. Front. Psychiatry. 2023;14:1147060. doi:10.3389/fpsyt.2023.1147060
29. Zou YF, Wang F, Feng XL, et al. Meta-analysis of FKBP5 gene polymorphisms association with treatment response in patients with mood disorders. Neurosci. Lett. 2010;484:56–61. doi:10.1016/j.neulet.2010.08.019
30. Shen YC, Chen SF, Chen CH, et al. Effects of DRD2/ANKK1 gene variations and clinical factors on aripiprazole efficacy in schizophrenic patients. J Psychiatr Res. 2009;43:600–606. doi:10.1016/j.jpsychires.2008.09.005
31. Pu M, Zhang Z, Xu Z, et al. Influence of genetic polymorphisms in the glutamatergic and GABAergic systems and their interactions with environmental stressors on antidepressant response. Pharmacogenomics. 2013;14:277–288. doi:10.2217/pgs.13.1
32. Zhang Y, Ren H, Wang Q, et al. Testing the role of genetic variation of the MC4R gene in Chinese population in antipsychotic-induced metabolic disturbance. Sci. China Life Sci. 2019;62:535–543. doi:10.1007/s11427-018-9489-x
33. Kang Z, Qin Y, Sun Y, et al. Multigenetic pharmacogenomics-guided treatment vs treatment as usual among hospitalized men with schizophrenia: a randomized clinical trial. JAMA Netw Open. 2023;6:e2335518. doi:10.1001/jamanetworkopen.2023.35518
34. Hall-Flavin DK, Winner JG, Allen JD, et al. Utility of integrated pharmacogenomic testing to support the treatment of major depressive disorder in a psychiatric outpatient setting. Pharmacogenetics Genom. 2013;23:535–548. doi:10.1097/FPC.0b013e3283649b9a
35. Qin Y, Liu Y, Zhao J, et al. Pharmacogenetic intervention improves treatment outcomes in Chinese adult men with schizophrenia. J Psychiatr Res. 2024;174:129–136. doi:10.1016/j.jpsychires.2024.04.020
36. de Leon J, de Leon J. AmpliChip CYP450 test: personalized medicine has arrived in psychiatry. Expert Rev. Mol. Diagn. 2006;6:277–286. doi:10.1586/14737159.6.3.277
37. Jia Z, Huang J, Yang Y, et al. Establishing national reference materials for genetic testing of cytochrome P450. Pharmacogenetics Genom. 2024;34:175–183. doi:10.1097/FPC.0000000000000532
38. Chen J, Schedl T. A simple one-step PCR assay for SNP detection. microPubl. biol. 2021;2021:10.
39. Amoako KK, Thomas MC, Janzen TW, Goji N. Rapid SNP detection and genotyping of bacterial pathogens by pyrosequencing. Methods Mol Biol. 2017;1492:203–220.
40. Kovalchuk SN, Arkhipova AL. Development of TaqMan PCR assay for genotyping SNP rs211250281 of the bovine agpat6 gene. Anim. Biotechnol. 2023;34:3250–3255. doi:10.1080/10495398.2022.2077742
41. Liao Y, Wang X, Sha C, Xia Z, Huang Q, Li Q. Combination of fluorescence color and melting temperature as a two-dimensional label for homogeneous multiplex PCR detection. Nucleic Acids Res. 2013;41:e76. doi:10.1093/nar/gkt004
42. Fidry M, Zugliani MM, Do Cabo MC, et al. Pharmacogenetic Testing in Treatment-resistant Panic Disorder: a Preliminary Analysis. Clinical practice and epidemiology in mental health. 2024;20e17450179337258.
43. Obliosca JM, Cheng SY, Chen YA, et al. LNA thymidine monomer enables differentiation of the four single-nucleotide variants by melting temperature. J. Am. Chem. Soc. 2017;139:7110–7116. doi:10.1021/jacs.7b03395
44. Rejali NA, Moric E, Wittwer CT. The effect of single mismatches on primer extension. Clin Chem. 2018;64:801–809. doi:10.1373/clinchem.2017.282285
45. Zhang Z, Li L, Yao J. Multiplex one-step direct asymmetric PCR of blood and dual-labelled probe-mediated melting curve for genotyping of MTHFR and MTRR polymorphisms. RSC Adv. 2025;15:75–82. doi:10.1039/D4RA07286C
46. Na W, Rui-Rui Y, Ming-Kai C, et al. Establishment of a fluorescent PCR melting curve method for detecting asthma susceptibility using gene SNP typing. J Asthma. 2020;57:850–857. doi:10.1080/02770903.2019.1619084
47. Yang MJ, Hou YL, Yang XL, Wang CX, Zhi LX, You CG. Development and application of a PCR-HRM molecular diagnostic method of SNPs linked with TNF inhibitor efficacy. Diagnosis. 2019;6:277–286. doi:10.1515/dx-2018-0062
48. Yu Z, Shang Z, Huang Q, Wu H, Patil S. Rapid detection of slco1b1 polymorphisms using duplex fluorescence melting curve analysis: implications for personalized drug dosing in clinical settings. Drug Des Devel Ther. 2024;18:4889–4899. doi:10.2147/DDDT.S491972
49. Tripathi G, Rathinam RB. The Challenges of PCR Amplification in Disease Diagnosis. In: Springer Nature Singapore. Das BK, Kumar Veditors. Laboratory Techniques for Fish Disease Diagnosis;Vol. 2025:341–357.
50. Huang Q, Chen D, Du C, et al. Highly multiplex PCR assays by coupling the 5’-flap endonuclease activity of Taq DNA polymerase and molecular beacon reporters.
51. Bielinski SJ, Olson JE, Pathak J, et al. Preemptive genotyping for personalized medicine: design of the right drug, right dose, right time-using genomic data to individualize treatment protocol. Mayo Clinic Proceedings. 2014;89:25–33. doi:10.1016/j.mayocp.2013.10.021
52. Miglietta L, Xu K, Chhaya P, et al. Adaptive filtering framework to remove nonspecific and low-efficiency reactions in multiplex digital pcr based on sigmoidal trends. Anal. Chem. 2022;94:14159–14168. doi:10.1021/acs.analchem.2c01883
53. Promja S, Puenpa J, Achakulvisut T, et al. Machine learning-assisted real-time polymerase chain reaction and high-resolution melt analysis for sars-cov-2 variant identification. Anal. Chem. 2023;95:2102–2109. doi:10.1021/acs.analchem.2c05112
 © 2026 The Author(s). This work is published and licensed by Dove Medical Press Limited. The
full terms of this license are available at https://www.dovepress.com/terms
and incorporate the Creative Commons Attribution
- Non Commercial (unported, 4.0) License.
By accessing the work you hereby accept the Terms. Non-commercial uses of the work are permitted
without any further permission from Dove Medical Press Limited, provided the work is properly
attributed. For permission for commercial use of this work, please see paragraphs 4.2 and 5 of our Terms.
© 2026 The Author(s). This work is published and licensed by Dove Medical Press Limited. The
full terms of this license are available at https://www.dovepress.com/terms
and incorporate the Creative Commons Attribution
- Non Commercial (unported, 4.0) License.
By accessing the work you hereby accept the Terms. Non-commercial uses of the work are permitted
without any further permission from Dove Medical Press Limited, provided the work is properly
attributed. For permission for commercial use of this work, please see paragraphs 4.2 and 5 of our Terms.