Back to Journals » International Journal of Women's Health » Volume 13
An Aging-Related Gene Signature-Based Model for Risk Stratification and Prognosis Prediction in Breast Cancer
Authors Yuan J, Duan F ![]() , Zhai W, Song C, Wang L, Xia W, Hua X
, Zhai W, Song C, Wang L, Xia W, Hua X ![]() , Yuan Z, Bi X, Huang J
, Yuan Z, Bi X, Huang J
Received 19 August 2021
Accepted for publication 24 October 2021
Published 3 November 2021 Volume 2021:13 Pages 1053—1064
DOI https://doi.org/10.2147/IJWH.S334756
Checked for plagiarism Yes
Review by Single anonymous peer review
Peer reviewer comments 2
Editor who approved publication: Dr Everett Magann
Jing Yuan,1,* Fangfang Duan,2,* Wenyu Zhai,3,* Chenge Song,2 Li Wang,2 Wen Xia,2 Xin Hua,2 Zhongyu Yuan,2 Xiwen Bi,2 Jiajia Huang2
1Departments of Experimental Research, State Key Laboratory of Oncology in South China, Collaborative Innovation Center for Cancer Medicine, Sun Yat-sen University Cancer Center, Guangzhou, Guangdong, People’s Republic of China; 2Departments of Medical Oncology, State Key Laboratory of Oncology in South China, Collaborative Innovation Center for Cancer Medicine, Sun Yat-sen University Cancer Center, Guangzhou, Guangdong, People’s Republic of China; 3Departments of Thoracic Surgery, State Key Laboratory of Oncology in South China, Collaborative Innovation Center for Cancer Medicine, Sun Yat-sen University Cancer Center, Guangzhou, Guangdong, People’s Republic of China
*These authors contributed equally to this work
Correspondence: Jiajia Huang; Xiwen Bi
Department of Medical Oncology, State Key Laboratory of Oncology in South China, Collaborative Innovation Center for Cancer Medicine, Sun Yat-sen University Cancer Center, 651 Dongfeng Road East, Guangzhou, Guangdong, 510060, People’s Republic of China
Email [email protected]; [email protected]
Background: Aging, an inevitable process characterized by functional decline over time, is a significant risk factor for various tumors. However, little is known about aging-related genes (ARGs) in breast cancer (BC). We aimed to explore the potential prognostic role of ARGs and to develop an ARG-based prognosis signature for BC.
Methods: RNA-sequencing expression profiles and corresponding clinicopathological data of female patients with BC were obtained from public databases in The Cancer Genome Atlas (TCGA) and Gene Expression Omnibus (GEO). An ARG-based risk signature was constructed in the TCGA cohort based on results of least absolute shrinkage and selection operator (LASSO) and multivariate Cox regression analysis, and its prognostic value was further validated in the GSE20685 cohort.
Results: A six ARG-based signature, including CLU, DGAT1, MXI1, NFKBI, PIK3CA and PLAU, was developed in the TCGA cohort and significantly stratified patients into low- and high-risk groups. Patients in the former group showed significantly better prognosis than those in the latter. Multivariate Cox regression analysis demonstrated that the ARG risk score was an independent prognostic factor for BC. A predictive nomogram integrating the ARG risk score and three identified factors (age, N- and M-classification) was established in the TCGA cohort and validated in the GSE20685 cohort. Calibration plots showed good consistency between predicted survival probabilities and actual observations.
Conclusion: A novel ARG-based risk signature was developed for patients with BC, which can be used for individual prognosis prediction and promoting personalized treatment.
Keywords: breast cancer, aging, prognostic signature, risk stratification
Introduction
Breast cancer (BC) ranks the first among diagnosed malignancies and is the leading cause of tumor-related deaths among women worldwide.1 Despite advances in the landscape of diagnosis and therapy, the mortality of BC remains a global challenge. Clinical outcomes among patients are highly variable, which is potentially caused by patient heterogeneity.2,3 Traditional clinicopathological factors, including tumor size, lymph nodes status and pathological grades, are independently associated with the prognosis of BC and lead to a better understanding of individual risk assessment of recurrence. However, they have limited predictive accuracy in prognostic predictions and are limited to early-stage BC, which are characterized by a small size or without lymph node metastasis.4 For example, while recurrence and death are often seen in patients with early-stage BC within a short time of diagnosis, patients staged III/IV or with pathological grade III breast tumors can survive for over 5 years.5 Although the tumor-node-metastasis (TNM) staging system is commonly used to predict individual prognosis, it just contain clinical factors and neglects genetic characteristics.6 Thus, it is essential to exploit new prognostic biomarkers for classifying heterogeneous populations with BC and guiding personalized treatment.
Aging, an inevitable and important biological process, is characterized by gradual functional deterioration of many tissues. The resulting chronic and age-related pathologies are strong risk factors for several disorders, such as cancer, cardiovascular, neurodegenerative, metabolic, and neoplastic diseases.7–10 At a cellular level, aging is associated with genomic instability, cellular senescence, mitochondrial dysfunction etc, which leads to the accumulation of irreparable damage and lethal substances.11,12
As the main cause of aging, senescence has been found to occur in vivo in many tumors and it has an antitumor effect, where it irreversibly arrests cell growth and development, suppressing the uncontrolled proliferation of tumor cells.13–15 Compared with young cells, senescent cells can present a large flat morphology and reduced motility, which may suppress cell migration, invasion, and metastasis.16 However, the mechanisms and influence of cellular senescence on malignancy are very intricate. Aging-related genes (ARGs) play a key role in the generation and regulation of senescent cells and possibly affect tumor cells. Although ARGs inhibit cancer by managing tumor cellular senescence, they can facilitate the initiation, progression, and metastasis of tumors.13,14,17–19 Identifying key characteristics and induction of senescence in tumor cells has been a recent focus of cancer research,13 as researchers have explored and confirmed their potential diagnostic or prognostic value as biomarkers in malignancy, including colorectal and lung cancer.10,20,21 However, its prognostic value in BC remains unknown as no precise clinical signature has been established.
Since a comprehensive model containing multi-genes has better predictive capacity than one consisting of just one gene,22 we used The Cancer Genome Atlas (TCGA) database in this study to establish an ARG-based signature for individually predicting survival outcomes of BC and validated its prognostic value in the Gene Expression Omnibus (GEO) dataset. Finally, we developed a prognostic nomogram integrating the ARG-based signature and other clinicopathological factors to provide a precise prognostic prediction of BC.
Materials and Methods
Data Collection and Preparation
Gene expression files and corresponding clinicopathological information of patients with BC were downloaded from the TCGA (https://tcga-data.nci.nih.gov/tcga/) and GEO databases (https://www.ncbi.nlm.nih.gov/geo/). The TCGA dataset was used as a training cohort, and the GSE20685 dataset was used for validation. A total of 307 human ARGs were obtained from the Human Aging Genomic Resources 3 (Supplementary Table 1).
Construction and Validation of the Prognostic ARG Signature
First, we performed univariate Cox regression analysis to select candidate ARGs for the prognostic-related signature (P < 0.05) in the TCGA cohort. A least absolute shrinkage and selection operator (LASSO) regression analysis was then performed to narrow down the ARGs and determine the best weighting coefficient of each one. Finally, we used multivariate Cox regression analysis to assess the prognostic contributions of these candidate ARGs in overall survival (OS) and construct an ARG signature. The risk score of each case in this signature was calculated according to their normalized expression levels and corresponding regression coefficients. The specific formula was as follows: risk score = sum (each ARG expression level × corresponding coefficients). BC cases in the TCGA cohort were stratified into high- and low-risk groups according to the cut-off point of the risk score derived from maximally selected rank statistics. We used Kaplan–Meier curve analysis with a Log rank test to compare OS differences between these two groups.
Similarly, the risk score of cases in the GSE20685 dataset was calculated according to the same formula as the TCGA cohort to validate this prognostic signature. Subjects in the GSE20685 cohort were also stratified into two different risk groups according to the cut-off value of the risk score from maximally selected rank statistics. Then, Kaplan–Meier curve analysis also was performed to assess the relationship between ARG signature and OS in the validation set.
Estimating the Immune Cell Infiltration Landscape
We uploaded the normalized ARG expression files to the CIBERSORT web portal (https://cibersort.stanford.edu/), which is an algorithm to computationally characterize immune cell compositions.23,24 Percentages of 22 human immune cells infiltrating in BC subjects were calculated by CIBERSORT and compared according to the mode between the high- and the low-risk group. Additionally, we assessed the identified ARGs and the level of correlation of the infiltration of immune cells via the TIMER database,25 in which data were collected on six types of immune infiltrates, ie, B-cells, CD4+ T-cells, CD8+ T-cells, neutrophils, macrophages, and myeloid dendritic cells.
Establishment of a Predictive Nomogram
A nomogram for the predictive model integrating the ARG risk signature and other clinicopathological features identified from multivariate Cox regression analysis was established in the TCGA training cohort. We also performed calibration curves for the survival probability at 1-, 3- and 5-year to evaluate the predictive precision of this nomogram in both the TCGA and the GSE20685 cohorts.
Statistical Analysis
Expression levels of mRNAs were listed as raw data and log2 normalized. Continuous variables were shown as mean with range, and categorical ones as percentages. The cut-off value of the risk score maximizing differences between groups was determined by maximally selected rank statistics using “maxstat” R package according to an outcome-oriented approach for OS.26 Survival differences between these two risk groups were compared using Kaplan–Meier curves with a Log rank test. We conducted univariate and multivariate Cox regression analyses to screen out independent prognostic indicators for OS and established a prognostic nomogram model by “rms” R package, whose predictive accuracy was evaluated by calibration curves. A Wilcox test was performed to compare the proportions of different tumor-infiltrating immune cells between these two risk groups. Statistical analysis was performed using SPSS (version 22.0, IBM, Corp., Armonk, NY) and R software (version 4.0.1, Vanderbilt University, Nashville, TN). A p value <0.05 was considered to be statistically significant.
Results
Identification of a Prognosis-Related ARG Signature
After removing 58 cases with missing survival data, 1031 subjects from the TCGA cohort and 327 subjects from the GSE20685 cohort were included in this study. Among them, 31 subjects in the TCGA set lacked clinicopathological information; therefore, we included a final total of 1327 subjects: 1000 from the training TCGA cohort and 327 in the validation GSE20685 cohort. The clinicopathological features of these two cohorts are summarized in Table 1. These data underwent Cox regression analysis of OS, combining the ARG risk scores with other clinicopathological features (Figure 1).
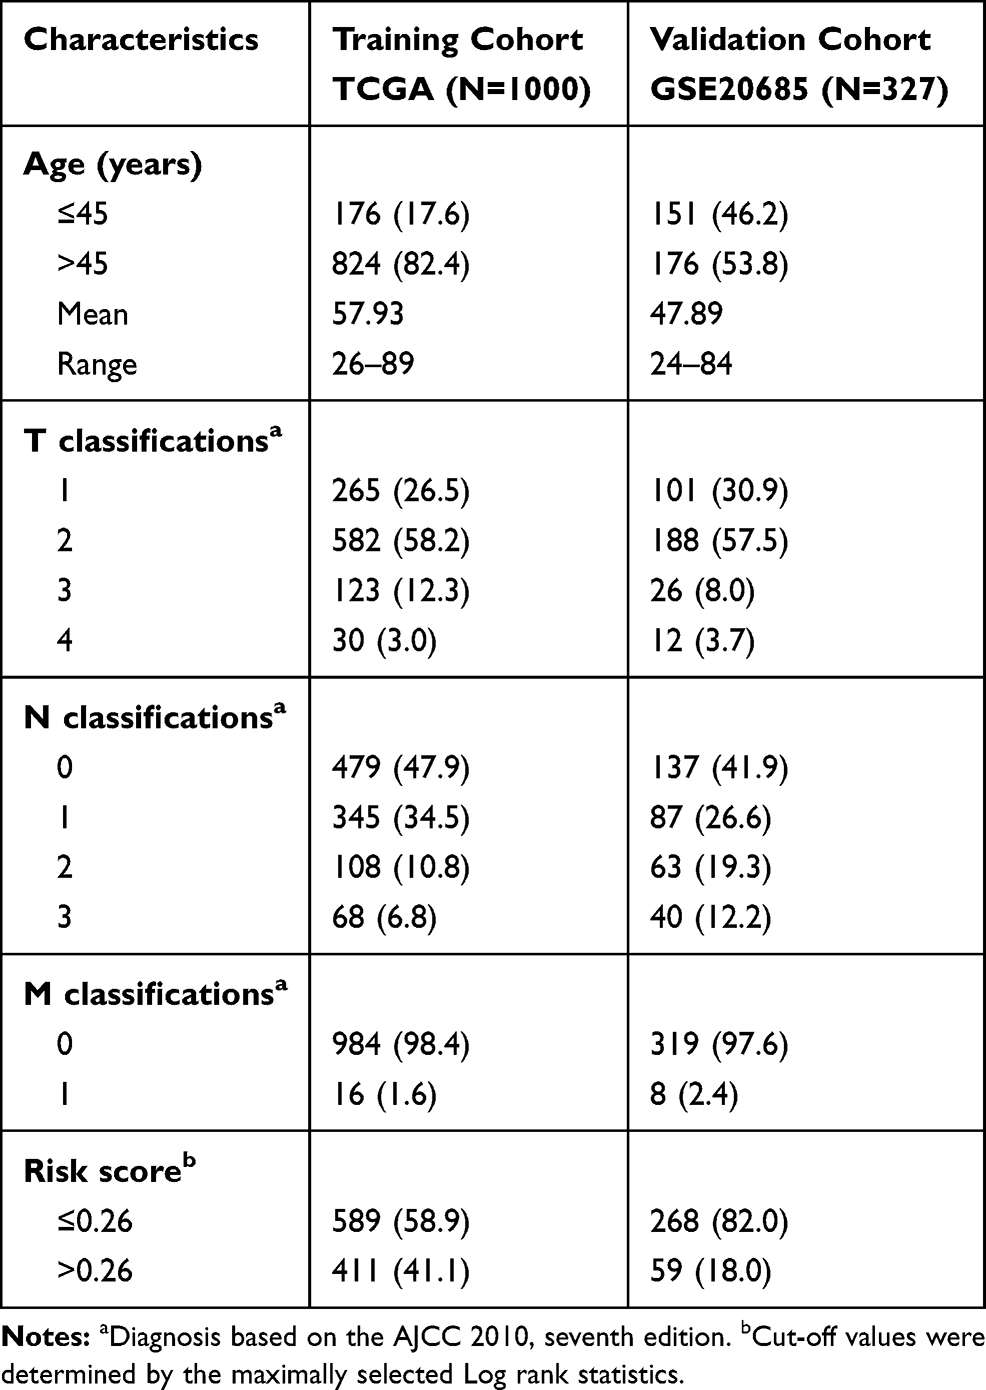 |
Table 1 Clinical Co-Variates of the Training and Validation Cohorts |
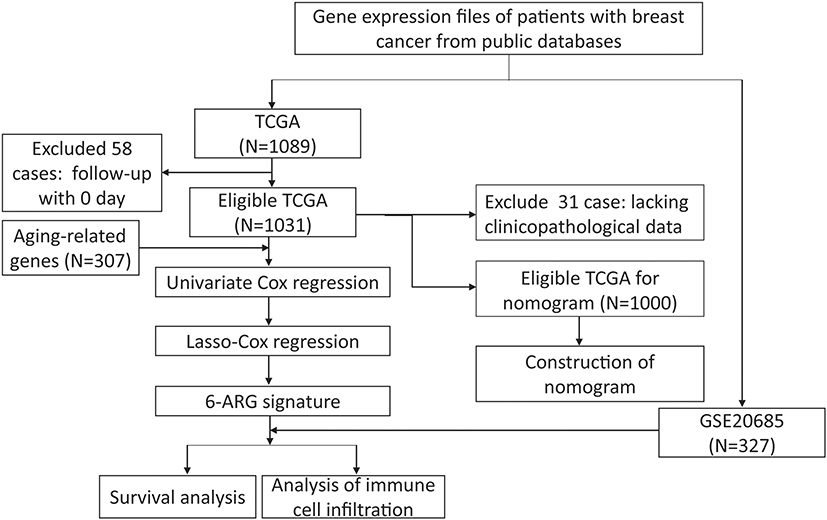 |
Figure 1 Flow chart of data collection and analysis. |
First, we performed univariate Cox regression analysis using mRNA expression profiles of each ARG to select survival-related ARGs. We identified 33 and 15 OS-related ARGs from the TCGA and GEO datasets, respectively (Supplementary Tables 2 and 3). Then, 33 ARGs were entered into LASSO regression analysis to decrease the number of ARGs in the prognostic signature (Figure 2A and B). A total of 14 genes from LASSO analysis underwent multivariate Cox regression analysis to develop an ARG risk signature (Figure 2C). Finally, a 6-ARG risk signature was developed using 1031 BC cases from the TCGA cohort. The risk score was specifically calculated based on a linear combination of gene expression levels and their corresponding regression coefficients. The specific formula was as follows: risk score = CLU × 4.8531e-7 + DGAT1 × 8.1029e-5 + MXI1 × 4.3561e-5 – NFKBIA × 5.7371e-5 + PIK3CA × 2.8901e-5 + PLAU × 1.5526×e-5.
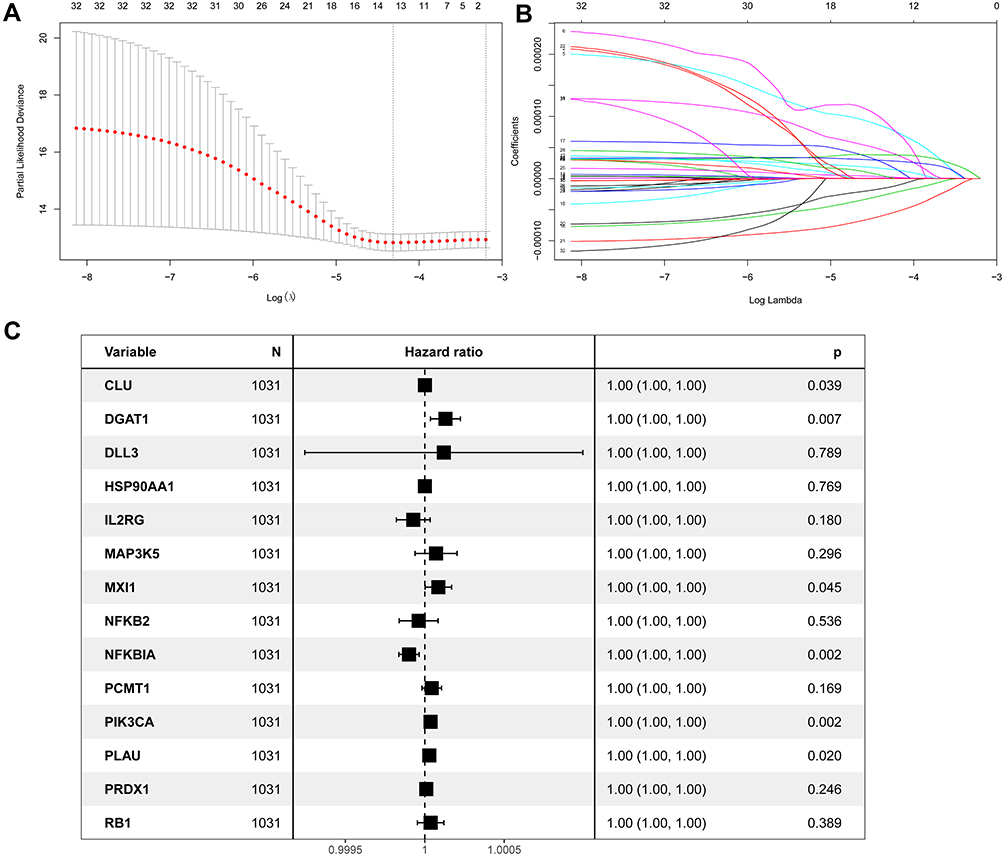 |
Figure 2 Identification of a prognosis-related ARG-based signature in the TCGA training cohort. (A) Selection of the optimal candidate genes in the LASSO model. (B) LASSO coefficients of prognosis-associated ARGs, each curve represents a gene. (C) Forest plots showing results of univariate Cox regression analysis between the candidate ARGs expression and overall survival. |
Further, we analyze the potential of these six identified genes (CLU, DGAT1, MXI1, NFKBIA, PIK3CA and PLAU) in predicting OS of breast cancer patients via Kaplan–Meier plotter databases (Supplementary Figure 1), which indicated that these six ARGs might be general factors to show a relatively prognostic value in breast cancer.
Independent Prognostic Value of the ARG Signature in the Training Cohort
In the TCGA cohort, a value of 0.26 was determined as the cut-off value of the risk score to maximally divide samples into risk-stratified groups (high-risk N = 431; low-risk N = 600) by means of the maximally selected rank statistics (Figure 3A). Figure 3B shows the distribution of risk scores. Compared with the high-risk group, there were fewer deaths from BC in the low-risk group (Figure 3C). A heat map showing the different expression levels of these six ARGs between these two risk groups was plotted (Figure 3D). Additionally, patients in the high-risk group had a significantly worse OS than patients in the low-risk group in the training cohort (P < 0.0001; Figure 3E). The Cox regression analysis showed that the ARG risk signatures remained significantly related to OS after adjustment of other clinicopathological factors in the training cohort (HR = 3.17, 95% CI = 2.35–4.28, P < 0.001; Figure 3F).
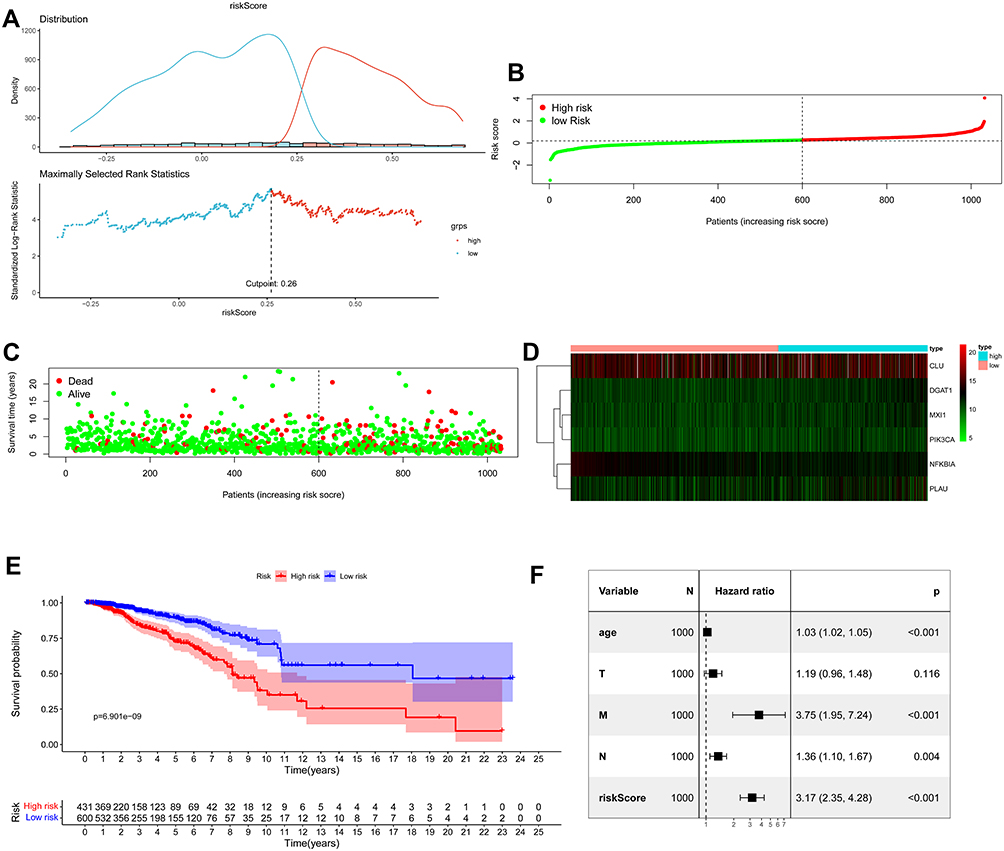 |
Figure 3 Assessment of prognostic value of the ARG signature model in the TCGA training cohort. (A) Determination of cut-off value of ARGs risk scores by the maximally selected Log rank statistics. (B) The distribution of risk scores in the TCGA. (C) Patient distribution in the high- and low-risk group according to overall survival status. (D) The heat map showing expression profiles of the six ARGs. (E) Kaplan–Meier curves for the overall survival of patients in the high- and low-risk group. (F) Multivariate Cox regression analysis of ARGs signature and other clinicopathological factors. |
Independent Prognostic Value of the ARG Signature in the Validation Cohort
In the GSE20685 validation cohort, we also divided patients with BC into high- (N = 59) and low-risk (N = 268) groups based on the maximally selected rank statistics. Distribution of risk score is presented in Figure 4A. Significantly fewer deaths occurred in the low-risk group than in the high-risk group (Figure 4B). Different expression profiles of the six hub ARGs between these two groups were plotted in a heat map (Figure 4C). The Kaplan–Meier curves showed a significantly better OS in the low-risk group compared with the high-risk group (Figure 4D). The Cox regression analysis showed that ARG risk signature remained an independent factor for OS after controlling for age and T, N and M classification (HR = 2.60, 95% CI = 1.58–4.27, p < 0.001; Figure 4E).
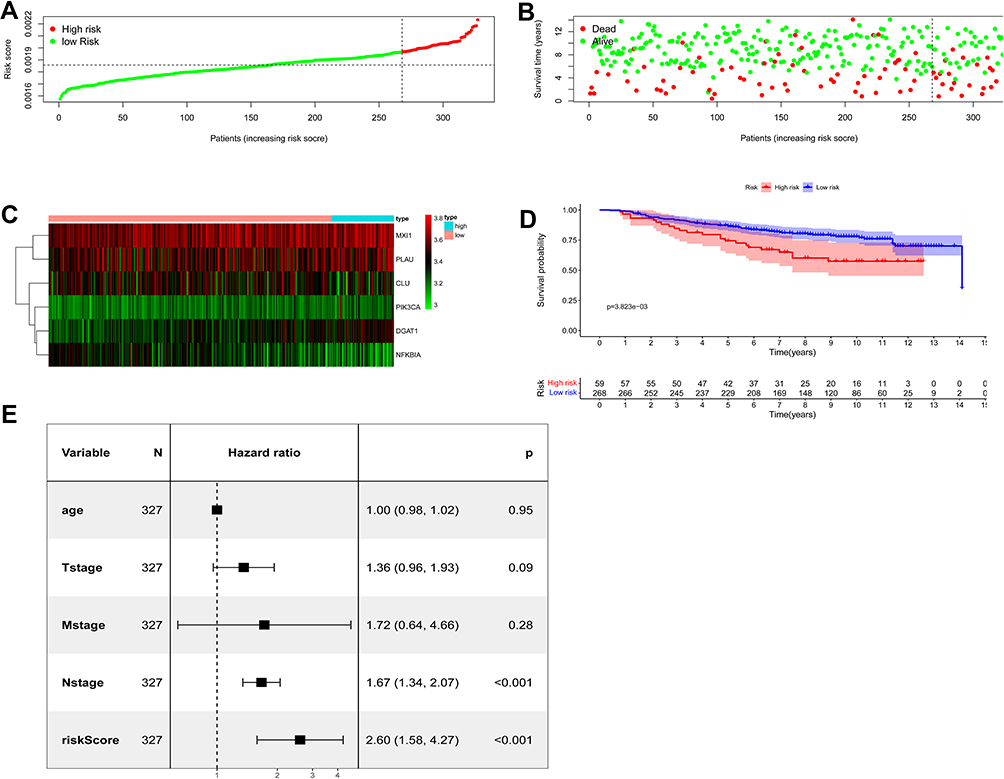 |
Figure 4 Assessment of prognostic value of the ARG signature model in the GSE20685 validation cohort. (A) The distribution of risk scores in the GSE20685. (B) Patient distribution in the high- and low-risk group according to overall survival status. (C) The heat map showing expression profiles of the six ARGs. (D) Kaplan–Meier curves for the overall survival of patients in the high- and low-risk group. (E) Multivariate Cox regression analysis of ARGs signature and other clinicopathological factors. |
Infiltration of Different Immune Cells in Breast Cancer
To further understand the association between ARG risk scores and tumor immunity, we used the CIBERSORT algorithm to screen the RNA-seq datasets of the TCGA data and investigate the infiltration landscape of different immune cells. Proportions of different immune cell types between these two risk groups were significantly different from each other in the TCGA dataset (Figure 5A and B). Figure 5C shows the correlation among all immune cell types. A violin plot showing different infiltration of immune cell types between the high- and low-risk group was produced, which suggested that infiltrating proportions of naïve B cells, resting CD4+ memory T cells, CD8+ T cells and monocytes were significantly lower in the high-risk group. Compared with the low-risk group, the high-risk group had higher proportions of M0 and M2 macrophages (Figure 5D).
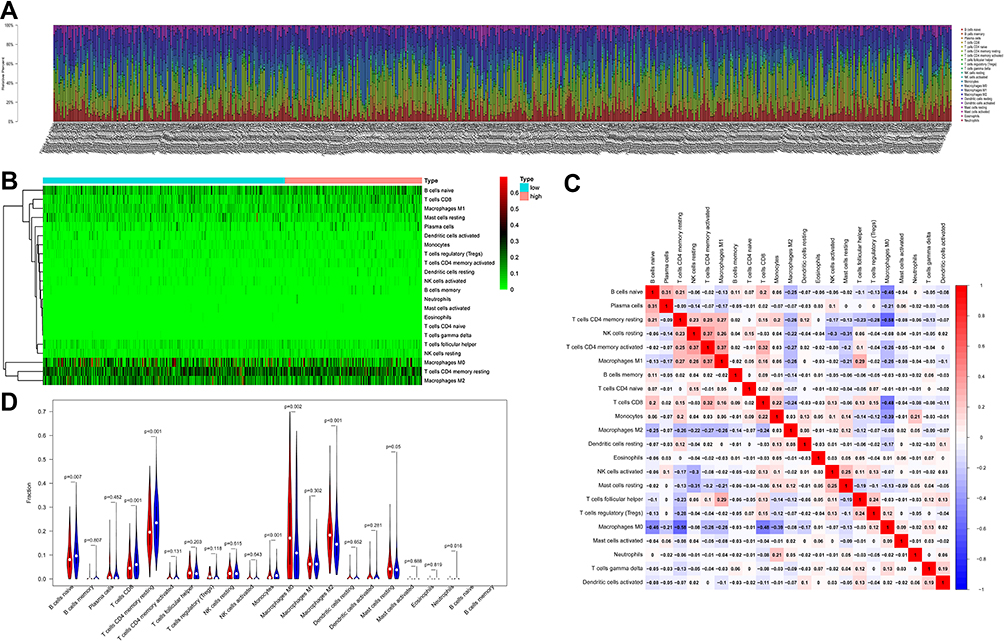 |
Figure 5 The landscape of immune cell infiltration between the high- and low-risk group in the TCGA training cohort. (A) Barplot of different immune cell infiltrations. (B) Heat map of the tumor-infiltrating cell proportions. (C) Correlation matrix of the association between the expression level of the six ARGs and tumor-infiltrating immune cell infiltrations. (D) Violin plot showing differences of infiltrating immune cell types between the low- and the high-risk group. |
Additionally, we analyzed the identified ARGs and the tumor infiltration of six types of immune cells (CD4 + T cells, CD8 + T cells, B cells, neutrophils, macrophages, and myeloid dendritic cells) by TIMER to determine whether there is a correlation between tumor infiltration and immune cells. As shown in Supplementary Figure 2, the expression of DGAT1 was positively correlated with the infiltrating levels of B cells (partial.cor=0.106, p=7.88e-04), but it was negatively associated with the infiltrating levels of CD8+ T cells (partial.cor=−0.163, p=2.33e-07) and neutrophils (partial.cor=−0.187, p=1.35e-02). The expression of NFKBIA was positively related to the infiltrating levels of myeloid dendritic cells (partial.cor= 0.226, p=5.81e-13), neutrophils (partial.cor=0.214, p=8.39e-12) and CD4+ T cells (partial.cor=0.216, p=5.97e-12). Similarly, MXI1 was also positively related to infiltrating levels of CD4+ T cells (partial.cor=0.207, p=4.00e-11), but it was negatively associated with B cells (partial.cor=−0.133, p=2.46e-05) and macrophage cells (partial.cor=−0.189, p=1.84e-09). PIK3CA was positively associated with infiltrating levels of neutrophils (partial.cor=0.424, p=1.20e-44), macrophages (partial.cor=0.375, p=1.56e-34) and CD8+ T cells (partial.cor=0.302, p=2.04e-22), but it was negatively related to B cells (partial.cor=−0.137, p=1.51e-05). The expression of PLAU was negatively related to the infiltrating levels of CD4+ T cells (partial.cor=−0.164, p=2.07e-07), but it was positively related to the infiltrating levels of myeloid dendritic cells (partial.cor=0.260, p=8.21e-17), neutrophils (partial.cor=0.363, p=2.11e-32), CD8+ T cells (partial.cor=0.210, p=2.20e-11) and macrophages (partial.cor=0.469, p=1.89e-55).
Development of a Nomogram Based on ARG Signatures for BC
Clinicopathological variates and ARG risk scores of these two cohorts were presented as categorical variables (Table 1). Based on the results of multivariate Cox regression analysis in the TCGA training cohort, ARG risk scores and three other clinicopathological factors, including age, N- and M-classification, were selected to develop a visualized model to individually predict OS probability at 1-, 3- and 5-years (Figure 6A). We performed bootstrap validation in this nomogram and calculated its C-index of 0.741 (95% CI: 0.694–0.788), which suggested good performance in predicting OS for BC. Calibration curves, whose Y- and X-axis represent the actual and predicted survival rate from the nomogram, respectively, were plotted in both the TCGA training (Figure 6B) and the GSE20685 cohort (Figure 6C) to assess the predictive accuracy and clinical practicability of this nomogram. The calibration plot for OS probability at 1-, 3- and 5-year suggested satisfactory consistency between the actual and predicted survival probabilities.
 |
Figure 6 Development of a nomogram based on ARGs signature for predicting overall survival of patients with BC. (A) The nomogram plot integrating ARG risk score, age, N- and M-classification in the TCGA training cohort. (B) The calibration plot for the probability of 1-, 3-, and 5-year OS in the TCGA training cohort. (C) The calibration plot for the probability of 1-, 3-, and 5-year OS in the GSE20685 validation cohort. |
Discussion
In the current study, we comprehensively explored the association between ARG expression levels and prognosis of patients with BC, and constructed a novel prognostic risk score containing six ARGs: CLU, DGAT1, MXI1, NFKBIA, PIK3CA and PLAU. Based on the TCGA dataset, the risk score was confirmed to be an independent prognostic feature for OS according to the multivariate Cox regression analysis. Further, a predictive nomogram based on this ARG signature for individual decision-making in the clinic was developed and validated in the GEO dataset GSE20685. Moreover, we found that this ARG risk signature was significantly related to different antitumor immune cell infiltration levels in the tumor microenvironment of BC.
With the advancement of freely available public TCGA and GEO databases, risk prognostic models for BC combining RNA sequencing data and clinicopathological factors have been rapidly established.4,27 However, most models are limited to factors such as ferroptosis, energy metabolism, autography, immune infiltration, and long non-coding RNAs,28–32 and few have been clinically extended. In addition, there are few specific studies about the prognostic role of the ARG risk signatures in BC. Biologically speaking, aging is a spontaneous and inevitable process in organisms, characterized by decline of function.7 Pathologically, it can lead to metabolic disorders, declining immune response and malnutrition, and can induce many chronic diseases, including cancer.10,17 Aging can also promote carcinogenesis, tumor development and metastasis,13,14,17–19 and is a significant risk factor for colorectal tumor and lung carcinoma.20,21 Therefore, novel aging-related markers can potentially be used to predict cancer prognosis,33 so it is vital to understand the association between signature of aging and BC. In this study, our nomogram presented good calibration and discrimination in the TCGA set. All these suggested that our ARG prognostic nomogram had adequate ability to predict survival outcomes in patients with BC. Unfortunately, more senior patients are not typically regarded as a population for underserved prognostic. However, the application of an “aging signature” in younger patients may be very profound.
In our ARG risk scores formula, diacylglycerol-acyltransferase 1 (DGAT1) was mostly unfavorable for survival outcomes. It is a transmembrane protein mainly residing in the endoplasmic reticulum and has been proven as a required target for suppressing growth of malignant cells and inducing apoptosis of glioblastoma,34–36 but studies about its effect on BC are rare. Clusterin (CLU), an ATP-dependent molecular chaperone, is abnormally upregulated and correlated to tumor progression, invasion and chemoresistance in numerous cancers.37 Several studies have explored its potential value in predicting therapeutic response to chemotherapy and a possible metastasis-promoting mechanism in breast cancer.38,39 The deficiency of MAX interactor 1 (MXI1), which is considered as a potential tumor-suppressor, may cause tumorigenesis.40 Published studies have demonstrated that its low expression is related to poor BC survival outcomes,41 but the specific mechanism is poorly understood. Mutations in phosphatidylinositol-4,5-bisphosphate 3-kinase catalytic subunit alpha (PIK3CA) are highly represented and lead to resistance to chemo-/endocrine therapy and a poor prognosis in BC.42 Therefore, novel drugs targeting PIK3CA can extend the therapeutic landscape for patients with BC.43 Plasminogen activator urokinase (PLAU), a protease of the plasminogen activator family, is involved in cell migration and adhesion by activating several signaling pathways. Its overexpression has been found in BC and may promote tumor migration and invasion and cause poor survival outcomes.44 NFKBIA, an inhibitor-alpha of nuclear factor-κB, was the only one associated with positive survival outcomes among the six ARG signatures in the current study. Its polymorphism is related to cancer risks, including breast tumors,45–47 but its value as a prognostic factor in BC remains unclear.
Immune responses in tumors are usually triggered by cellular senescence, and immune cell infiltration in the tumor microenvironment contributes to tumor growth.16 However, the association between immune cell infiltration and aging is poorly understood in BC. In our study, we used the CIBERSORT algorithm to calculate fractions of tumor-infiltrating immune cells. Compared with the low-risk group, the high-risk group had significantly lower infiltrating proportions of tumor-killing immune cells, such as naïve B cells, resting CD4+ memory T cells, CD8+ T cells and monocytes, but had higher proportions of M0 and M2 macrophages, which can facilitate tumor proliferation and progression.48 The TIMER analysis findings indicated that these identified ARGs could distinguish different characteristics of tumor immune cells in BC. Thus, we can demonstrate that the ARG risk signature is significantly related to different tumor immune cell infiltration levels in BC, where patients in the high-risk group tend to have less cytotoxic lymphocyte infiltration. However, more studies are necessary to reveal the specific prognostic relationship of these immune cells in BC.
There are some limitations in this study. First, the ARG prognostic model was obtained through bioinformatic analysis of public TCGA and GEO databases, the cohort characteristics might be biased (with regard to demographics and event technical platforms). Therefore, further validation with prospective, multicenter, real-world sets or experimental data is needed. Second, we only preliminarily explored the potential association between the identified ARG risk signature and antitumor immune cell infiltration, so further studies are needed to find the underlying mechanisms. Third, although we integrated our ARG risk scores with the TNM classification in the prognostic nomogram, the contribution of each ARG in our score remains unknown.
In conclusion, we established and validated a survival prognostic model for BC, integrating a novel ARG risk signature and other clinical factors. It could be used as a practical tool for deciding individual therapeutic strategy and predicting clinical outcomes in patients with BC.
Data Sharing Statement
The datasets used and/or analyzed during current study are available from the corresponding author on reasonable request.
Ethics Approval and Consent to Participate
This study was exempt from approval by the Ethics Committee of Sun Yat-sen University Cancer Center, because all data analyzed in the current study were downloaded from public databases of the TCGA (https://tcga-data.nci.nih.gov/tcga/) and GEO (https://www.ncbi.nlm.nih.gov/geo/). We just reviewed gene expression files and corresponding clinicopathological information of patients without impairing their health and privacy disclosure.
Author Contributions
JY, FFD, WYZ, CGS, LW, WX, XH, ZYY, XWB and JJH contributed to conception, study design, execution, data acquisition, analysis, interpretation, and have written and substantially revised this manuscript. All authors reviewed and agreed on the final version of this manuscript, took responsibility and were accountable for the contents of this article.
Funding
This research was supported by the cultivation foundation for the junior teachers in Sun Yat-sen University (No. 20ykpy164).
Disclosure
The authors declare no conflicts of interest.
References
1. Siegel RL, Miller KD, Jemal A. Cancer statistics, 2020. CA Cancer J Clin. 2020;70(1):7–30. doi:10.3322/caac.21590
2. Sachs N, de Ligt J, Kopper O, et al. A living biobank of breast cancer organoids captures Disease heterogeneity. Cell. 2018;172(1–2):373–86.e10. doi:10.1016/j.cell.2017.11.010
3. Yeo SK, Guan JL. Breast cancer: multiple subtypes within a tumor? Trends Cancer. 2017;3(11):753–760. doi:10.1016/j.trecan.2017.09.001
4. Latha N, Rajan A, Nadhan R, et al. Gene expression signatures: a tool for analysis of breast cancer prognosis and therapy. Crit Rev Oncol Hematol. 2020;151:102964. doi:10.1016/j.critrevonc.2020.102964
5. Waks AG, Winer EP. Breast cancer treatment: a review. JAMA. 2019;321(3):288–300. doi:10.1001/jama.2018.19323
6. Balachandran VP, Gonen M, Smith JJ, DeMatteo RP. Nomograms in oncology: more than meets the eye. Lancet Oncol. 2015;16(4):e173–80. doi:10.1016/S1470-2045(14)71116-7
7. Shavlakadze T, Morris M, Fang J, et al. Age-related gene expression signature in rats demonstrate early, late, and linear transcriptional changes from multiple tissues. Cell Rep. 2019;28(12):3263–73.e3. doi:10.1016/j.celrep.2019.08.043
8. Armanios M, de Cabo R, Mannick J, Partridge L, van Deursen J, Villeda S. Translational strategies in aging and age-related disease. Nat Med. 2015;21(12):1395–1399. doi:10.1038/nm.4004
9. Benayoun BA, Pollina EA, Singh PP, et al. Remodeling of epigenome and transcriptome landscapes with aging in mice reveals widespread induction of inflammatory responses. Genome Res. 2019;29(4):697–709. doi:10.1101/gr.240093.118
10. Smetana K
11. Yin D, Chen K. The essential mechanisms of aging: irreparable damage accumulation of biochemical side-reactions. Exp Gerontol. 2005;40(6):455–465. doi:10.1016/j.exger.2005.03.012
12. López-Otín C, Blasco MA, Partridge L, Serrano M, Kroemer G. The hallmarks of aging. Cell. 2013;153(6):1194–1217. doi:10.1016/j.cell.2013.05.039
13. Calcinotto A, Kohli J, Zagato E, Pellegrini L, Demaria M, Alimonti A. Cellular senescence: aging, cancer, and injury. Physiol Rev. 2019;99(2):1047–1078. doi:10.1152/physrev.00020.2018
14. Mosteiro L, Pantoja C, Alcazar N, et al. Tissue damage and senescence provide critical signals for cellular reprogramming in vivo. Science. 2016;354(6315):. doi:10.1126/science.aaf4445
15. He S, Sharpless NE. Senescence in health and disease. Cell. 2017;169(6):1000–1011. doi:10.1016/j.cell.2017.05.015
16. Zhao L, Zhang Y, Gao Y, et al. JMJD3 promotes SAHF formation in senescent WI38 cells by triggering an interplay between demethylation and phosphorylation of RB protein. Cell Death Differ. 2015;22(10):1630–1640. doi:10.1038/cdd.2015.6
17. Lee S, Schmitt CA. The dynamic nature of senescence in cancer. Nat Cell Biol. 2019;21(1):94–101. doi:10.1038/s41556-018-0249-2
18. Johnson SC, Rabinovitch PS, Kaeberlein M. mTOR is a key modulator of ageing and age-related disease. Nature. 2013;493(7432):338–345. doi:10.1038/nature11861
19. Galluzzi L, Vitale I, Aaronson SA, et al. Molecular mechanisms of cell death: recommendations of the nomenclature committee on cell death 2018. Cell Death Differ. 2018;25(3):486–541. doi:10.1038/s41418-017-0012-4
20. Yue T, Chen S, Zhu J, et al. The aging-related risk signature in colorectal cancer. Aging. 2021;13(5):7330–7349. doi:10.18632/aging.202589
21. Xu Q, Chen Y. An aging-related gene signature-based model for risk stratification and prognosis prediction in lung adenocarcinoma. Front Cell Dev Biol. 2021;9:685379. doi:10.3389/fcell.2021.685379
22. Srivastava S, Gopal-Srivastava R. Biomarkers in cancer screening: a public health perspective. J Nutr. 2002;132(8 Suppl):2471s–5s. doi:10.1093/jn/132.8.2471S
23. Tang Y, Hu Y, Wang J, Zeng Z. A novel risk score based on a combined signature of 10 immune system genes to predict bladder cancer prognosis. Int Immunopharmacol. 2020;87:106851. doi:10.1016/j.intimp.2020.106851
24. Newman AM, Liu CL, Green MR, et al. Robust enumeration of cell subsets from tissue expression profiles. Nat Methods. 2015;12(5):453–457. doi:10.1038/nmeth.3337
25. Li T, Fan J, Wang B, et al. TIMER: a web server for comprehensive analysis of tumor-infiltrating immune cells. Cancer Res. 2017;77(21):e108–e110. doi:10.1158/0008-5472.CAN-17-0307
26. Hothorn T, Zeileis A. Generalized maximally selected statistics. Biometrics. 2008;64(4):1263–1269. doi:10.1111/j.1541-0420.2008.00995.x
27. Xu H, Wang G, Zhu L, Liu H, Li B. Eight immune-related genes predict survival outcomes and immune characteristics in breast cancer. Aging. 2020;12(16):16491–16513. doi:10.18632/aging.103753
28. Baloni P, Dinalankara W, Earls JC, et al. Identifying personalized metabolic signatures in breast cancer. Metabolites. 2020;11(1):20. doi:10.3390/metabo11010020
29. Tan W, Liu M, Wang L, et al. Novel immune-related genes in the tumor microenvironment with prognostic value in breast cancer. BMC Cancer. 2021;21(1):126. doi:10.1186/s12885-021-07837-1
30. Zhu L, Tian Q, Jiang S, et al. A novel ferroptosis-related gene signature for Overall survival prediction in patients with breast cancer. Front Cell Dev Biol. 2021;9:670184. doi:10.3389/fcell.2021.670184
31. Wang D, Wei G, Ma J, et al. Identification of the prognostic value of ferroptosis-related gene signature in breast cancer patients. BMC Cancer. 2021;21(1):645. doi:10.1186/s12885-021-08341-2
32. Du JX, Chen C, Luo YH, et al. Establishment and validation of a novel autophagy-related gene signature for patients with breast cancer. Gene. 2020;762:144974. doi:10.1016/j.gene.2020.144974
33. Eberhardt K, Beleites C, Marthandan S, Matthäus C, Diekmann S, Popp J. Raman and infrared spectroscopy distinguishing replicative senescent from proliferating primary human fibroblast cells by detecting spectral differences mainly due to biomolecular alterations. Anal Chem. 2017;89(5):2937–2947. doi:10.1021/acs.analchem.6b04264
34. Cheng X, Geng F, Pan M, et al. Targeting DGAT1 ameliorates glioblastoma by increasing fat catabolism and oxidative stress. Cell Metab. 2020;32(2):229–42.e8. doi:10.1016/j.cmet.2020.06.002
35. Xia L, Wang Y, Cai S, Xu M. DGAT1 expression promotes ovarian cancer progression and is associated with poor prognosis. J Immunol Res. 2021;2021:6636791. doi:10.1155/2021/6636791
36. He P, Cheng S, Hu F, Ma Z, Xia Y. Up-regulation of DGAT1 in cancer tissues and tumor-infiltrating macrophages influenced survival of patients with gastric cancer. BMC Cancer. 2021;21(1):252. doi:10.1186/s12885-021-07976-5
37. Wilson MR, Zoubeidi A. Clusterin as a therapeutic target. Expert Opin Ther Targets. 2017;21(2):201–213. doi:10.1080/14728222.2017.1267142
38. Tian Y, Wang C, Chen S, Liu J, Fu Y, Luo Y. Extracellular Hsp90α and clusterin synergistically promote breast cancer epithelial-to-mesenchymal transition and metastasis via LRP1. J Cell Sci. 2019;132(15). doi:10.1242/jcs.228213
39. Wang Y, Brodsky AS, Xiong J, Lopresti ML, Yang D, Resnick MB. Stromal clusterin expression predicts therapeutic response to neoadjuvant chemotherapy in triple negative breast cancer. Clin Breast Cancer. 2018;18(3):e373–e379. doi:10.1016/j.clbc.2017.08.00
40. Cascón A, Robledo M. MAX and MYC: a heritable breakup. Cancer Res. 2012;72(13):3119–3124. doi:10.1158/0008-5472.CAN-11-3891
41. Zhang D, Zheng Y, Yang S, et al. Identification of a novel glycolysis-related gene signature for predicting breast cancer survival. Front Oncol. 2020;10:596087. doi:10.3389/fonc.2020.596087
42. Verret B, Cortes J, Bachelot T, Andre F, Arnedos M. Efficacy of PI3K inhibitors in advanced breast cancer. Ann Oncol. 2019;30(Suppl 10):x12–x20. doi:10.1093/annonc/mdz381
43. Narayan P, Prowell TM, Gao JJ, et al. FDA approval summary: alpelisib plus fulvestrant for patients with HR-positive, HER2-negative, PIK3CA-mutated, advanced or metastatic breast cancer. Clin Cancer Res. 2021;27(7):1842–1849. doi:10.1158/1078-0432.CCR-20-3652
44. Wang Y, Zhu M, Li J, et al. Overexpression of PSMC2 promotes the tumorigenesis and development of human breast cancer via regulating plasminogen activator urokinase (PLAU). Cell Death Dis. 2021;12(7):690. doi:10.1038/s41419-021-03960-w
45. Derenzini E, Mazzara S, Melle F, et al. A 3-gene signature based on MYC, BCL-2 and NFKBIA improves risk stratification in diffuse large B-cell lymphoma. Haematologica. 2020;106(9). doi:10.3324/haematol.2019.236455
46. Li L, Zhang ZT. Genetic association between NFKBIA and NFKB1 gene polymorphisms and the susceptibility to head and neck cancer: a meta-analysis. Dis Markers. 2019;2019:6523837. doi:10.1155/2019/6523837
47. Curran JE, Weinstein SR, Griffiths LR. Polymorphic variants of NFKB1 and its inhibitory protein NFKBIA, and their involvement in sporadic breast cancer. Cancer Lett. 2002;188(1–2):103–107. doi:10.1016/s0304-3835(02)00460-3
48. Sebestyen Z, Prinz I, Déchanet-Merville J, Silva-Santos B, Kuball J. Translating gammadelta (γδ) T cells and their receptors into cancer cell therapies. Nat Rev Drug Discov. 2020;19(3):169–184. doi:10.1038/s41573-019-0038-z
 © 2021 The Author(s). This work is published and licensed by Dove Medical Press Limited. The
full terms of this license are available at https://www.dovepress.com/terms
and incorporate the Creative Commons Attribution
- Non Commercial (unported, 3.0) License.
By accessing the work you hereby accept the Terms. Non-commercial uses of the work are permitted
without any further permission from Dove Medical Press Limited, provided the work is properly
attributed. For permission for commercial use of this work, please see paragraphs 4.2 and 5 of our Terms.
© 2021 The Author(s). This work is published and licensed by Dove Medical Press Limited. The
full terms of this license are available at https://www.dovepress.com/terms
and incorporate the Creative Commons Attribution
- Non Commercial (unported, 3.0) License.
By accessing the work you hereby accept the Terms. Non-commercial uses of the work are permitted
without any further permission from Dove Medical Press Limited, provided the work is properly
attributed. For permission for commercial use of this work, please see paragraphs 4.2 and 5 of our Terms.