Back to Journals » Infection and Drug Resistance » Volume 13
An Advanced Data-Driven Hybrid Model of SARIMA-NNNAR for Tuberculosis Incidence Time Series Forecasting in Qinghai Province, China
Authors Wang Y ![]() , Xu C, Li Y, Wu W
, Xu C, Li Y, Wu W ![]() , Gui L, Ren J, Yao S
, Gui L, Ren J, Yao S
Received 29 September 2019
Accepted for publication 22 February 2020
Published 24 March 2020 Volume 2020:13 Pages 867—880
DOI https://doi.org/10.2147/IDR.S232854
Checked for plagiarism Yes
Review by Single anonymous peer review
Peer reviewer comments 3
Editor who approved publication: Dr Sahil Khanna
Yongbin Wang,1,* Chunjie Xu,2,* Yuchun Li,1 Weidong Wu,1 Lihui Gui,1 Jingchao Ren,1 Sanqiao Yao1
1Department of Epidemiology and Health Statistics, School of Public Health, Xinxiang Medical University, Xinxiang, Henan, People’s Republic of China; 2Department of Occupational and Environmental Health, School of Public Health, Capital Medical University, Beijing, People’s Republic of China
*These authors contributed equally to this work
Correspondence: Sanqiao Yao; Yongbin Wang
Department of Epidemiology and Health Statistics, School of Public Health, Xinxiang Medical University, Xinxiang, Henan 453000, People’s Republic of China
Tel +86 373831646
Email [email protected]; [email protected]
Purpose: Qinghai province has invariably been under an ongoing threat of tuberculosis (TB), which has not only been an obstacle to local development but also hampers the prevention and control process for ending the TB epidemic. Forecasting for future epidemics will serve as the base for early detection and planning resource requirements. Here, we aim to develop an advanced detection technique driven by the recent TB incidence series, by fusing a seasonal autoregressive integrated moving average (SARIMA) with a neural network nonlinear autoregression (NNNAR).
Methods: We collected the TB incidence data between January 2004 and December 2016. Subsequently, the subsamples from January 2004 to December 2015 were employed to measure the efficiency of the single SARIMA, NNNAR, and hybrid SARIMA-NNNAR approaches, whereas the hold-out subsamples were used to test their predictive performances. We finally selected the best-performing technique by considering minimum metrics including the mean absolute error, root-mean-squared error, mean absolute percentage error and mean error rate .
Results: During 2004– 2016, the reported TB cases totaled 71,080 resulting in the morbidity of 97.624 per 100,000 persons annually in Qinghai province and showed notable peak activities in late winter and early spring. Moreover, the TB incidence rate was surging by 5% per year. According to the above-mentioned criteria, the best-fitting basic and hybrid techniques consisted of SARIMA(2,0,2)(1,1,0)12, NNNAR(7,1,4)12 and SARIMA(2,0,2)(1,1,0)12-NNNAR(3,1,7)12, respectively. Amongst them, the hybrid technique showed superiority in both mimic and predictive parts, with the lowest values of the measured metrics in both the parts. The sensitivity analysis indicated the same results.
Conclusion: The best-mimicking SARIMA-NNNAR hybrid model outperforms the best-simulating basic SARIMA and NNNAR models, and has a potential application in forecasting and assessing the TB epidemic trends in Qinghai. Furthermore, faced with the major challenge of the ongoing upsurge in TB incidence in Qinghai, there is an urgent need for formulating specific preventive and control measures.
Keywords: tuberculosis, SARIMA model, NNNAR model, hybrid model, forecasting, incidence rate
Introduction
Tuberculosis (TB) is a highly infectious disease caused by the Mycobacterium tuberculosis infection and still imposes a heavy burden on the world with estimated cases of 10.0 million people and 1.6 million deaths in 2017, though great efforts toward ending the TB epidemic have been made worldwide, with an approximately 2% reduction in the TB morbidity rate per year.1,2 Furthermore, because of TB, individuals encounter costs or suffer a loss of as much as 50% of their income.3 According to the most recent WHO report, nearly 87% new infections occurred in 30 high TB burden countries, among which, China has the second highest TB burden, and also ranks the second for drug-resistant TB, despite a 3% decline of the TB incidence rate annually since 2005.1 In recent years, owing to the growing transient population, drug-resistant TB, co-infections of HIV-TB and other TB co-morbidities such as diabetes mellitus, hypertension, and immune-compromising disorders, etc., which have caused a continued public health challenge for goal of ending TB with milestones by 2020 and 2025 and targets by 2030 and 2035 in China.2,3 A key aspect of reaching the WHO’s goals for China is to better prevent and control the TB spread in high-risk areas, such as in Qinghai province, where the TB morbidity rate was constantly leading the list of 39 notifiable infectious diseases and was more than double the average level in 2018 in China (140.00 per 100,000 persons versus 59.01 per 100,000 people),4,5 and more importantly, in contrast to the general downward trend in China, displays an upward tendency.4,6 Hence, more prevention and control strategies should be implemented in this high-risk area of TB, which is also great significance in facilitating and promoting the achievement of ending the TB epidemic in China. Among all strategies, the accurate projection for upcoming temporal patterns with advanced statistical models is basic to any implementation of prevention and control measures.
In recent decades, coinciding with increasingly rapid advances in the technology of computers, the use of statistical techniques for modelling and forecasting has become widespread. Of these statistical techniques, the autoregressive integrated moving average (ARIMA) method based on an assumption of linearity is currently the most extensively applied to analyze and evaluate the morbidity or mortality time series of contagious diseases, such as TB,7 scarlet fever,8 human brucellosis,9 pertussis,10 etc. Yet the incidence series of contagious diseases over time includes not only linearity but also nonlinearity due to their secular trend, cyclic pattern, seasonality and stochastic fluctuation, and therefore may result in a limited ability to extract the nonlinear clues using the ARIMA model.11 Therefore, to better capture the various components contained in the incidence series, the combined techniques of the ARIMA model and artificial neural networks (ANNs) capable of approximating arbitrary nonlinear and non-stationary sequences by virtue of their powerful non-linear mapping function have been gaining much attention, as they give sufficient consideration to both the linear and nonlinear information hidden behind a time series. Moreover, such a hybrid model has been confirmed to attain the desired and expected results in most epidemiological forecasting.11–13 However, on one hand, earlier literature mainly focused on hybrid models that comprise the ARIMA method and static ANNs such as back-propagation networks (BP)14 and generalized regression neural networks (GRNN),11 etc., while much work has shown that the dynamic ANNs, such as Jordan, Elman and neural network nonlinear autoregression (NNNAR) models can improve the performance compared with the static ANNs, owing to their short-term memory function.9 On the other hand, for time series with noticeable seasonality, it is fairly useful to treat the last sample points from the same period as inputs as well.15 In this regard, the NNNAR technique is successful where previous commonly employed models failed. Thereby, given the superiority of the NNNAR method and the challenge posed by an upsurge in TB for public health in Qinghai province, we aim to develop an ARIMA-NNNAR hybrid method for fitting and projecting TB epidemic trends. Whilst used for validating the suitability of the application, the basic ARIMA and NNNAR models were also constructed to model the data, and subsequently, their mimic and predictive powers were compared with the data-driven SARIMA-NNNAR hybrid method.
Materials and Methods
Study Area and Data Collection
Qinghai province is located at 89°35′~103°04′ east longitude and 31°36′~39°19′ north latitude in the northwest of mainland China and covers an area of about 722.300 km2, and as of the end of 2018, the number of permanent residents amounted to 6.0323 million. In this time series analysis, 156 observed values of the monthly and yearly TB incidents from January 2004 to December 2016 were extracted from the data-center of the China public health science (http://www.phsciencedata.cn/Share/en/index.jsp) and the population data came from the Qinghai Provincial Bureau of Statistics. Thereafter, the datasets from January 2004 to December 2015 were deemed as the model-training subsamples, whereas the rest were regarded as the model-testing subsamples. In this study, any ethical approval or informed consent was considered unnecessary because all the observed values used for the analyses were obtained from publicly accessible surveillance data sources, and no detailed personal information were needed.
Building SARIMA Method
The classical ARIMA(p, d, q) model has been identified as an effective and useful forecasting tool for time series with an absence of seasonality.16 Nonetheless, given the fact that the incidence series of infectious diseases exhibitscyclical or periodic behavior, a seasonal ARIMA method, also known as SARIMA(p, d, q)(P, D, Q)s, was considered as this technique can unearth associations in sequentially lagged relationships which frequently exist in a series with cyclicity and seasonality.17 In the SARIMA model, the projections can be viewed as a linear function of recently observed points and produced residuals, and the corresponding formula is
(1)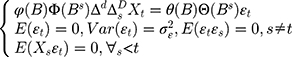
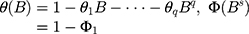
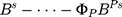
Here B signifies the backshift operator, ɛt is the errors of prediction, S denotes the periodicity of the observed series, d and D represent the non-seasonal and seasonal differencing, respectively. p, q, P and Q are the orders of non-seasonal and seasonal autoregressive (AR and SAR, respectively) and moving average (MA and SMA, respectively) approaches, respectively.  ,
,
 ,
, 
 ,
,  .
.
The SARIMA modelling procedures used are given below. Initially, the stationarity of the TB incidence series was examined.7 The SARIMA approach is designed to model series with stationarity. Thereby the augmented Dickey–Fuller (ADF) test was employed to verify the assumption of stationarity in the TB morbidity series.7 With nonstationary TB series, log transformation or differencing was adopted to help accomplish stationarity. Then, model parameters were identified and the autocorrelation function (ACF) and partial ACF (PACF) plots to select the plausible parameters for the SARIMA approach were used.16 Next, the model fit was evaluated. Applying some information criteria (IC) like the Schwarz Bayesian IC (SBC), Akaike IC (AIC), corrected Akaike IC (AICc) and log-likelihood (LL) function to the chosen models, the SARIMA approach with the minimum SBC, AIC and AICc values as well as the maximum LL value was chosen as the optimal.11 Once the best-modelling approach was found, the produced residuals were identified as a white noise series with the ACFs and PACFs being within their uncertainty limits and with a significant result for all the parameters.16 Finally, forecasting was produced. A projection into the future was accomplished by employing the optimal model obtained.
Erecting NNNAR Method
The uncertainty and complex nonlinear patterns contained in the incidence series of infectious diseases are most frequently encountered in practical forecasting applications, which leads to a performance reduction when using linear approaches.6 In order to offset such a defect, ANNs are attracting considerable interest in handling such a series thanks to their powerful self-organizing and self-learning capabilities, which give it the flexibility to approach any expected accuracy.14 Dynamic ANNs techniques, unlike static methods, include feedback links that help better capture time-varying effects.16 NNNAR, one of the dynamic ANNs, can store not only the current and past values of the inputs and outputs but also the states of the network by using tapped delay lines.18 Also, this network can employ the last sample points from the previous season as predictors for forecasting.18 A simple NNNAR(p, k) network can be written as (Figure S1)
(2)
Here, y(t) denotes the simulations and projections obtained by using the earlier inputs at lags p, f represents a nonlinear function with k hidden neurons.
Further, with the seasonal time series, an extension of the basic NNNAR(p, k) network can be in the form of NNNAR(p, P, k)m
(3)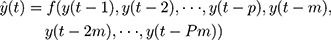
Here y(t) represents the simulations and projections produced by applying the last P sample points from the same m season besides the earlier inputs at lags p.
In earlier publications, it was demonstrated that it can attain a satisfactory result and can attenuate overfitting to a great extent when the ANNs with 2–7 lagged inputs and 2–20 nodes in the hidden layer were used to conduct forecasting.7,18-21 Thus, in this study, to identify the best-predicting NNNAR network, we adopted a strategy of repeated attempts to seek the suitable number of the lagged inputs and the hidden neurons in the ranges mentioned above. Among all the possible methods, NARNN network that has the lowest mean absolute percentage error (MAPE) and root-mean-square error (RMSE) values between the outputs and targets and reveals uncorrelated sample ACFs and PACFs in the residuals without leading to obvious overfitting, is the best fitting.
Establishing SARIMA-NNNAR Hybrid Model
As mentioned before, the SARIMA approach has favorable qualities for mining linear information, while the NNNAR network shows powerful potentials for extracting nonlinear information.18 Thus, inspired by their individual merits, the SARIMA-NNNAR hybrid model was thus built. A flow chart is presented in Figure S2. As shown, in this combined approach, the SARIMA method was applied to the TB incidence series for unearthing the linear clues. After that, the NNNAR approach was established to investigate the residuals determined by the SARIMA method. The best predictive results were obtained by adding them together. As such, this data-driven hybrid approach is able to capture both the linear and nonlinear components which are included in the TB morbidity series.
Predictive Performance Measures
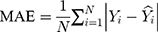
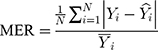
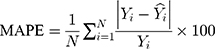
The modelling and forecasting performances were judged by comparing the values of two types of measures including the scale-dependent such as mean absolute error (MAE) and root mean squared error (RMSE), and the percentage errors such as mean absolute percentage error (MAPE) and mean error rate (MER). Of them, the one with the lowest values was viewed as the preferred approach.
(4) (5) (6) (7)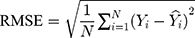
Here  is the actual values,
  denotes the simulating and forecasting values from the SARIMA, NNNAR and their hybrid techniques,
  signifies the average value of
  .
.
Statistical Analysis
Multiple statistical packages including “fUnitRoots,” “fracdiff,” “forecast,” “tseries,” “FinTS,” “zoo,” “nnet” and “neuralnet” of R (version 3.4.3, R Development Core Team, Vienna, Austria) were employed to establish the SARIMA, NNNAR and SARIMA-NNNAR models. Also, a sensitivity analysis was further performed to authenticate the models’ uncertainty with the datasets between January 2004 and July 2016 for the models’ development, while the remaining data were used for the models’ validation. Additionally, the Lagrangian multiplier (LM) test was used to examine autoregressive conditional heteroscedastic (ARCH) effects in the observed data and errors.22,23 A two-sided P value of less than 0.05 was regarded statistically significant.
Results
Descriptive Analysis
Over the study span, the reported cases totaled 71,080, with an annual of 5468 cases, and this gave rise to a morbidity rate of 97.624 per 100,000 persons annually. During the period from 2004 to 2016, Qinghai witnessed a dramatically increased trend in the TB incidence rate with an annual average increase of about 5% (Figures 1A and B). In 2016, the incidence rate was 128.698 per 100,000 persons; there was a rise of 77.380%, compared with 2004 when it was only 52.555 per 100,000 persons. Besides, the multiplicative seasonal decomposition for the TB incidence series displayed a notable seasonal pattern that was repeated every 12 months with peak activities in January until July, particularly in January and March, and a trough in August until December, especially in December (Figures 1C and D).
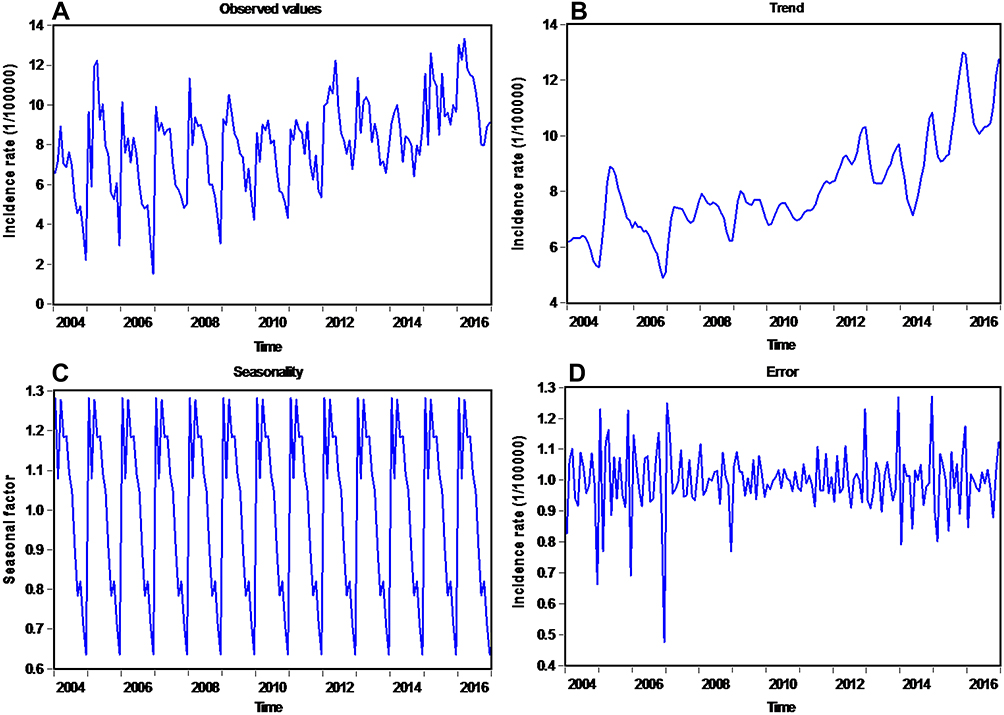 |
Figure 1 Morbidity rate of TB and decomposed trend, seasonality and random pattern with the multiplicative seasonal decomposition technique during January 2004 to December 2016 in Qinghai Province. (A) Time plot for the TB morbidity rate series; (B) Trend pattern for the TB morbidity rate series; (C) Seasonal pattern for the TB morbidity rate series; (D) Error component for the TB morbidity rate series. |
Results from the SARIMA Model
Considering that there was a unit root (ADF=0.840, P=0.346) and notable seasonal behavior in the TB morbidity series (Figure S3). As a result, the target data were seasonally differenced once to smooth the rapid seasonal fluctuation prior to modelling, a significant result (ADF=−4.536, P<0.001) meant stationary (Figure S4). Then, by comparing the ACF and PACF graphs plotted with this differenced series, some seemingly plausible models were determined. However, the parameters were too simple to effectively capture the serial characteristics of some datasets. Thus, six possible models were further developed in our experiments. Among them, further tests indicated the SARIMA(2,0,2)(1,1,0)12 model, as it had the parameter values that minimized the information criteria with AIC=410.24, AICc=411.14 and SBC=430.42, and maximized the function criterion with LL=−198.12 (Table 1). Next, further verifying for the coefficients and residual series produced by this preferred model, it was determined that all the estimated coefficients for the SARIMA(2,0,2)(1,1,0)12 model were significant and the residual series without correlated sample ACFs and PACFs showed white noise (Tables 2 and 3 and Figure 2). Moreover, none of the volatility behaviors were found in the residuals using the LM tests (Table 4). These diagnostic statistics confirmed that the preferred SARIMA method was valid and adequate for modelling the TB incidence series. Therefore, this model was ultimately used to produce out-of-data forecasting (Table 5).
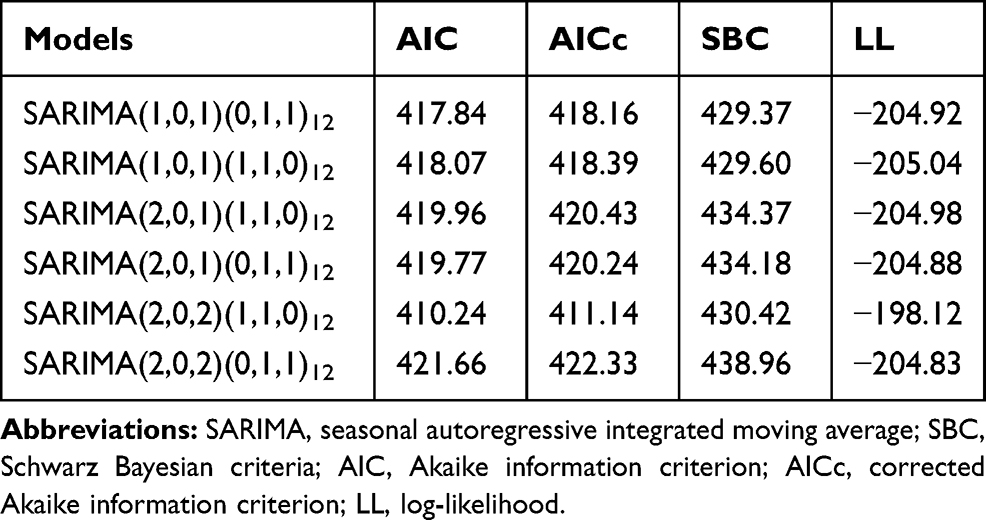 |
Table 1 Information Criteria Values of the Six Candidate SARIMA Models |
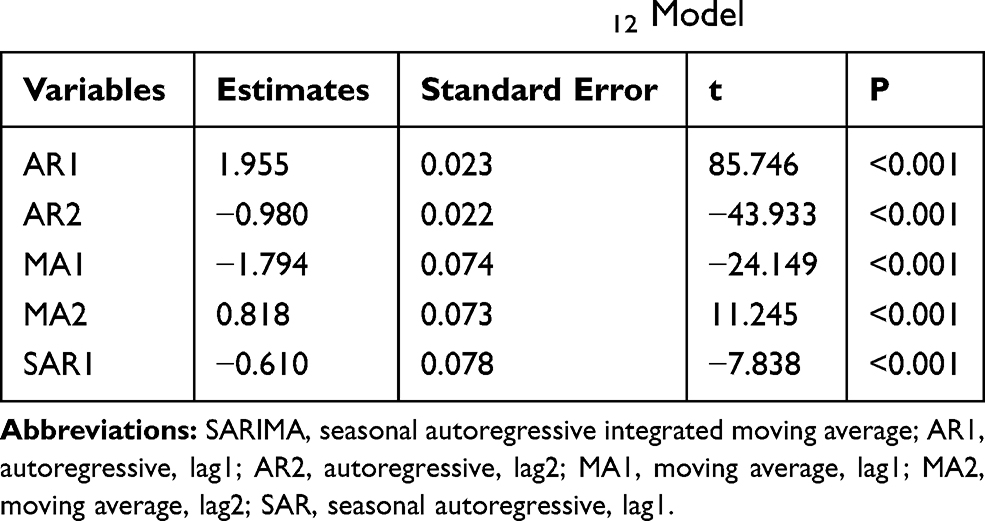 |
Table 2 Resulting Parameter Estimates and Their Statistical Tests of the Best-Fitting SARIMA(2,0,2)(1,1,0)12 Model |
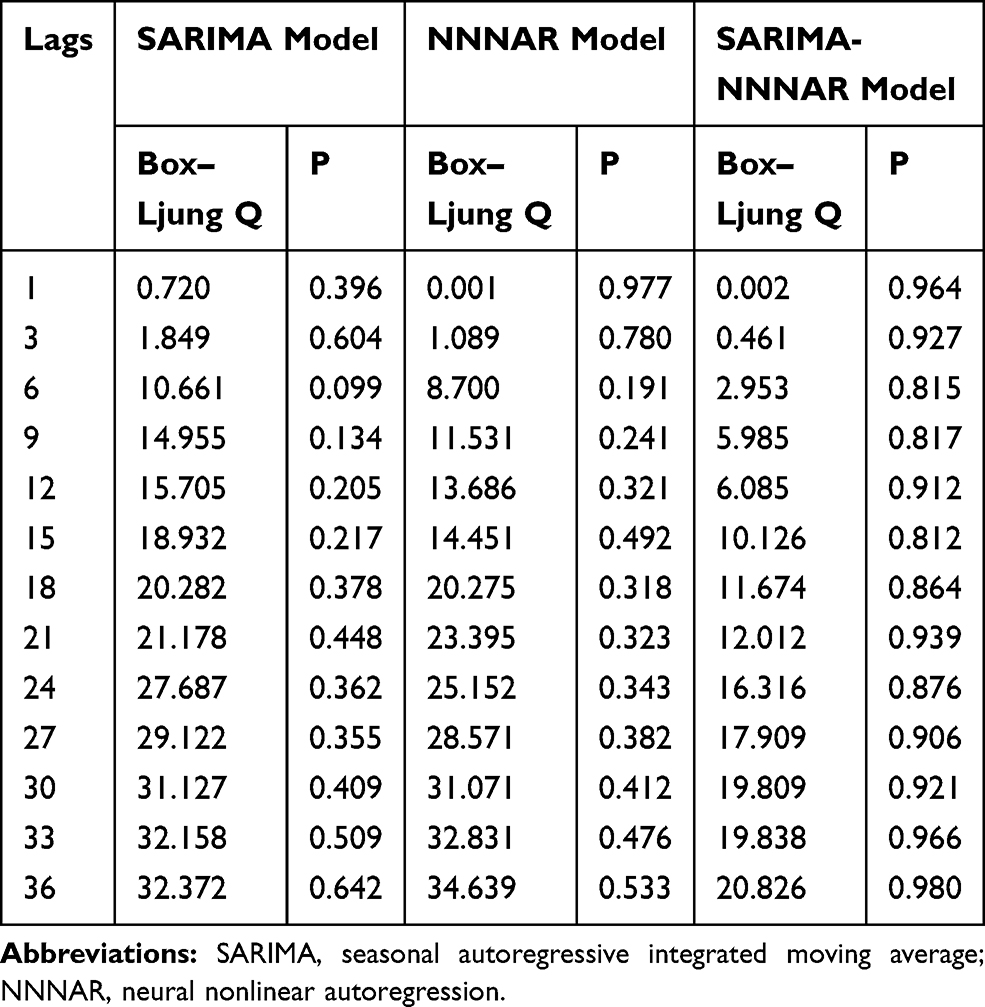 |
Table 3 Ljung–Box Q Statistics for the Residual Series Yielded by the Best-Performing Three Techniques at Various Lags |
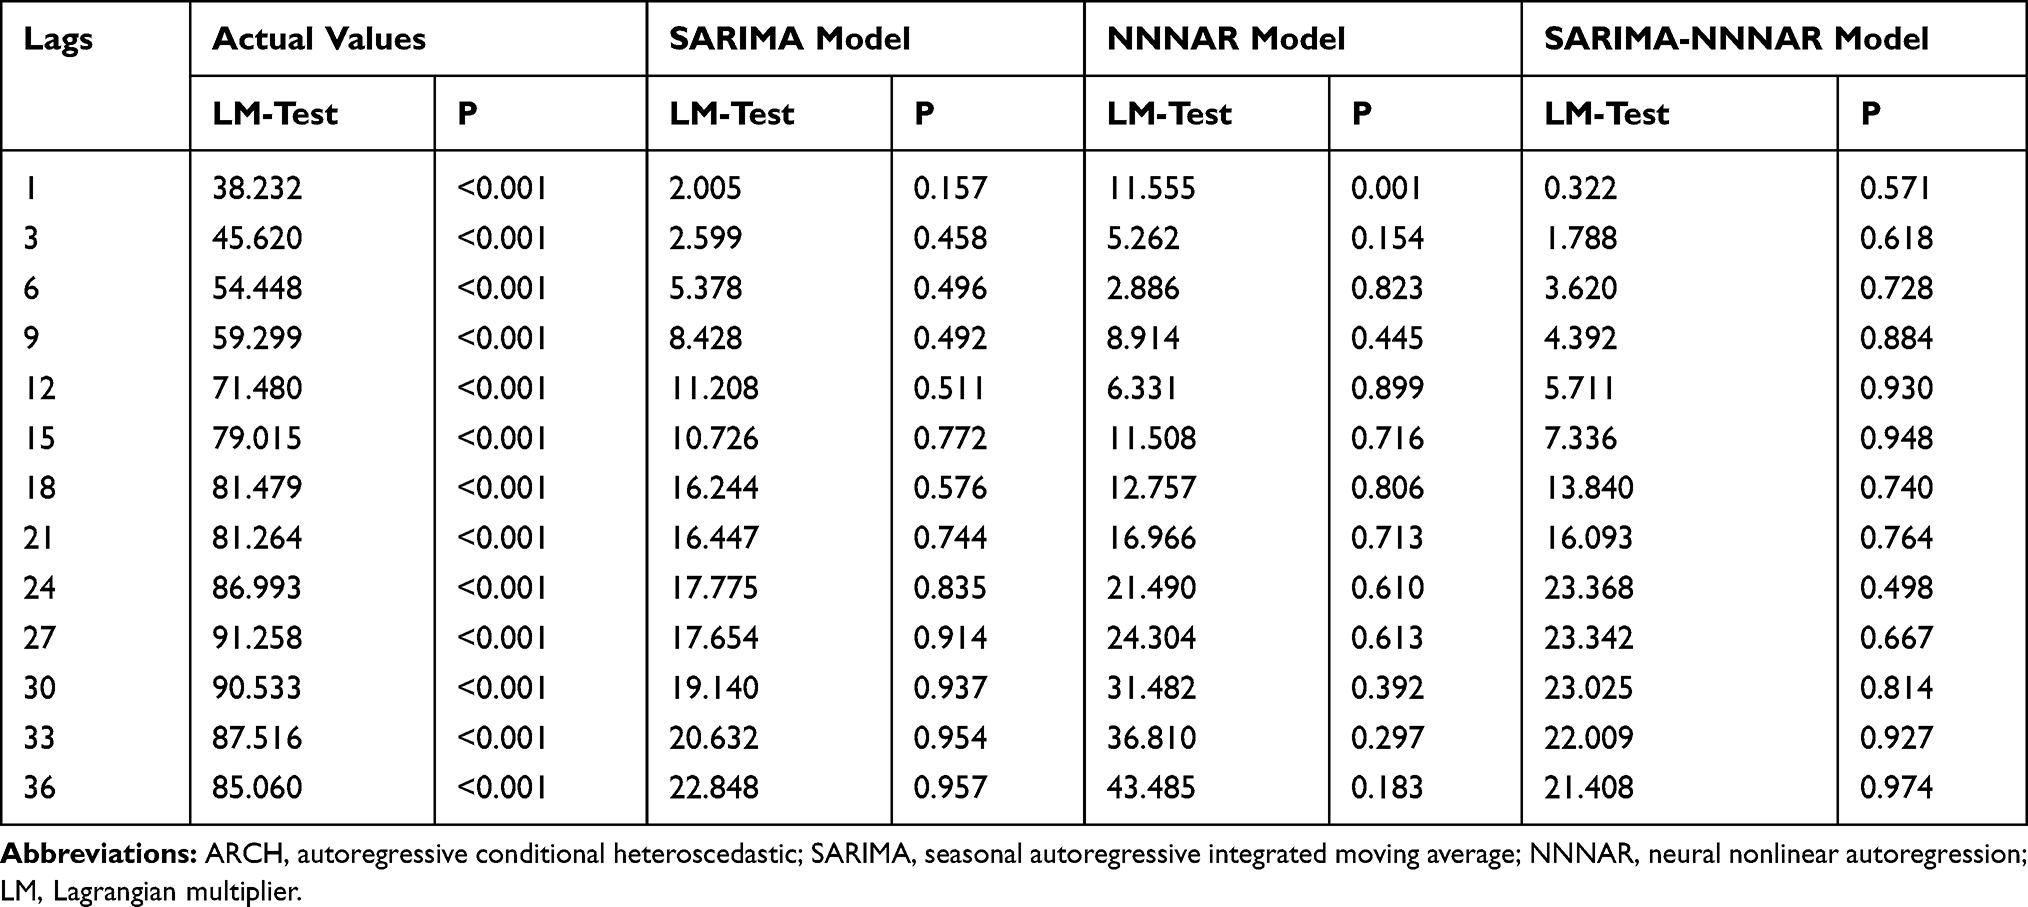 |
Table 4 ARCH Effects for the Actual TB Incidence Rate and Residual Series Yielded by the Best-Performing Three Techniques at Various Lags |
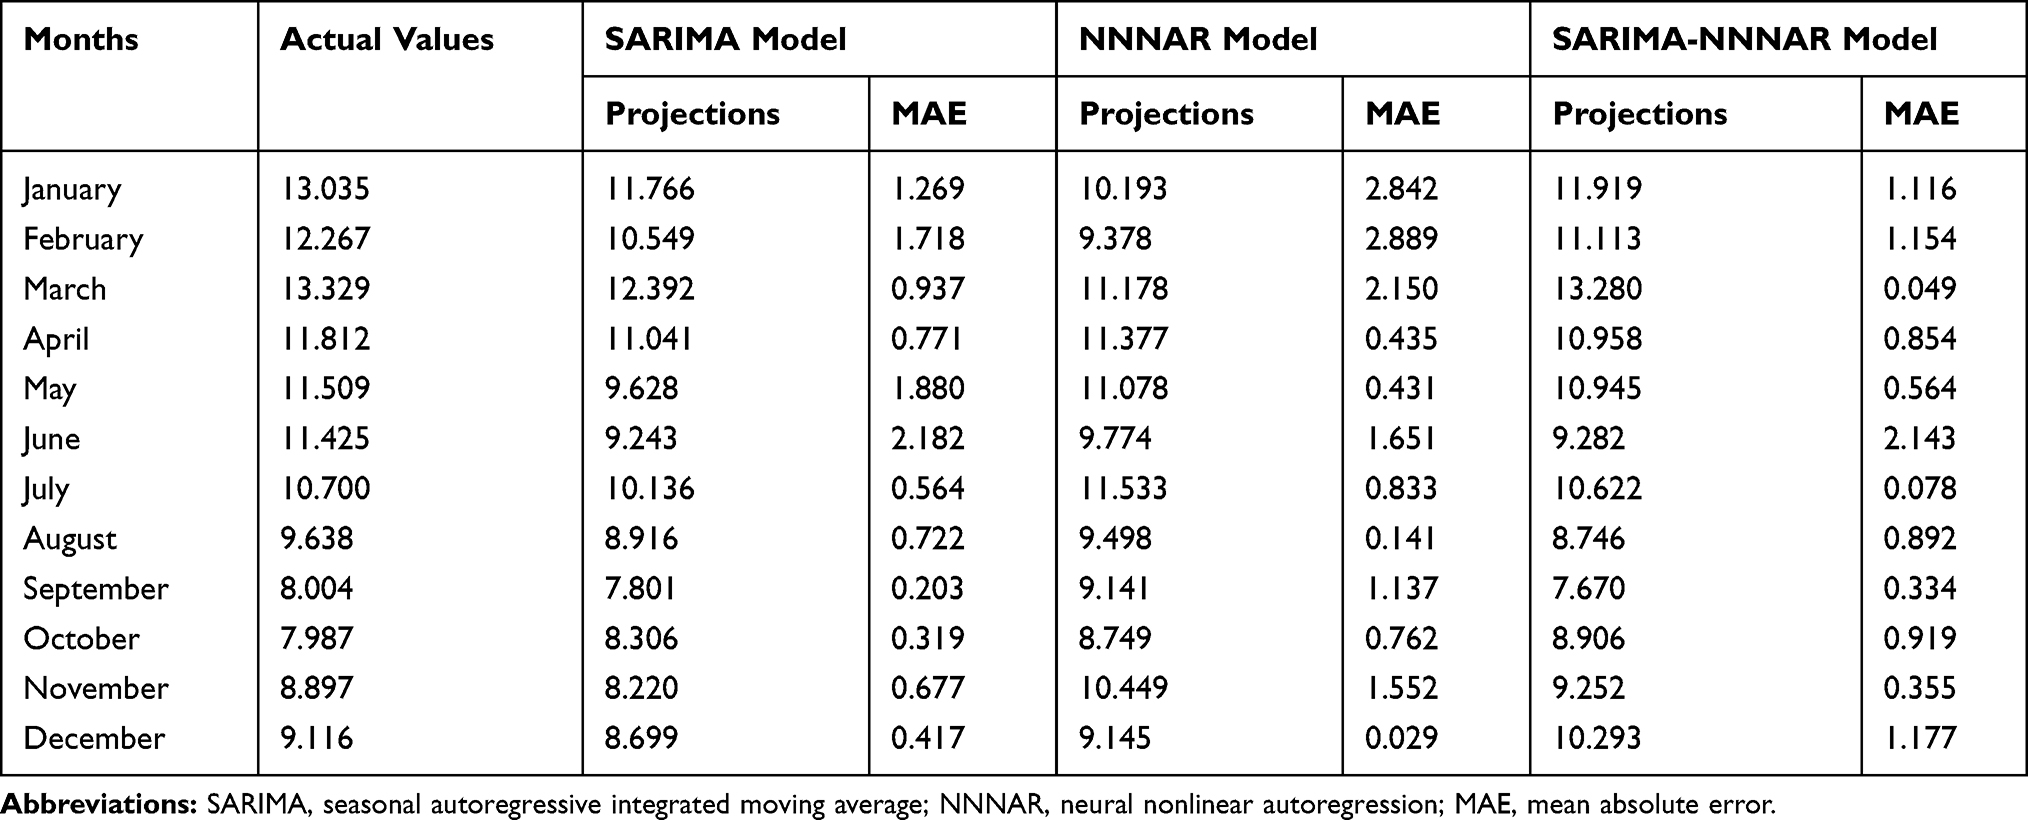 |
Table 5 Forecasts Between January 2016 and December 2016 Achieved by Adopting the Best-Fitting Three Techniques |
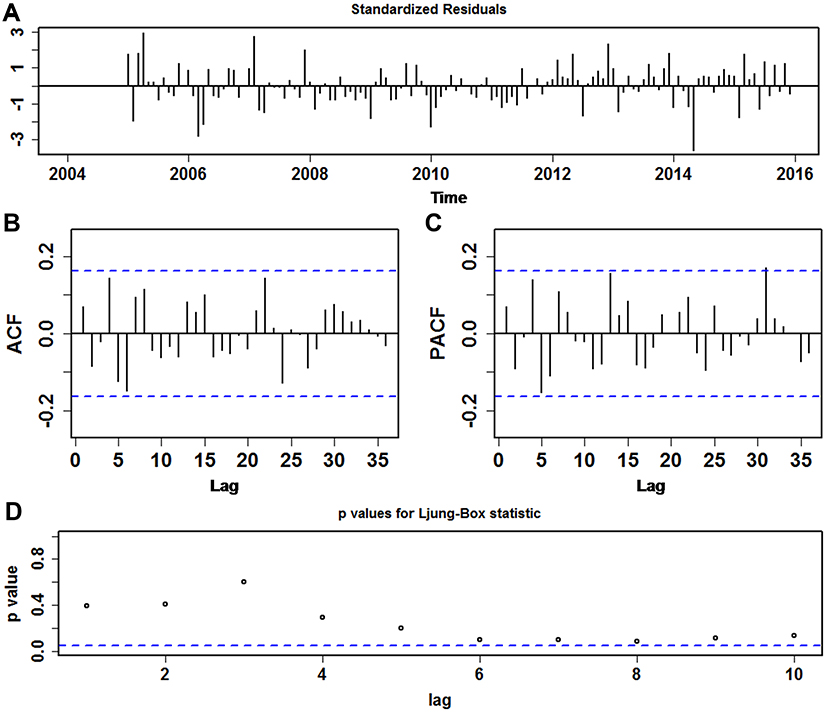 |
Figure 2 Test statistics for the residual series of TB incidence rate from the SARIMA(2,0,2)(1,1,0)12 model. (A) Standardized residual series; (B) Autocorrelogram (ACF) for the residual series; (C) Partial autocorrelogram (PACF) for the residual series; (D) P values for Ljung–Box statistic. It was seen that none of correlation coefficients except that at lag 31 in the PACF graph exceeded the estimated 95% confidence intervals. For this point at lag 31, it is reasonable as the higher lag is easily outside the limits by chance. All these above intimated that the identified SARIMA technique seems adequate and applicable in describing the dynamic dependence of the data. |
Results from the NNNAR Model
In order to identify the optimum parameters for the NNNAR network, we trained the NNNAR network with the lagged inputs and hidden nodes ranging from 2–7 to 2–20, respectively, by trial and error, and for each network structure, we compared the in-data mimic and out-of-data predictive performances between the outputs and targets. Finally, we selected an optimal NNNAR network with p=7, P=1, k=4 and m=12, as these were the parameters that minimized the MAPE and RMSE values in the in-data simulations (0.068 and 0.625, respectively) and achieved the best results for the out-of-data forecasts (0.112 and 1.558, respectively) compared with other candidate models (Table 6). Although these measures over the training samples were less than half those of the testing samples, given that this model performed 12-step ahead forecasts, thus there was no substantial overprediction. Further diagnostic statistics of the errors offered a test and verification that this NNNAR(7,1,4)12 network fitted the TB incidence data with sufficient suitability and validity as there were not dependent sample ACFs and PACFs and no statistical significance at the 5% level for the residual series in the Ljung–Box and LM statistics except for the one at lag 1 in the LM test (Tables 3 and 4 and Figure 3). Accordingly, this NNNAR network was determined to be the best for proceeding to forecasting as the next step (Table 5).
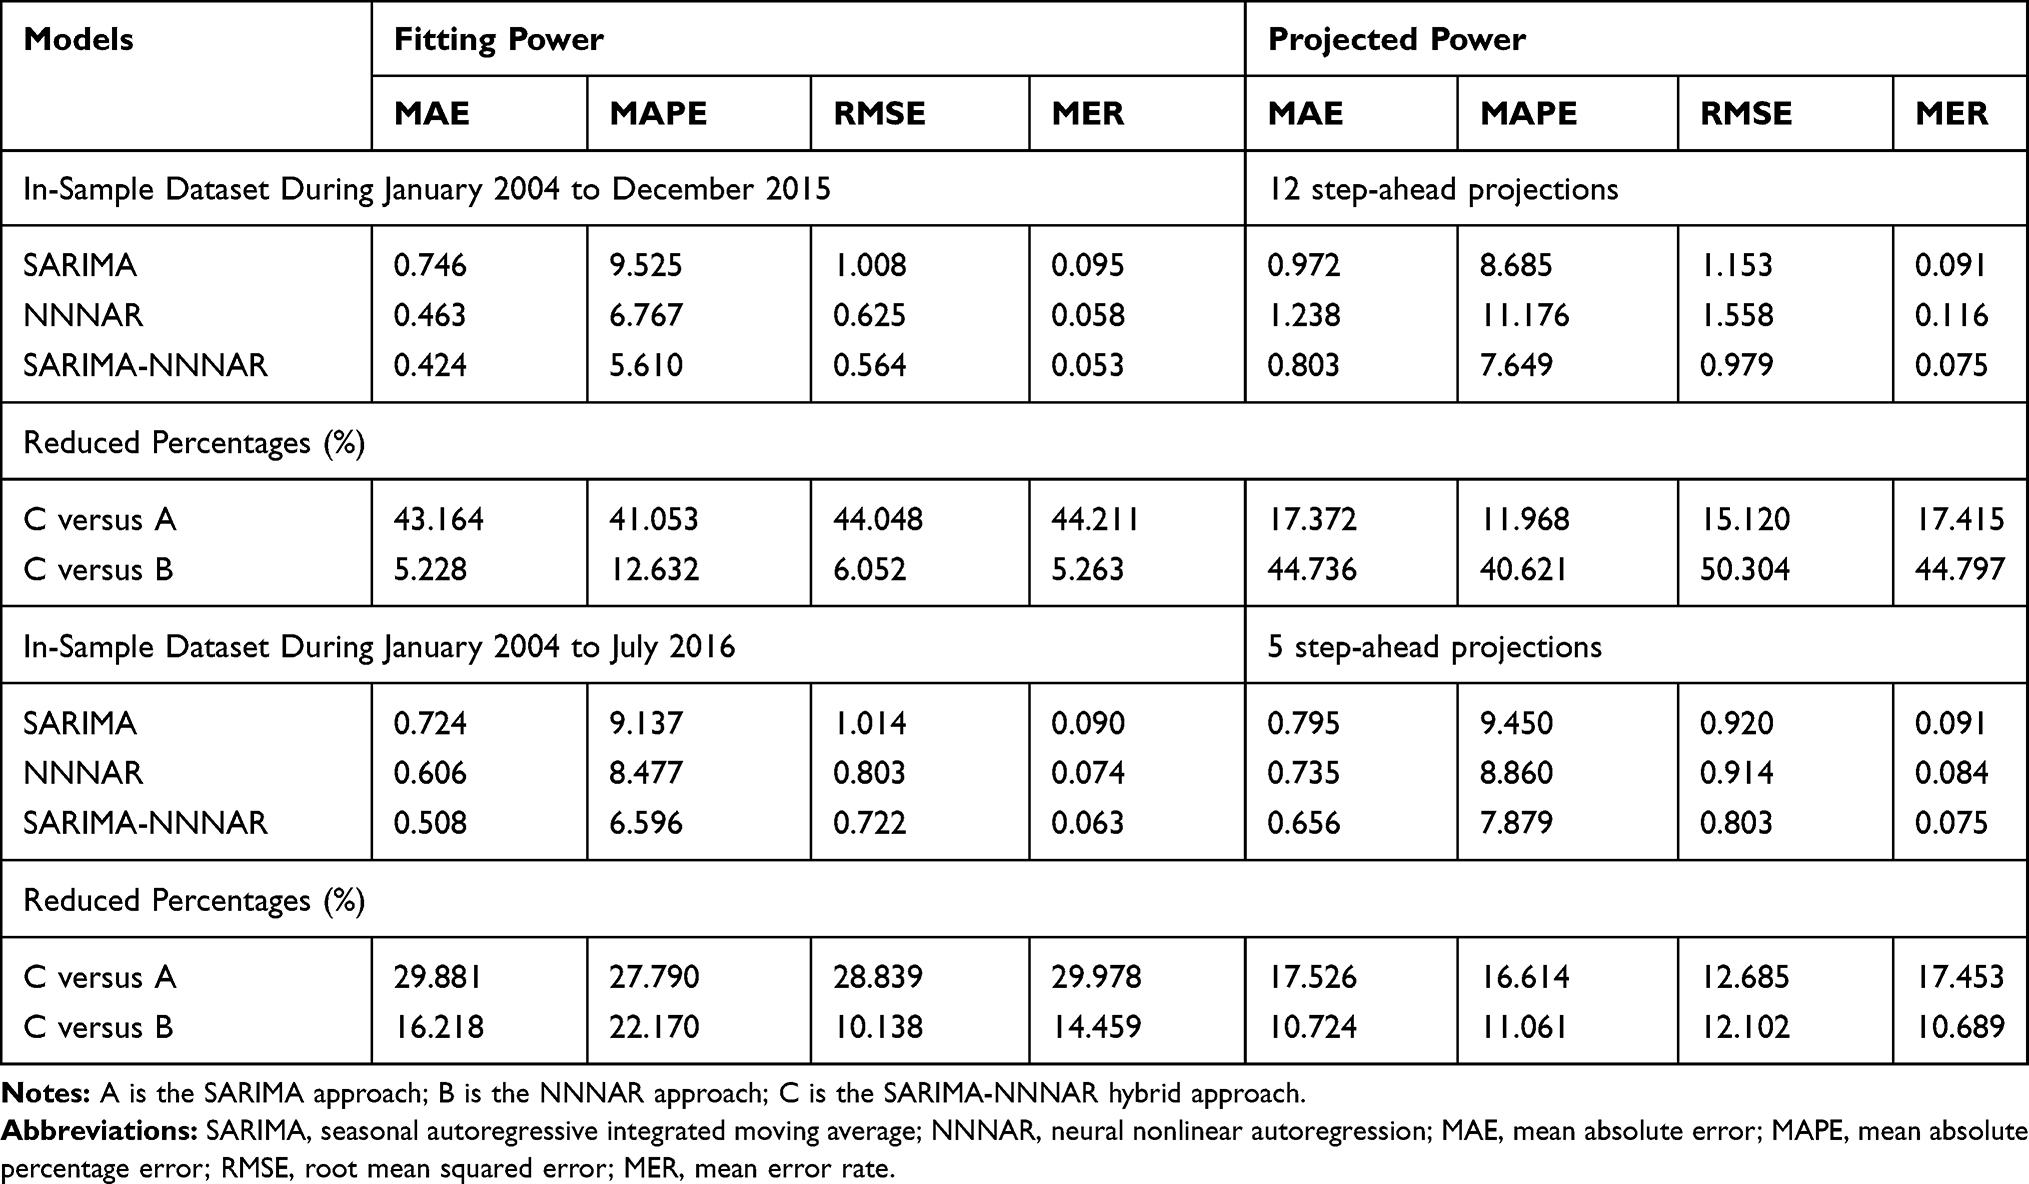 |
Table 6 Comparisons of the Mimic and Predictive Performance Measures Among the Best-Performing Three Models |
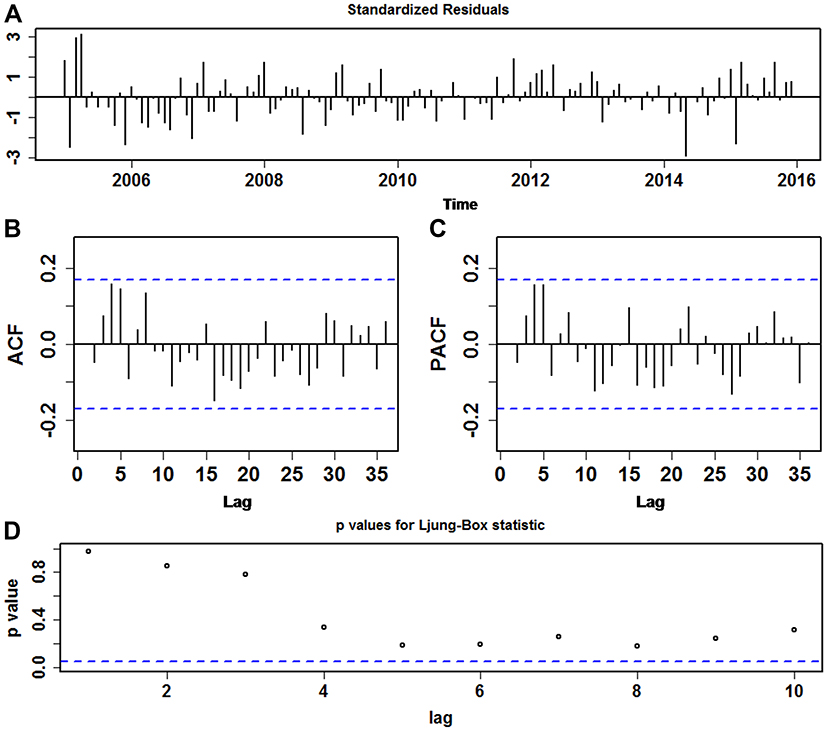 |
Figure 3 Diagnostic tests for the residual series of TB morbidity rate from the NNNAR(7,1,4)12 technique. (A) Standardized residual series; (B) Autocorrelation function (ACF) plot for the residual series; (C) Partial autocorrelation function (PACF) plot for the residual series; (D) Q-statistic P-values. As seen, the sample ACF and PACF of residuals revealed no significant serial correlations suggesting that the chosen NNNAR method is suitable for capturing the serial dependence of the data. |
Results from the SARIMA-NNNAR Hybrid Model
In this combined technique, the residual series determined from the basic SARIMA approach was treated as a univariate time series. Subsequently, following the basic NNNAR modelling procedure, a series of experiments were undertaken to help find one that minimized the mimic and forecasting criteria. After performing a search over a wide array of networks, an NNNAR(3,1,7)12 network was suggested because when fused with the basic SARIMA method, it accomplished the lowest values of MAPE of 5.610 and 7.649, respectively, and RMSE of 0.564 and 0.979, respectively, in both the mimic and predictive stages. This model also performed similarly for both subsamples (Table 6); hence, there is likely no overfitting. Also, the sample ACFs and PACFs for the residual series remained very small and were all within their two standard error bounds (Figure 4), and the Ljung–Box and LM tests exhibited P values greater than 0.05 (Tables 3 and 4). Based on the aforementioned results for the errors, we believe that the SARIMA-NNNAR hybrid approach selected is the best-fitting and is appropriate for extracting the dynamic information contained in the TB incidence series. At this time, this hybrid approach can be applied to forecast future TB epidemic patterns (Table 5).
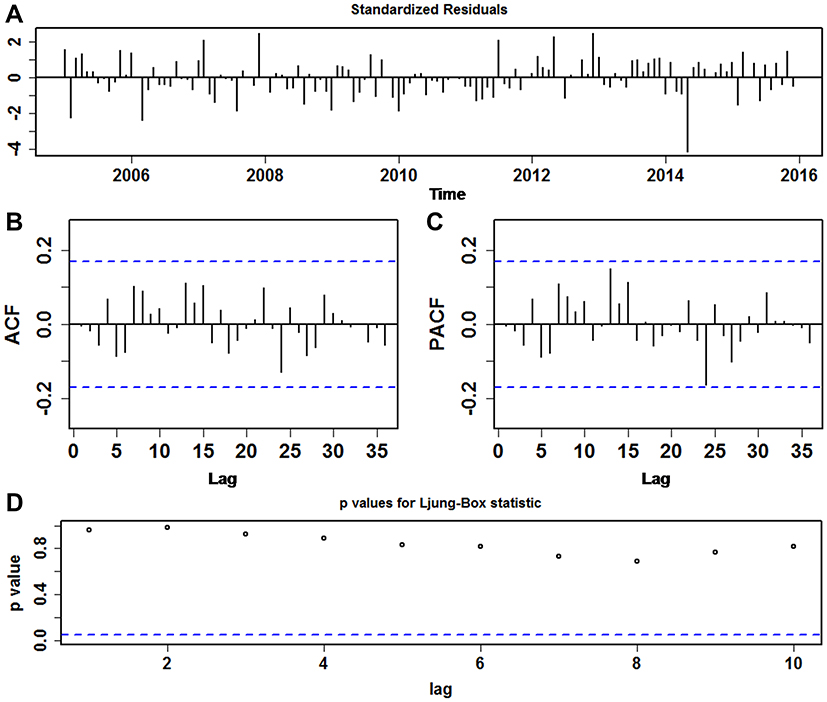 |
Figure 4 Tests of goodness of fit for the error series of TB morbidity rate from the SARIMA-NNNAR(3,1,7)12combined method. (A) Standardized residual series; (B) Autocorrelation function (ACF) plot for the residual series; (C) Partial autocorrelation function (PACF) plot for the residual series; (D) Q-statistic P-values. As presented, there were no sample ACF and PACF falling approximately out of the 95% uncertainty bounds other than that at lag 10 in the ACF and PACF graphs. These manifested its adequacy and suitability of this data-driven hybrid model for the data. |
Sensitivity Analysis and Performance Evaluation
In our current work, we further performed a sensitivity analysis with the data from January 2004 to July 2016 in order to test the models’ uncertainty. In this analysis, the modelling steps for all the models were the same as those mentioned above. All the results of the analysis are given in Tables S1–S3 and Figures S5–S7. Afterward, the results emerging from the two analyses were compared and summarized in Table 6, showing that the data-driven advanced SARIMA-NNNAR hybrid model gave the lowest values of the measures including MAE, MAPE, RMSE and MER among the three identified models, and similar findings were also observed in the sensitivity analysis. Meanwhile, as illustrated by Figure 5, the advanced hybrid technique was able to better model the seasonal and cyclic behaviors relative to other models, suggesting that the SARIMA-NNNAR hybrid method remained more accurate and robust than the single SARIMA and NNNAR approaches in fitting the TB morbidity series. Besides, we noted that the basic SARIMA method presented a better performance in the 12-step forecasting stage than the NNNAR approach, which was in contradiction to in the 5-step forecasting stage.
 |
Figure 5 Resulting comparisons of the in-sample mimics and out-of-sample projections using the preferred three models. A projection for the hold-out 12 months’ data was as the shaded area. Overall, it was seen that the simulations and forecasts (black solid line) with the advanced data-driven SARIMA-NNNAR combined model provided a better approximation to the actual morbidity rate (red solid line) than both the SARIMA and NNNAR models. (A) SARIMA model; (B) NNNAR model; (C) SARIMA-NNNAR model. |
Discussion
Currently, TB is still a major public problem in Qinghai province due to its continued upsurge in recent years.4 Early prediction models have served as a useful tool for forming effective intervention strategies and allocating limited health resources. However, as far as we are aware there is no report so far using advanced techniques to model the epidemic trajectories of TB in Qinghai province. Under such conditions, we initiated this research with the aim of developing an advanced prediction model by fusing a SARIMA with an NNNAR for analyzing the TB incidence series. The validity and flexibility of this approach were evaluated and tested by a series of comparative experiments with investigations that used only one method. Our results showed that the best-performing SARIMA-NNNAR technique was more accurate and robust than the best-fitting SARIMA and NNNAR approaches separately, be it in the in-data subsamples, or in the hold-out subsamples. Commonly, a MAPE value of less than 10% is considered highly accurate for a forecast.6 Exhilaratingly, such a desired and satisfactory performance was attained by this proposed advanced hybrid method, which provided strong evidence for the efficacy of this approach. Whilst we also built a dynamic Jordan neural network simulating to the TB incidence data; which has recently been shown to provide a deeper insight into the epidemic patterns of contagious disease compared with the common Elman network.9 Likewise, by considering the four measure indices, it can be suggested that the SARIMA-NNNAR mixture model also outperforms this dynamic network (Tables S4–S6 and Figure S8). Considering its excellent performance, this combined approach can act as a basis for the decision-making process of measures for TB prevention. Also, according to the results of the performance measures, the basic SARIMA and NNNAR methods had a good fitness for tracking the TB epidemic, yet an intriguing finding was that the NNNAR network showed a better accuracy in the 5-step ahead forecasts than the SARIMA model, which is contrary to the results of the 12-step ahead forecasts, which further provided evidence for the suitability of the NNNAR network for applications in capturing the short-term dynamic dependence. Additionally, we found that the constructed SARIMA-NNNAR mixture model tended to react slowly for changes in the real data. This may stem from the fact that the TB incidence rate showed a more noticeable upturn from 2015 to 2016 (Figure 5).
The SARIMA model has been a popular tool for analyzing and exploring time series with noticeable seasonal and periodic behaviors such as economic data and infectious incidence or mortality data.11,22 Despite its relatively high forecasting capability, this model is unable to handle nonlinear information reasonably well owing to its assumption of linearity. To offset this drawback, the NNNAR network has emerged as a promising alternative thanks to its short-term memory function in addition to the properties of common BP, GRNN and RBF, etc., which allows it to handle any nonlinear dynamic system problem without any constraints.20 Motivated by the individual and opposing superiorities of the SARIMA and NNNAR methods in addressing various problems; in this study, the combined SARIMA-NNNAR model was thus customized for use with linear and nonlinear information of TB incidence data in order to improve the forecasting ability of either of the approaches alone. As expected, this hybrid model outperforms the SARIMA and NNNAR models alone, which concurs well with prior work regarding forecasting using other hybrid models of the SARIMA-BP and SARIMA-GRNN.11,14 In this regard, this hybrid technique gained an insight into the TB incidence series in Qinghai, and its importance as a decision-making supportive tool for facilitating the end of the TB epidemic in the future should be emphasized. Worth noting is that this hybrid model is significantly better for short-term forecasting, whereas long-term forecasting may be of even greater value for decision-making with reference to the prevention and control of TB epidemics. Importantly, with recent rapid advances in ANNs and wavelet decomposition techniques, some ANNs capable of capturing long-term dynamic dependent information have been proposed and have been used for forecasting time series. For example, several studies have established models by incorporating convolution neural networks (CNN) as well as ensemble empirical mode composition (EEDM) and long short-term memory neural network (LSTM) to undertake forecasting for PM2.5 concentrations.24,25 Accordingly, what is now needed are studies concentrating on the potential applications of the aforementioned novel combination of methods for the TB incidence series prediction, and performance comparisons between our hybrid model and others. Besides, another issue worthy of attention is the overprediction or underprediction when using the basic NNNAR and SARIMA-NNNAR hybrid models. In the current work, to attenuate or avoid this issue: firstly, we divided our data into training and testing subsamples. Then, we selected suitable ranges for the knots in the hidden layer and the lagged inputs based on those reported by a body of earlier literature;7,18-21 and next, every time we ran the network, the performance measures on both subsamples of MAPE and RMSE were computed and compared, as such, until the minimum values were found on both subsamples simultaneously.
Understanding the seasonal characteristics of infectious diseases acts as a vital role in deciding when and which preventive and control measures to be implemented.26 In this time analysis, we observed that there were noticeable seasonal fluctuations in the TB morbidity series in Qinghai, which matches the conclusion found in prior work that TB is a seasonal illness.27 Qinghai had peak activities of TB mainly in late winter and early spring, and a trough primarily presented itself during the whole of autumn and early winter. This is in agreement with reports at the national level and most of the northwest areas of China, as well as other countries such as Japan and Spain,27–30 but fails to be in line with Eastern Cape and northern India.12,31 Furthermore, inconsistent with all previous work,12,27-31 the TB morbidity of Qinghai also exhibited basically exclusive semi-annual seasonal characteristics with longer peak activities from January until July and trough activities from August until December. In Qinghai, it seems that a number of factors are associated with this seasonal peak pattern. One plausible explanation may be the fact that Qinghai province, as a world-famous tourist city, attracts tens of millions of domestic and foreign tourists every year, with tourists amounting to 42.0438 million in 2018.32 Of them, the numbers visiting during the high-risk seasons of TB nearly accounted for 80% of the cases.32 High numbers may help the spread of TB, which also matches the trend observed in the high-risk seasons in the temporal sequence. Besides, the climatic characteristics of Qinghai province with its strong winds, sandstorms, drought, great diurnal range of temperatures and low temperatures may result in an upsurge of TB as most people undertake their activities under relatively poor ventilation and overcrowded conditions for these reasons.4,33 Furthermore, another cause may be ascribed to the “spring festival effects”,6 because Qinghai witnesses the largest-scale population movement within the two months before and after the spring festival. Thus, this “spring festival effects” may be mainly responsible for the high-risk seasons, on account of the fact that TB is required to experience a latent period with 4 to 8 weeks from infection to medical diagnosis,34 which fits well with the maximum peak in March. Additionally, other possible factors correlated with the peak activities in TB morbidity are subject to further investigation.
In contradiction to the fact that the TB morbidity rate is currently dropping by 2% per year globally and by 3% in China,6 we observed in this work that the TB morbidity has exhibited an upsurge with a yearly average increment of approximately 5% since 2004, despite in the context of universal coverage of directly observed treatment, a short-course (DOTS) strategy.35 While progress has been made toward achieving the goal of a world free of TB by 2035, the annual decline in TB morbidity needs to be accelerated to an average of about 5% by 2020, 10% by 2025 and 17% between 2025 and 2035 worldwide.3 Obviously faced with such a daunting challenge, the TB incidence rate in Qinghai province has been a major obstacle to the accomplishment of the goal of ending the TB epidemic during different periods. In Qinghai province, a poor primary health-care infrastructure and low socio-economic conditions,33 ranked it second last of 31 provinces and municipalities in 2018,36 which may act as a pivotal trigger for the ongoing upsurge of TB incidence; another main contributor may be associated with the local environment and climatic conditions.33 Therefore, to ensure that China is on the track to reach the targets of a world free of TB, some comprehensive and targeted control and intervention strategies must be put into practice, and there is an imminent need that concentrates on exploration for the feasibility of additional preventive measures.
In this time series, we focused on developing an advanced technique driven by the TB incidence data in Qinghai province and the SARIMA-NNNAR hybrid model that we have identified indeed assists in our understanding of future epidemic patterns of TB. However, several flaws still need to be acknowledged. Firstly, there is currently scant guidance in choosing suitable-lagged inputs and knots in the hidden layer. In applications, repeated trials may be the best avenue. Secondly, adding influencing factors correlated with TB transmission into this model may help improve the forecasting performance, but this was not considered in this study. Thirdly, the SARIMA model does well in short-term prediction, which means that a long-term forecast should be undertaken with attention on using the hybrid SARIMA-based method. Lastly, the generalizability of this approach requires further authentication through other work.
Conclusion
In conclusion, despite its shortcomings, the analytic results do demonstrate the contributions of this SARIMA-NNNAR hybrid technique over both the basic SARIMA and NNNAR methods in the TB incidence forecasting in Qinghai province, which will be a helpful tool for the decision-making process of TB prevention. Furthermore, comprehensive and effective strategies must be taken to address the upsurge issue in the TB incidence of Qinghai province.
Acknowledgments
We thanked the data-center of China public health science for sharing this data. This project was supported by the MD Research Project of Xinxiang Medical University (XYBSKYZZ201912). The funders have no role in all the processes of the manuscript.
Author Contributions
All authors contributed to data analysis, drafting and revising the article, gave final approval of the version to be published, and agree to be accountable for all aspects of the work.
Disclosure
The authors report no conflicts of interest in this study.
References
1. WHO. Global tuberculosis report 2018. Available from: https://wwwwhoint/tb/publications/global_report/en/.
2. WHO. Global strategy and targets for tuberculosis prevention, care and control after 2015. Available from: https://wwwwhoint/tb/post2015_strategy/en/.
3. WHO. The end TB strategy. 2014. Available from: https://wwwwhoint/tb/End_TB_brochurepdf.
4. Rao H, Shi X, Zhang X. Using the Kulldorff’s scan statistical analysis to detect spatio-temporal clusters of tuberculosis in Qinghai Province, China, 2009-2016. BMC Infect Dis. 2017;17(1):578. doi:10.1186/s12879-017-2643-y
5. National Health Commission of the People’s Republic of China. National data of notifiable communicable disease in 2018. 2019. Available from: http://wwwnhcgovcn/jkj/s3578/201904/050427ff32704a5db64f4ae1f6d57c6cshtml.
6. Wang Y, Xu C, Zhang S, et al. Temporal trends analysis of tuberculosis morbidity in mainland China from 1997 to 2025 using a new SARIMA-NARNNX hybrid model. BMJ Open. 2019;9(7):e024409. doi:10.1136/bmjopen-2018-024409
7. Liu Q, Li Z, Ji Y, et al. Forecasting the seasonality and trend of pulmonary tuberculosis in Jiangsu Province of China using advanced statistical time-series analyses. Infect Drug Resist. 2019;12:2311–2322. doi:10.2147/idr.s207809
8. Duan Y, Huang XL, Wang YJ, et al. Impact of meteorological changes on the incidence of scarlet fever in Hefei City, China. Int J Biometeorol. 2016;60(10):1543–1550. doi:10.1007/s00484-016-1145-8
9. Wu W, An SY, Guan P, Huang DS, Zhou BS. Time series analysis of human brucellosis in mainland China by using Elman and Jordan recurrent neural networks. BMC Infect Dis. 2019;19(1):414. doi:10.1186/s12879-019-4028-x
10. Zhang Y, Bambrick H, Mengersen K, et al. Using big data to predict pertussis infections in Jinan city, China: a time series analysis. Int J Biometeorol. 2019. doi:10.1007/s00484-019-01796-w
11. Li Z, Wang Z, Song H, et al. Application of a hybrid model in predicting the incidence of tuberculosis in a Chinese population. Infect Drug Resist. 2019;12:1011–1020. doi:10.2147/idr.s190418
12. Adeboye A, Davies O, Akinwumi O, James N, Ruffin M. Seasonality and trend forecasting of tuberculosis prevalence data in Eastern Cape, South Africa, Using a Hybrid Model. Int J Environ Res Public Health. 2016;13(8):757. doi:10.3390/ijerph13080757
13. Fanoodi B, Malmir B, Jahantigh FF. Reducing demand uncertainty in the platelet supply chain through artificial neural networks and ARIMA models. Comput Biol Med. 2019;113:103415. doi:10.1016/j.compbiomed.2019.103415
14. Ren H, Li J, Yuan ZA, Hu JY, Yu Y, Lu YH. The development of a combined mathematical model to forecast the incidence of hepatitis E in Shanghai, China. BMC Infect Dis. 2013;13:421. doi:10.1186/1471-2334-13-421
15. Mini KG, Kuriakose S, Sathianandan TV. Modeling CPUE series for the fishery along northeast coast of India: A comparison between the HoltWinters, ARIMA and NNAR models. J MarBiol Associa of India. 2015;2(57):75–82. doi:10.6024/jmbai.2015.57.2.1884-11
16. Wang Y, Xu C, Zhang S, et al. Development and evaluation of a deep learning approach for modeling seasonality and trends in hand-foot-mouth disease incidence in mainland China. Sci Rep. 2019;9(1):8046. doi:10.1038/s41598-019-44469-9
17. Akhtar S, Rozi S. An autoregressive integrated moving average model for short-term prediction of hepatitis C virus seropositivity among male volunteer blood donors in Karachi, Pakistan. World J Gastroenterol. 2009;15(13):1607–1612. doi:10.3748/wjg.15.1607
18. Nury AH, Hasan K, Alam MJB. Comparative study of wavelet-ARIMA and wavelet-ANN models for temperature time series data in northeastern Bangladesh. J King Saud Univ Sci. 2017;29(1):47–61. doi:10.1016/j.jksus.2015.12.002
19. Lam KC, Oshodi OS. Forecasting construction output: a comparison of artificial neural network and Box-Jenkins model. Engin Cons Archi Manage. 2016;23(3):302–322. doi:10.1108/ECAM-05-2015-0080
20. Maleki A, Nasseri S, Aminabad MS, Hadi M. Comparison of ARIMA and NNAR models for forecasting water treatment plant’s influent characteristics. KSCE J Civil Eng. 2018;22(6):1–13.
21. Thoplan R. Simple v/s sophisticated methods of forecasting for mauritius monthly tourist arrival data. Int J Stat Applic. 2014;4(5):217–223. doi:10.5923/j.statistics.20140405.01
22. Zheng YL, Zhang LP, Zhang XL, Wang K, Zheng YJ. Forecast model analysis for the morbidity of tuberculosis in Xinjiang, China. PLoS One. 2015;10(3):e0116832. doi:10.1371/journal.pone.0116832
23. Pötscher BM. The behaviour of the Lagrangian multiplier test in testing the orders of an ARMA-model. Metrika. 1985;32(1):129–150. doi:10.1007/bf01897808
24. Li X, Peng L, Yao X, et al. Long short-term memory neural network for air pollutant concentration predictions: method development and evaluation. Environ Pollut. 2017;231(Pt 1):997–1004. doi:10.1016/j.envpol.2017.08.114
25. Yuan W, Wang K, Bo X, Tang L, Wu J. A novel multi-factor & multi-scale method for PM2.5 concentration forecasting. Environ Pollut. 2019;255(1):113187. doi:10.1016/j.envpol.2019.113187
26. Held L, Paul M. Modeling seasonality in space-time infectious disease surveillance data. Biom J. 2012;54(6):824–843. doi:10.1002/bimj.201200037
27. Wang H, Tian CW, Wang WM, Luo XM. Time-series analysis of tuberculosis from 2005 to 2017 in China. Epidemiol Infect. 2018;146(8):935–939. doi:10.1017/S0950268818001115
28. Wubuli A, Li Y, Xue F, Yao X, Upur H, Wushouer Q. Seasonality of active tuberculosis notification from 2005 to 2014 in Xinjiang, China. PLoS One. 2017;12(7):e0180226. doi:10.1371/journal.pone.0180226
29. Nagayama N, Ohmori M. Seasonality in various forms of tuberculosis. Int J Tuberc Lung Dis. 2006;10(10):1117–1122.
30. Rios M, Garcia JM, Sanchez JA, Perez D. A statistical analysis of the seasonality in pulmonary tuberculosis. Eur J Epidemiol. 2000;16(5):483–488. doi:10.1023/a:1007653329972
31. Thorpe LE, Frieden TR, Laserson KF, Wells C, Khatri GR. Seasonality of tuberculosis in India: is it real and what does it tell us? Lancet. 2004;364(9445):1613–1614. doi:10.1016/s0140-6736(04)17316-9
32. Qinghai Provincial Bureau Of Statistics. The latest statistics. Available from: http://tjjqinghaigovcn/tjData/newData/.
33. Rao HX, Zhang X, Zhao L, et al. Spatial transmission and meteorological determinants of tuberculosis incidence in Qinghai Province, China: a spatial clustering panel analysis. Infect Dis Poverty. 2016;5(1):45. doi:10.1186/s40249-016-0139-4
34. Li XX, Wang LX, Zhang H, et al. Seasonal variations in notification of active tuberculosis cases in China, 2005-2012. PLoS One. 2013;8(7):e68102. doi:10.1371/journal.pone.0068102
35. Wang L, Zhang H, Ruan Y, et al. Tuberculosis prevalence in China, 1990-2010; a longitudinal analysis of national survey data. Lancet. 2014;383(9934):2057–2064. doi:10.1016/s0140-6736(13)62639-2
36. National Statistical Bureau. The latest statistics. Available from: http://data.stats.gov.cn/search.htm?s=GDP:615.
 © 2020 The Author(s). This work is published and licensed by Dove Medical Press Limited. The
full terms of this license are available at https://www.dovepress.com/terms
and incorporate the Creative Commons Attribution
- Non Commercial (unported, 3.0) License.
By accessing the work you hereby accept the Terms. Non-commercial uses of the work are permitted
without any further permission from Dove Medical Press Limited, provided the work is properly
attributed. For permission for commercial use of this work, please see paragraphs 4.2 and 5 of our Terms.
© 2020 The Author(s). This work is published and licensed by Dove Medical Press Limited. The
full terms of this license are available at https://www.dovepress.com/terms
and incorporate the Creative Commons Attribution
- Non Commercial (unported, 3.0) License.
By accessing the work you hereby accept the Terms. Non-commercial uses of the work are permitted
without any further permission from Dove Medical Press Limited, provided the work is properly
attributed. For permission for commercial use of this work, please see paragraphs 4.2 and 5 of our Terms.