Back to Journals » OncoTargets and Therapy » Volume 13
AMPK α1 Downregulates ROS Levels Through Regulating Trx Leading to Dysfunction of Apoptosis in Non-Small Cell Lung Cancer
Authors Gong D ![]() , Li Y, Wang Y
, Li Y, Wang Y ![]() , Chi B, Zhang J, Gu J, Yang J, Xu X, Hu S, Min L
, Chi B, Zhang J, Gu J, Yang J, Xu X, Hu S, Min L
Received 27 October 2019
Accepted for publication 17 May 2020
Published 23 June 2020 Volume 2020:13 Pages 5967—5977
DOI https://doi.org/10.2147/OTT.S236235
Checked for plagiarism Yes
Review by Single anonymous peer review
Peer reviewer comments 2
Editor who approved publication: Prof. Dr. Takuya Aoki
Daohui Gong,1,* Ying Li,2,* Yuxiu Wang,1,* Beiyuan Chi,1 Jun Zhang,1 Jianjun Gu,1 JunJun Yang,1 Xingxiang Xu,1 Suwei Hu,3 Lingfeng Min1
1Department of Respiratory Medicine, Northern Jiangsu People’s Hospital, Clinical Medical College of Yangzhou University, Yangzhou, Jiangsu, People’s Republic of China; 2Department of Medical Oncology, Northern Jiangsu People’s Hospital, Clinical Medical College of Yangzhou University, Yangzhou, Jiangsu, People’s Republic of China; 3Medical Genetic Center, Yangzhou Maternal and Child Health Care Service Centre, The Affiliated Hospital of Yangzhou University Medical College, Yangzhou, Jiangsu, People’s Republic of China
*These authors contributed equally to this work
Correspondence: Lingfeng Min
Department of Respiratory Medicine, Northern Jiangsu People’s Hospital, Clinical Medical College of Yangzhou University, Nantong West Road 98, Yangzhou, Jiangsu 225001, People’s Republic of China
Tel +86-18051061783
Email [email protected]
Suwei Hu
Medical Genetic Center, Yangzhou Maternal and Child Health Care Service Centre, The Affiliated Hospital of Yangzhou University Medical College, Yangzhou, Jiangsu 225002, People’s Republic of China
Tel +86-18912137872
Email [email protected]
Purpose: AMP-activated protein kinase α 1 (AMPK α 1) associates closely with cancers. However, the relationship between AMPK α 1 and non-small cell lung cancer (NSCLC) is not fully understood. In this study, we aim to explore the role and mechanism of AMPK α 1 in NSCLC initiation and progression.
Materials and Methods: A total of 165 clinical NSCLC specimens were included in the formalin-fixed and paraffin-embedded (FFPE) lung cancer tissue arrays. The expression levels of AMPK α 1 and thioredoxin (Trx) in NSCLC cancer tissues and adjacent non-tumor lung tissues were measured through using immunohistochemistry. MTT assay was used to detect cell proliferation. Intracellular ROS levels were measured by using H2DCFDA reagent. Lentiviruses including LV-PRKAA1-RNAi, LV-PRKAA1 and a negative LV-control were used to infect A549 cells to modulate AMPK α 1 expression in vitro. Immunoblotting was used to determine the modulation relationship between AMPK α 1 and Trx. Log rank test and Kaplan–Meier survival analysis were performed to evaluate the significances of AMPK α 1 and Trx expression levels on NSCLC patients’ prognoses.
Results: AMPK α 1 was highly expressed in NSCLC cancer tissues and correlated with poor prognosis in patients with NSCLC. In A549 cells, overexpression of AMPK α 1 promoted proliferation, suppressed ROS levels and inhibited apoptosis. Moreover, inhibition of AMPK α 1 expression achieved the opposite effects. Trx was significantly overexpressed in NSCLC cancer tissues; furthermore, Trx expressed much more in cytoplasm when compared with cell nucleus. Trx expression levels were positively correlated with AMPK α 1 expression levels in NSCLC tissues. AMPK α 1 could regulate Trx in A549 cells. No significant correlations were observed between Trx expression variances and prognoses in NSCLC patients. Combination of AMPK α 1 and Trx had no advantage in predicting prognoses of NSCLC patients.
Conclusion: These results suggest that AMPK α 1 serves a carcinogenic role at least in part through the regulation of Trx expression, and thus represents a potential treatment target in patients with NSCLC.
Keywords: AMPK α 1, ROS, apoptosis, non-small cell lung cancer
Introduction
Lung cancer, a commonly occurring cancer with high mortality, has already caused 1.8 million new cases and 1.6 million deaths worldwide in 2012.1 Moreover, lung cancer incidence rate is still increasing in China and in many other countries.2,3 Non-small cell lung cancer (NSCLC), including squamous cell carcinoma, adenocarcinoma and large cell carcinoma, accounts for nearly 85% of all lung cancer cases. Despite considerable improvement in the detection rate and advances in treatment, the prognosis of NSCLC patients remains grim.4 An improved understanding of the mechanism, as well as identification of prognostic and predictive biomarkers in NSCLC is needed to improve the clinical management of these patients.
AMP-activated protein kinase (AMPK), consisting of a catalytic α-subunit and two regulatory β- and γ-subunits, functions as an energy sensor and regulator to maintain intracellular homoeostasis. AMPK α1 is the most important catalytic subunit of AMPK. AMPK α1 was essential for efficient autophagosome maturation and lysosomal fusion.5 Depletion of AMPK α1 could induce cell death via promoting apoptosis.6 Those findings suggested a close association between AMPK α1 and cancers. However, the role and mechanism of AMPK α1 in NSCLC initiation and progression are still not fully understood. Further exploration of the role and mechanism of AMPK α1 may provide new insights for NSCLC treatment.
In this study, we determine to explore the relationship between AMPK α1 expression variances and clinicopathologic features as well as prognosis in NSCLC patients, and further establish the potential mechanism of AMPK α1 in NSCLC initiation and progression.
Materials and Methods
Tissue Arrays
Formalin-fixed and paraffin-embedded (FFPE) lung cancer tissue arrays were obtained from the National Engineering Center for BioChips in Shanghai, China. A total of 165 clinical NSCLC specimens (90 adenocarcinoma patients and 75 squamous cell carcinoma patients) were included in the tissue arrays. The operation times for squamous cell carcinoma patients were between July 2004 and November 2007, and the patients were follow-up visited to July 2012. For adenocarcinoma patients, the operation times were between July 2004 and June 2009, and the follow-up visit was finished in August 2014. The patients’ clinical records and histopathological diagnoses were fully documented. Survival times were calculated in months and defined as the time from operation time until death, or censored if no death was noted at follow-up date.
Cell Culture
The human lung cancer cell line A549 (Yingrun Biotechnologies Inc., Changsha, China) was used for experiments in vitro. Parental A549 cells and lentivirus infected A549 cells were cultivated in RPMI-1640 supplemented with 10% fetal bovine serum (Biological Industries, Cromwell, CT, USA). Cells were maintained at 37°C in a humidified atmosphere of 5% CO2.
Cell Proliferation Assay
2.7.3-(4,5-dimethylthiazol-2-yl)-2,5-diphenyltetrazolium bromide (MTT) assay was used to measure cell proliferation. Cells were seeded at an initial density of 5000 cells/mL in 96-well plates. Cell viability was assessed at different time points (12, 24, 48, or 72 hours) using 0.5 mg/mL MTT solution (Sigma, MO, USA). Approximately 4 h later, the medium was replaced with 150 µL dimethyl sulfoxide (DMSO, Sigma, MO, USA) and vortexed for 10 min. The absorbance at 490 nm (A490) of each well was read using a spectrophotometer. Each experiment was performed at least in triplicate.
Lentivirus and Cell Infection
To modulate AMPK α1 expression levels in A549 cells, lentiviruses, including LV-PRKAA1-RNAi (expressing a short interfering RNA targeting the PRKAA1 gene), LV-PRKAA1 (a lentivirus overexpressing the PRKAA1 gene), and a negative LV-control were purchased from Shanghai GeneChem Co., Ltd. (Shanghai, China). According to the manufacturer’s instructions, 5.0×10⁴ cells supplemented with 1ul lentivirus and 1ul Polybrene (GENECHEM Co., Ltd, Shanghai, China) were grown on 24-well plates. 24 hours later, the supernatant was removed and fresh culture medium was added to the cells. Fluorescence microscopy was used to observe the infection rate at 72 hours post-infection, and stable clones were selected after 2 weeks using puromycin (2 µg/mL) (GE Healthcare Life Sciences, Little Chalfont, UK). The final infection efficiency was confirmed by Western blot.
Measurement of Intracellular ROS Levels
2ʹ,7ʹ-dichlorofluorescin diacetate (H2DCFDA) (Sigma Aldrich, Saint Louis, Missouri, United States) was used to measure intracellular ROS levels. Cells were loaded with 10 Um H2DCFDA for 30 min in the dark. Fluorescence intensity (wavelengths of excitation and emission were 490 and 530 nm) was measured using spectrofluorimetry. Fluorescence intensity was normalized to % of cell alive.
Immunohistochemical Staining Analysis (IHC)
Samples were deparaffinized and then rehydrated through an alcohol gradient. Endogenous peroxidase activity was blocked through incubation of slides in 3% H2O2 at room temperature for 15 minutes. Antigen retrieval was performed by incubation with citrate buffer (pH 6.0) at 95°C for 15 minutes. The proteins were detected using primary antibodies (AMPK α1 and Trx) (dilution, 1:200; Abcam, Cambridge, UK) and incubated at 4°C overnight. Then, reactions were detected with EnVision™ + Peroxidase kit (Dako; Agilent Technologies, Inc., Santa Clara, CA, USA) at room temperature for 30 minutes. Sections were stained with 3,3ʹ-diaminobenzidine (Dako; Agilent Technologies, Inc.), counterstained with hematoxylin, dehydrated through an alcohol gradient, cleared with xylene and cover-slipped with permanent mounting media.
Score Standard of IHC
Staining intensity of cells was scored as negative (0), weak (1), intermediate (2), and strong (3). The score for the proportion of positive cells was as follows: none positive cells (0), 1 to 24% of positive cells (1), 25 to 49% of positive cells (2), 50 to 74% of positive cells (3) and 75 to 100% of positive cells (4). The final score was obtained by multiplying the scores for staining intensity and the scores for proportion of positive cells.
Western Blot Analysis
Cell extracts were prepared with lysis buffer. Protein samples were subjected to SDS-polyacrylamide gel electrophoresis and transferred to PVDF membranes. The membranes were blocked with blocking buffer, incubated with primary antibody overnight at 4°C, and then incubated with secondary antibody for 1 hour at room temperature. Bands were visualized with EeyoECL Plus (Beyotime, shanghai, China). The following antibodies were used: Trx (Cell Signaling Technology, Inc., USA), AMPK α1 (Cell Signaling Technology, Inc., USA), Bcl-2 (Wanleibio, Shenyang, Liaoning, China), Bax (Wanleibio, Shenyang, Liaoning, China). GAPDH (Cell Signaling Technology, Inc., USA) acted as an internal control.
DRUGSURV Database
DRUGSURV is an online tool that integrates the prognostic data of genes for a variety of cancers with publicly available data. DRUGSURV was used to identify whether AMPK α1 acted as an effective prognostic biomarker for NSCLC patients.
Statistical Analysis
Statistical analysis was performed using Graphpad prism 7 (GraphPad Software, San Diego, California, USA). Data were analyzed using the Student’s t-test. Difference of AMPK α1 expression levels between tumor tissues and adjacent non-tumor tissues was evaluated using nonparametric test. Univariate Pearson’s correlation coefficients were calculated to analyze correlations. The Chi-square test was used to identify statistically significant differences between AMPK α1 expression and various clinicopathologic characteristics. Univariate Kaplan–Meier method was performed to calculate overall survival curves according to AMPK α1 expression. Survival differences according to expression were analyzed using the Log rank test. A difference of P<0.05 between groups was considered as a statistically significant result.
Results
Patients’ Characteristics
The characteristics of the 165 NSCLC specimens are shown in Table 1. There were 90 adenocarcinomas and 75 squamous cell carcinomas. Elderly patients were accounted for 66.1% of all the cases. There were 119 (72.1%) males and 46 (27.9%) females. The median age at diagnosis of the NSCLC patients was 63.1 years (range 30 to 84 years). In all 165 NSCLC patients examined in the present study, the median overall survival (OS) was 50.0 months, and the 1, 2, 3, 5-year OS rate were 87.3%, 73.3%, 62.4% and 41.6%, respectively (Figure 1A).
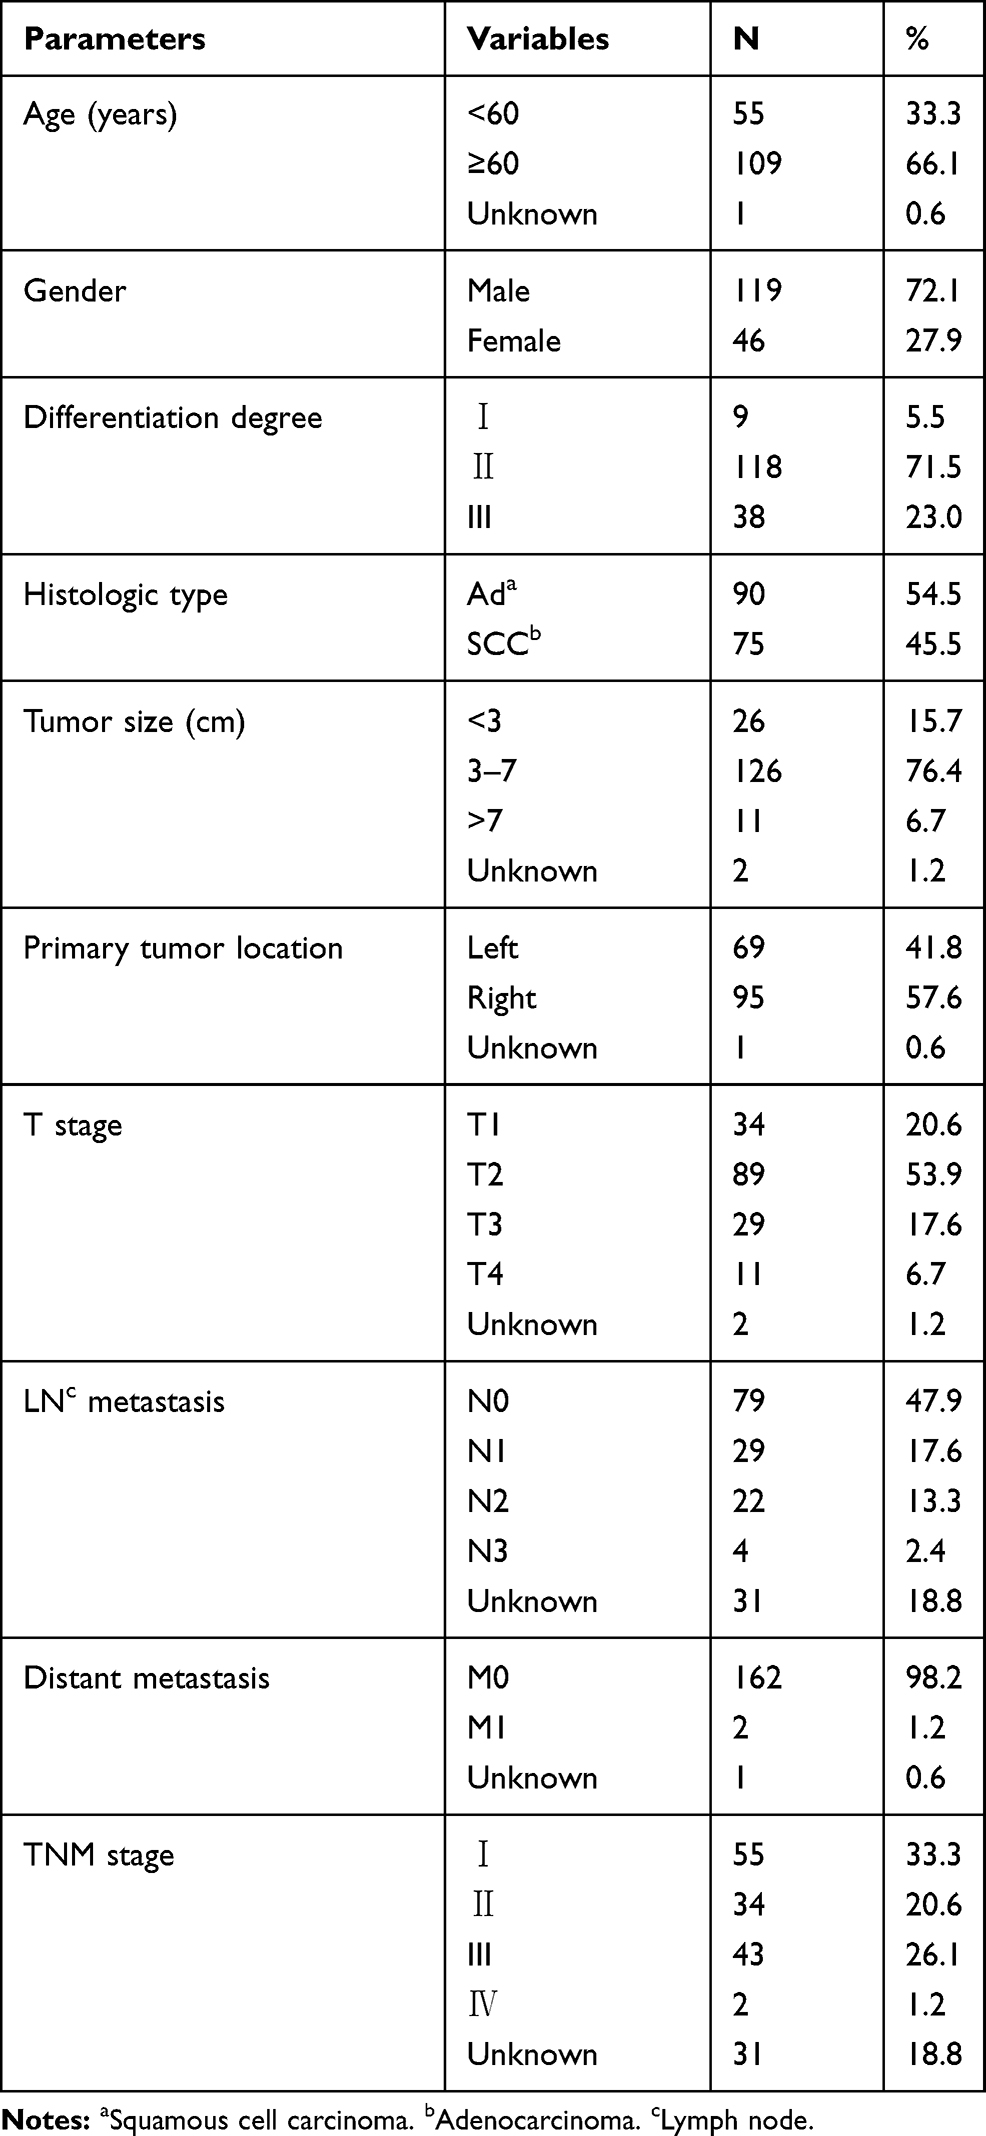 |
Table 1 Clinical and Pathologic Characteristics of the NSCLC Patients |
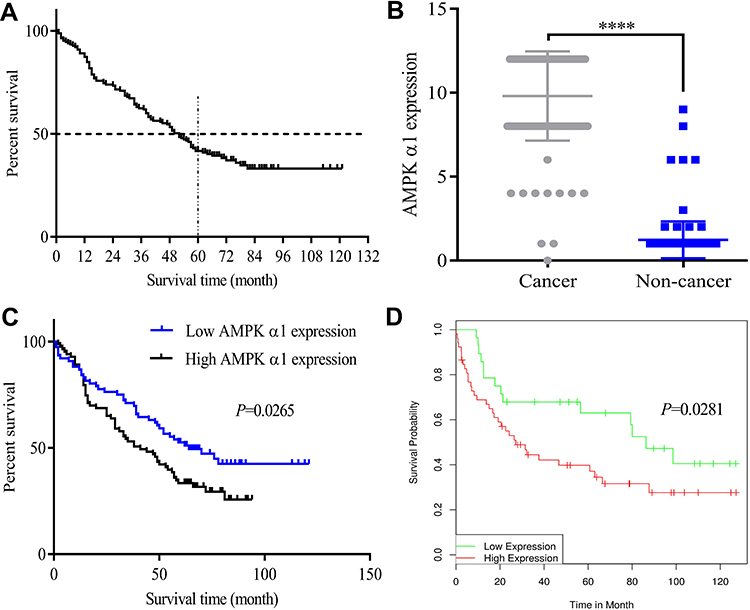 |
Figure 1 AMPK α1 overexpressed in cancer tissues and correlated with poor prognosis in patients with NSCLC. (A) Survival curve for 165 NSCLC patients. (B) Immunohistochemistry revealed higher expression levels of AMPK α1 in NSCLC cancer tissues compared with adjacent non-tumor lung tissues (P<0.0001). (C) Kaplan–Meier curves for overall survival of NSCLC patients according to AMPK α1 expressions. The geometric mean (GM=9.3) of IHC staining score of AMPK α1 was acted as the threshold value to divide the patients into two groups. There were 76 patients with high AMPK α1 expression and 83 patients with low AMPK α1 expression. High AMPK α1 expression levels significantly correlated with shorter overall survivals (P=0.0265). (D) High levels of prkaa1 expression indicated a poor prognosis for NSCLC patients according to DRUGSURV database (P=0.0281) (****means P<0.0001). |
AMPK α1 Overexpressed in Cancer Tissues and Correlated with Poor Prognosis in Patients with NSCLC
In this study, we firstly tested the expression levels of AMPK α1 in NSCLC tumor tissues and adjacent normal lung tissues through using IHC. A total of 159 cancer tissues and 163 normal lung tissues were successfully detected in tissue arrays. IHC staining scores of AMPK α1 are shown in Table 2. Compared with adjacent normal tissues, AMPK α1 was obvious highly expressed in cancer tissues (P<0.0001, Figure 1B).
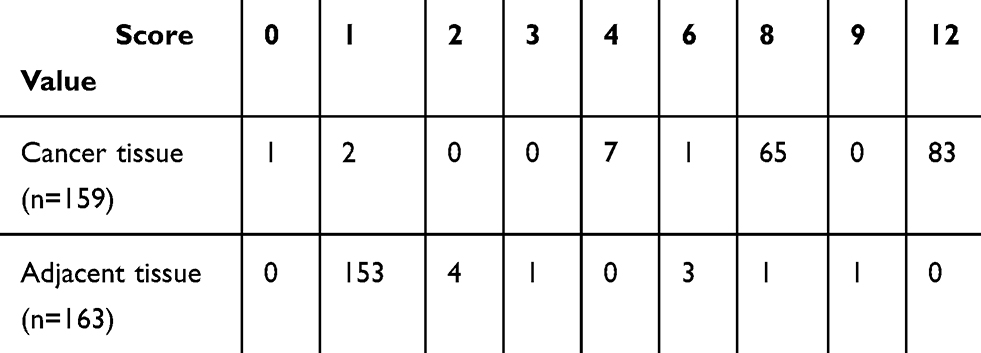 |
Table 2 IHC Staining Scores of AMPK α1 |
To explore the relationship between AMPK α1 expression variances and NSCLC patients’ clinicopathologic characteristics, we chose the geometric mean of IHC staining score of AMPK α1 (IHC staining score of AMPK α1=9.3) as the threshold value, patients were divided into two groups (76 patients with high AMPK α1 expression levels and 83 patients with low AMPK α1 expression levels). AMPK α1 was strongly correlated with T stage (P=0.000), LN metastasis (P=0.000) and TNM stage (P=0.000); however, other characteristics including age (P=0.507), gender (P=0.731), histologic type (P=0.076), tumor size (P=0.812), differentiation degree (P=0.797), primary tumor location (P=0.668) showed no significant associations with AMPK α1 expression levels (Table 3).
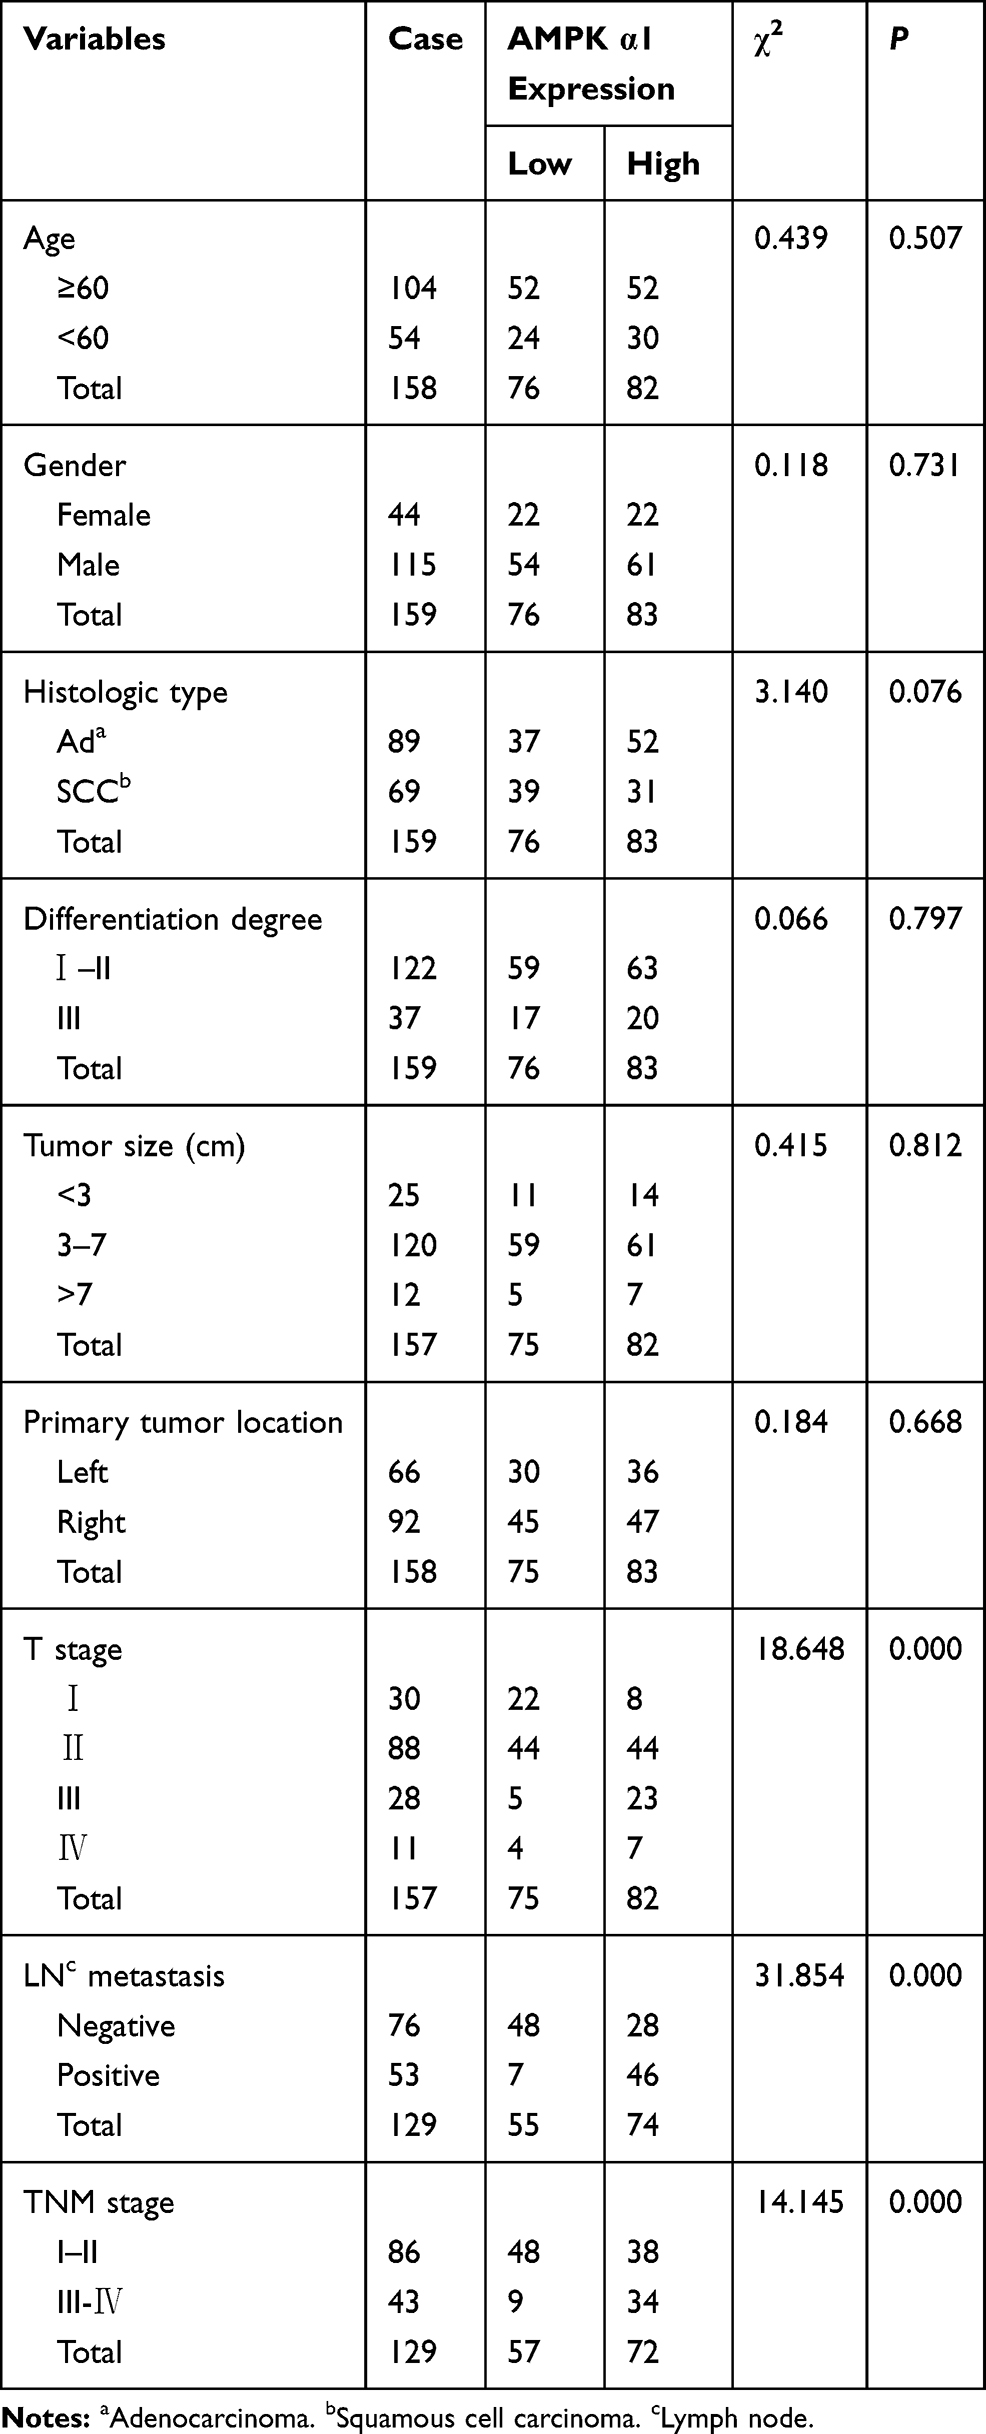 |
Table 3 Correlation Between AMPK α1 Expression and Clinicopathological Characteristics in NSCLC Patients |
Next, a Log rank test and Kaplan–Meier survival analysis were performed to evaluate the correlation between AMPK α1 expression levels and prognoses of NSCLC patients. As shown in Figure 1C, NSCLC patients with high AMPK α1 expression levels had poor prognoses (P=0.0265). To further assess the prognostic significance of AMPK α1 expression on the survival, we analyzed the data GSE21362 from DRUGSURV database. There were 28 patients with low prkaa1 expression levels and 52 patients with high prkaa1 expression levels. The result also showed that NSCLC patients with high prkaa1 expression levels had poor prognoses (P=0.0281) (Figure 1D).
AMPK α1 Promoted Proliferation, Suppressed ROS Levels and Inhibited Apoptosis
Considering high AMPK α1 expression levels correlated with NSCLC progression, we further explored the biological functions of AMPK α1 in NSCLC. A549 cells were, respectively, infected with LV-PRKAA1 and LV-control to modulate AMPK α1 expression. The final infection efficiency was confirmed by Western blot (Figure 2A). As shown in Figure 2B, cell proliferation was significantly enhanced in LV-PRKAA1 A549 cells when compared with LV-control A549 cells (ns at 12h and 24h, P<0.05 at 48h, P<0.0001 at 72h). Then, we examined the effect of AMPK α1 on ROS levels. Compared with LV-control group, decreased ROS levels were observed in LV-PRKAA1 A549 cells (P<0.001, Figure 2C). On account of the fact that ROS is essential for apoptosis initiation, we further tested the expression levels of apoptosis proteins including Bcl-2 and Bax. The expression level of Bcl-2 was upregulated in LV-PRKAA1 A549 cells, while Bax was downregulated (Figure 2D).
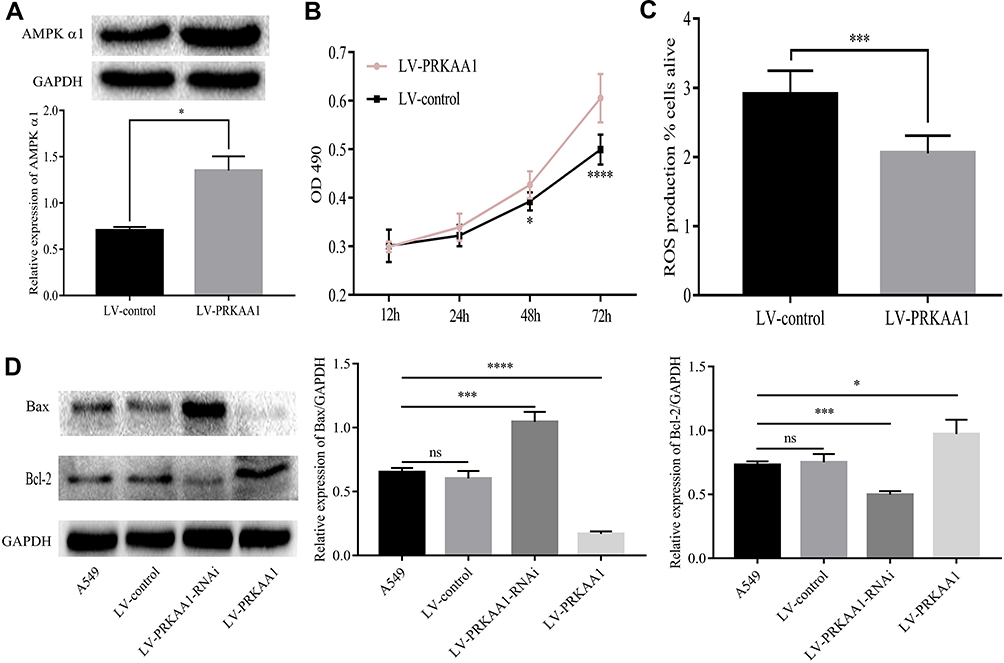 |
Figure 2 AMPK α1 promoted proliferation, suppressed ROS levels and apoptosis. (A) A549 cells were infected with Lentivirus LV-PRKAA1 and high AMPK α1 expression levels were detected in LV-PRKAA1 A549 cells when compared with LV-control A549 cells. (B) LV-PRKAA1 A549 cells had enhanced cell proliferation ability when compared with the LV-control A549 cells (ns at 12h and 24h, P<0.05 at 48h, P<0.0001 at 72h). (C) Overexpression of AMPK α1 reduced ROS levels (P<0.001). (D) Upregulation of AMPK α1 inhibited apoptosis activity (The pro-apoptosis protein Bax was inhibited but the anti-apoptosis protein Bcl-2 was up-regulated); on the contrary, downregulation of AMPK α1 achieved the opposite effect (ns means no significance; *means P<0.05; ***means P<0.001; ****means P<0.0001). |
Repression of AMPK α1 Could Inhibit Proliferation, Increase ROS Levels and Induce Apoptosis
Next, A549 cells were infected with LV-PRKAA1-RNAi to repress AMPK α1 expression. The inhibition efficiency was confirmed by Western blot (Figure 3A). As shown in Figure 3B, we found that cell proliferation was attenuated in LV-PRKAA1-RNAi A549 cells when compared with LV-control cells (ns at 12h, 24h and 48h, P<0.05 at 72h). Suppression of AMPK α1 could increase ROS levels (P<0.05, Figure 3C). Moreover, down-regulation of AMPK α1 induced cell apoptosis according to Western blot assay (Figure 2D).
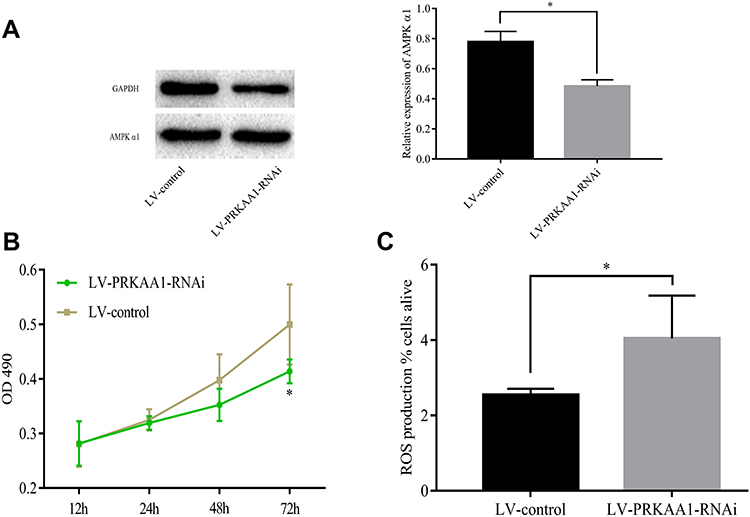 |
Figure 3 Repression of AMPK α1 inhibited proliferation, increased ROS levels. (A) A549 cells were infected with LV-PRKAA1-RNAi to repress AMPK α1 expression. AMPK α1 expression levels were significantly inhibited in LV-PRKAA1-RNAi A549 cells when compared with LV-control A549 cells. (B) Repression of AMPK α1 expression levels attenuated proliferation ability of A549 cells (ns at 12h, 24h and 48h, P<0.05 at 72h). (C) Repression of AMPK α1 expression increased ROS levels when compared with the control cells (P<0.05) (ns means no significance; *means P<0.05). |
AMPK α1 Regulated the Expression of Trx
Thioredoxin (Trx), a ubiquitously expressed small molecule, possesses the ability to diminish oxidative stress. According to previous studies,7 AMPK could regulate Trx expression level. However, whether AMPK α1 could regulate Trx expression in NSCLC is still unknown. Through testing the expression levels of Trx in paired NSCLC tissues and adjacent normal lung tissues, we found that Trx was significantly overexpressed in cancer tissues (Figure 4A and B). In cancer tissues, a total of 159 cytoplasms and 134 nuclei were successfully detected Trx expression levels. IHC staining scores of Trx in cancer tissues are shown in Table 4. We further found that Trx expressed much more in cytoplasm when compared with cell nucleus (Figure 5A, and B). According to Pearson’s correlation analysis, Trx expression level was positively correlated with AMPK α1 expression level in NSCLC tissues (Figure 5C, and D). Through Western blot, we found that up-regulation of AMPK α1 increased Trx expression levels in A549 cells, on the contrary, down-regulation of AMPK α1 could decrease Trx expression levels (Figure 5E).
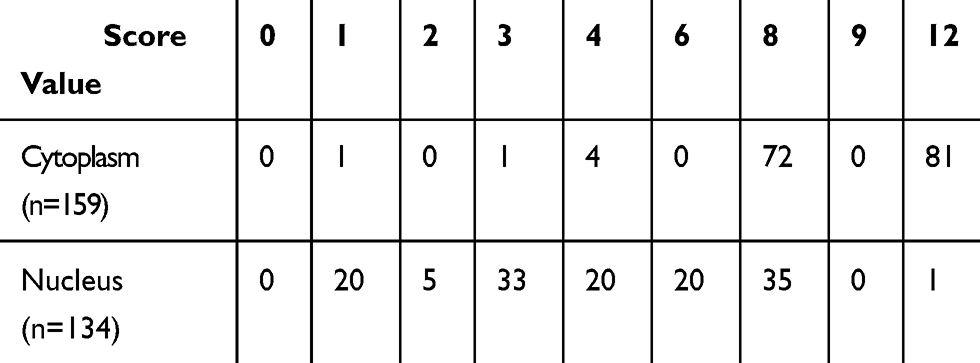 |
Table 4 IHC Staining Scores of Trx |
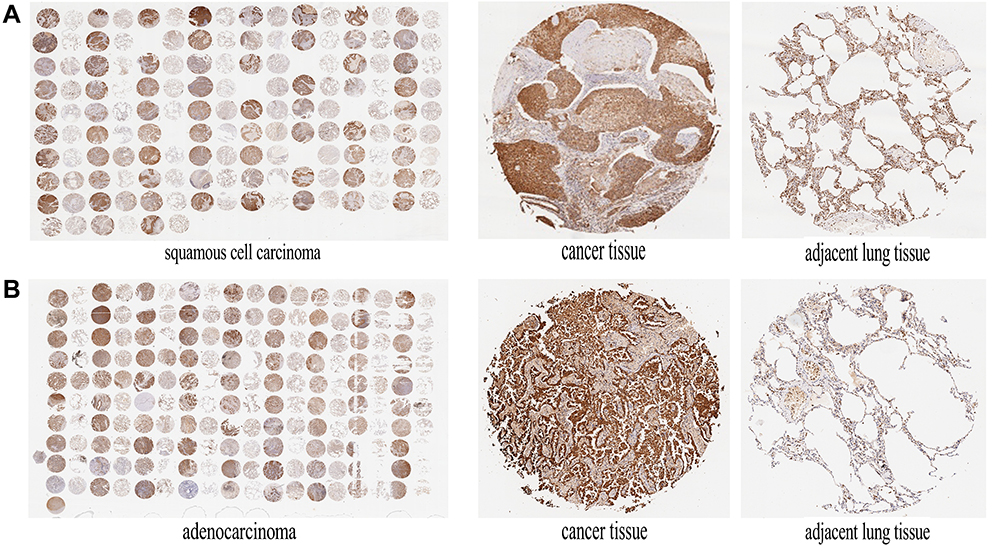 |
Figure 4 Trx was highly expressed in NSCLC tissues. (A) IHC staining of Trx in squamous cell carcinoma tissues and adjacent non-tumor lung tissues. Squamous cell carcinoma tissues expressed higher Trx expression levels compared with tumor-adjacent normal tissues. (B) IHC staining of Trx in adenocarcinoma tissues and adjacent non-tumor lung tissues. Adenocarcinoma tissues expressed higher Trx expression levels when compared with tumor-adjacent normal tissues. |
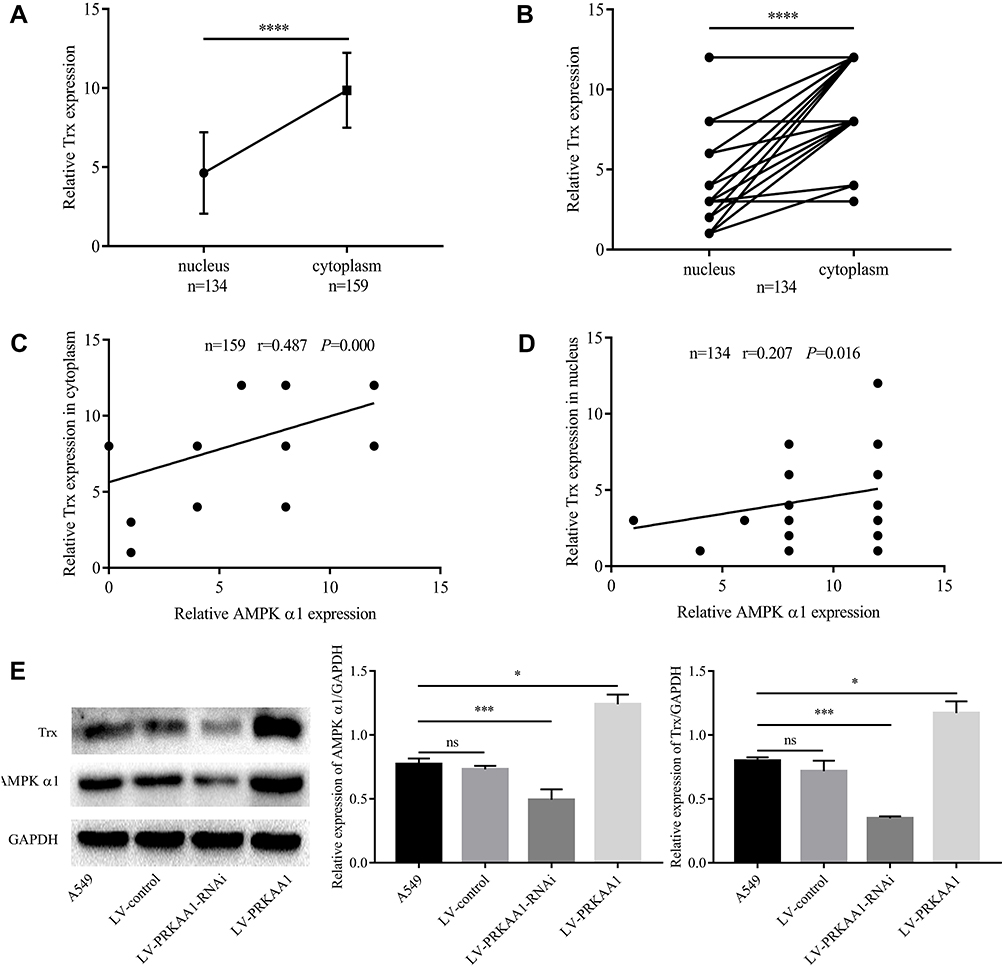 |
Figure 5 AMPK α1 regulated Trx. (A) In non-paired 159 cytoplasm and 134 nucleus, Trx was highly expressed in cytoplasm when compared with nucleus (P<0.0001). (B) In 134 paired cytoplasm and nucleus, Trx was highly expressed in cytoplasm when compared with nucleus (P<0.0001). (C) Trx expression in cytoplasm was positively correlated with AMPK α1 expression (n=159, r=0.487, P=0.000; Pearson’s correlation). (D) Trx expression in nucleus was positively correlated with AMPK α1 expression (n=134, r=0.207, P=0.016; Pearson’s correlation). (E) AMPK α1 positively regulated Trx expression in A549 cells (ns means no significance; *means P<0.05; ***means P<0.001; ****means P<0.0001). |
Considering that Trx was highly expressed in cancer tissues, we explored the association between Trx expression variances and prognosis in NSCLC patients. However, neither Trx expressed in cytoplasm (Figure 6A) nor in nucleus (Figure 6B) showed significant correlations with NSCLC patients’ prognoses.
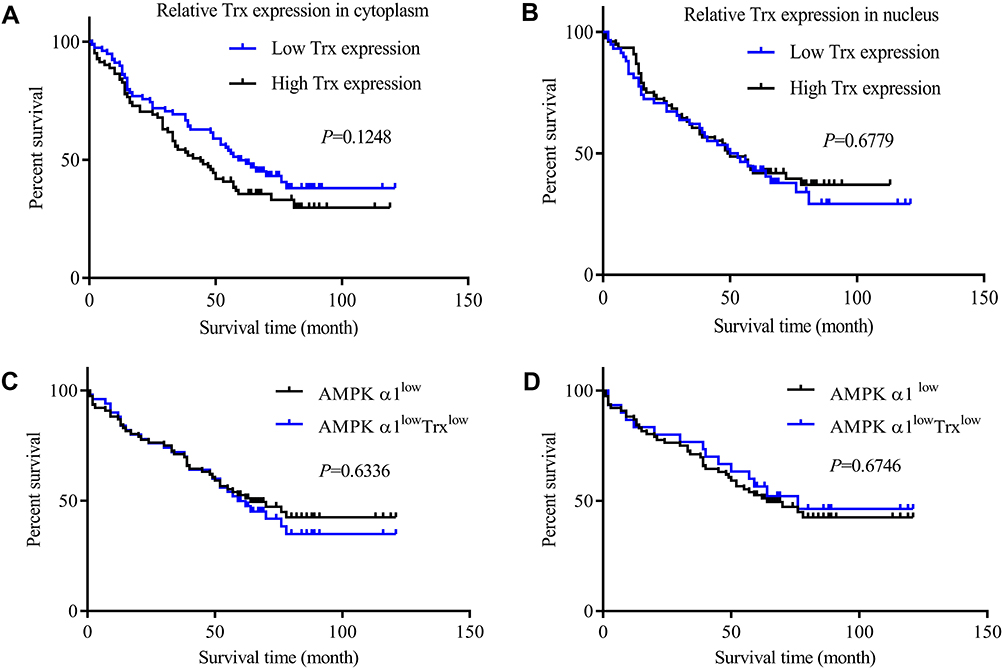 |
Figure 6 Kaplan–Meier curves for overall survival of NSCLC patients according to Trx expressions. (A) The correlation between cytoplasm Trx expression levels and prognosis. 159 patients were divided into two groups based on geometric mean (GM=9.48) of IHC staining score of Trx. There were 78 patients with low Trx expression and 81 patients with high Trx expression. Trx expression variances had no obvious correlation with prognosis in NSCLC patients. (B) The correlation between nucleus Trx expression levels and prognosis. The geometric mean (GM=3.79) of IHC staining score of Trx was acted as the threshold value to divide the 134 NSCLC patients into two groups; there were 58 patients with low Trx expression and 76 patients with high Trx expression. Trx expression variances in nucleus had no association with prognosis for NSCLC patients. (C) Combine AMPK α1 expression with cytoplasm Trx expression to predict prognosis of NSCLC patients. The AMPK α1lowTrxlow NSCLC patients had no superior OS when compared with AMPK α1 low expressing patients (AMPK α1lowTrxlow n=50; AMPK α1low n=76; P=0.6336). (D) Combine AMPK α1 expression with nucleus Trx expression to predict prognosis of NSCLC patients. The AMPK α1lowTrxlow NSCLC patients showed no superior OS when compared with AMPK α1 low expressing patients (AMPK α1lowTrxlow n=30; AMPK α1low n=76; P=0.6746). |
In order to determine that if combining AMPK α1 with Trx could be more sensitive in predicting prognoses of NSCLC patients, we selected the patients who simultaneously lowly expressed AMPK α1 and Trx, however, there was no advantage in predicting NSCLC patients’ prognoses (Figure 6C, and D).
Discussion
AMPK is associated with tumours through regulation of cell growth, cell proliferation, invasion and epithelial mesenchymal transition (EMT).8 However, the role of AMPK in cancer initiation and progression is controversial and needs further exploration, because some researchers insisted that AMPK promoted cancer cells proliferation and migration,9,10 while other studies have manifested that AMPK functioned as a tumor suppressor and high AMPK expression associated with superior prognosis.11
Recently, the subunits of AMPK have been found had different clinical implications in cancer development, for instance, high expression of AMPK-β and -γ subunits were respectively correlated with mucinous and serous carcinomas in patients with ovarian cancer.12 The ability of proliferation and angiogenesis of cancer cells was obvious augmented upon AMPK α1 was deleted.13 AMPK α2 was positively correlated with prognosis in endometrioid carcinomas.12 Those findings suggest that each component of the AMPK molecule has different clinical implications in cancer development, the role and mechanism of each of the subunits should be explored separately.
The subunit α1 is the most important catalytic subunit of AMPK. AMPK α1 made pancreatic cancer cells tolerance to glucose deprivation.14 Through activating hTERT promoter15 or protecting cancer cells against genotoxic stress,16 AMPK α1 promoted cancer progression. Those researches suggested that AMPK α1 acted as an oncogene in cancer initiation and progression. In our study, through analyzing AMPK α1 expression levels and the association between AMPK α1 and prognosis as well as A549 cells’ proliferation ability, we identified the aggressiveness role of AMPK α1 in NSCLC. Conversely, AMPK α1 was reported acted as a tumor suppresser,17 deletion of AMPK α1 promoted cell proliferation and angiogenesis.13 The reported discrepancy of AMPK α1 in tumor development may be due to different experimental tumor cell lines and tissue systems, furthermore, the targets and related pathways of AMPK α1 also influenced its significance in tumors.
Thioredoxin (Trx), a ubiquitously expressed small molecule, possesses ability to diminish oxidative stress. Researchers found that Trx was regulated by AMPK.7,18 In our study, we found AMPK α1 positively correlated with Trx expression in NSCLC tissues; moreover, Trx was positively regulated by AMPK α1 in A549 cells. Considering that Trx could regulate plentiful biological processes and aberrant Trx expression associated with initiation and progression of tumors inevitably,19 the aggressiveness role of AMPK α1 in NSCLC may partially work through regulating Trx expression.
Reactive oxygen species (ROS) are continuously produced as a by-product of mitochondrial metabolism and eliminated via antioxidant systems.20 Through promoting the release of cytochrome c, THRA2 and AIF from mitochondria to cytoplasm, ROS enhanced caspase-dependent and -independent apoptosis.21 Considering that Trx is an anti-oxidant protein and highly expressed in NSCLC, aberrant expression of Trx may be one of the main reasons that why ROS is decreased in NSCLC.22 We found that AMPK α1 suppressed ROS levels, and decreased apoptosis activity was observed in LV-PRKAA1 A549 cells; meanwhile, our results indicated that Trx was regulated by AMPK α1. Based on the results, we suggest that AMPK α1 downregulates ROS levels through regulating Trx expression leading to apoptosis dysfunction in A549 cells.
Some researchers suggest that Trx is a promising target for cancer treatment.23 Trx was found overexpressed in cancers and associated with poor overall survival in cancer patients.24 In our study, we did find Trx was overexpressed in NSCLC cancer tissues when compared with adjacent non-tumor lung tissues; however, unanticipated finding was that no significant association was found between Trx expression and prognosis. Because of our small cohort of specimens, the significance of Trx in predicting prognoses of NSCLC patients needed to be further explored.
In this study, we established the potential role and mechanism of AMPK α1 in NSCLC. However, there are some limitations in this study. At first, only A549 cell line was used in this study. Second, relatively small number of specimens and short follow-up period may have attenuated the statistical power of the study and affected survival analyses. Last but not the least, we have not explored the mechanism of AMPK α1 in regulating Trx expression.
In summary, we found that AMPK α1 was highly expressed in NSCLC tissues and significantly correlated with poor prognosis in NSCLC patients. AMPK α1 promoted lung cancer A549 cell proliferation. AMPK α1 downregulated ROS levels through regulating Trx expression leading to apoptosis dysfunction in A549 cells.
Conclusion
These exploratory findings, which need to be further validated in vitro and in vivo, suggest that AMPK α1 should be considered as a potential prognostic biomarker and therapeutic target in NSCLC.
Data Sharing Statement
The datasets used during the current study are available from the corresponding author on reasonable request.
Ethical Approval of the Study Protocol
The present study was approved by the Ethics Committee of Northern People’s Hospital (Jiangsu, China). Written informed consent was obtained from all the participants.
Disclosure
The authors have no financial interest or other conflict of interest.
References
1. Ferlay J, Soerjomataram I, Dikshit R, et al. Cancer incidence and mortality worldwide: sources, methods and major patterns in GLOBOCAN 2012. Int J Cancer. 2015;136:E359–E386. doi:10.1002/ijc.29210
2. Tsoi KK, Hirai HW, Chan FC, et al. Cancer burden with ageing population in urban regions in China: projection on cancer registry data from World Health Organization. Br Med Bull. 2017;121:83–94. doi:10.1093/bmb/ldw050
3. Rosso T, Bertuccio P, La Vecchia C, et al. Cancer mortality trend analysis in Italy, 1980–2010, and predictions for 2015. Tumori. 2015;101:664–675. doi:10.5301/tj.5000352
4. Bagcchi S. Lung cancer survival only increases by a small amount despite recent treatment advances. Lancet Respir Med. 2017;5:169. doi:10.1016/S2213-2600(17)30041-3
5. Jang M, Park R, Kim H, et al. AMPK contributes to autophagosome maturation and lysosomal fusion. Sci Rep. 2018;8:12637. doi:10.1038/s41598-018-30977-7
6. Song J, Seo Y. Park H: pinosylvin enhances leukemia cell death via down-regulation of AMPKalpha expression. Phytother Res. 2018;32:2097–2104. doi:10.1002/ptr.6156
7. Hou X, Song J, Li XN, et al. Metformin reduces intracellular reactive oxygen species levels by upregulating expression of the antioxidant thioredoxin via the AMPK-FOXO3 pathway. Biochem Biophys Res Commun. 2010;396:199–205. doi:10.1016/j.bbrc.2010.04.017
8. Cazarin JM, Coelho RG, Hecht F, et al. 5ʹ-AMP-activated protein kinase regulates papillary (TPC-1 and BCPAP) thyroid cancer cell survival, migration, invasion, and epithelial-to-mesenchymal transition. Thyroid. 2016;26:933–942. doi:10.1089/thy.2015.0440
9. Rios M, Foretz M, Viollet B, et al. AMPK activation by oncogenesis is required to maintain cancer cell proliferation in astrocytic tumors. Cancer Res. 2013;73:2628–2638. doi:10.1158/0008-5472.CAN-12-0861
10. Kim EK, Park JM, Lim S, et al. Activation of AMP-activated protein kinase is essential for lysophosphatidic acid-induced cell migration in ovarian cancer cells. J Biol Chem. 2011;286:24036–24045. doi:10.1074/jbc.M110.209908
11. Cheng J, Shuai X, Gao J, et al. Prognostic significance of AMPK in human malignancies: a meta-analysis. Oncotarget. 2016;7:75739–75748. doi:10.18632/oncotarget.12405
12. Li C, Liu VW, Chiu PM, et al. Over-expressions of AMPK subunits in ovarian carcinomas with significant clinical implications. BMC Cancer. 2012;12:357. doi:10.1186/1471-2407-12-357
13. Zhou Y, Xu H, Ding Y, et al. AMPKalpha1 deletion in fibroblasts promotes tumorigenesis in athymic nude mice by p52-mediated elevation of erythropoietin and CDK2. Oncotarget. 2016;7:53654–53667. doi:10.18632/oncotarget.10687
14. Kato K, Ogura T, Kishimoto A, et al. Critical roles of AMP-activated protein kinase in constitutive tolerance of cancer cells to nutrient deprivation and tumor formation. Oncogene. 2002;21:6082–6090. doi:10.1038/sj.onc.1205737
15. Jo D, Park R, Kim H, et al. AMP-activated protein kinase regulates the expression of human telomerase reverse transcriptase. PLoS One. 2018;13:e207864. doi:10.1371/journal.pone.0207864
16. Vara-Ciruelos D, Dandapani M, Gray A, et al. Genotoxic damage activates the AMPK-alpha1 isoform in the nucleus via ca(2+)/CaMKK2 signaling to enhance tumor cell survival. Mol Cancer Res. 2018;16:345–357. doi:10.1158/1541-7786.MCR-17-0323
17. Vara-Ciruelos D, Dandapani M, Russell FM, et al. Phenformin, but not metformin, delays development of T cell acute lymphoblastic leukemia/lymphoma via cell-autonomous AMPK activation. Cell Rep. 2019;27:690–698. doi:10.1016/j.celrep.2019.03.067
18. Li XN, Song J, Zhang L, et al. Activation of the AMPK-FOXO3 pathway reduces fatty acid-induced increase in intracellular reactive oxygen species by upregulating thioredoxin. Diabetes. 2009;58:2246–2257. doi:10.2337/db08-1512
19. Matsuzawa A. Thioredoxin and redox signaling: roles of the thioredoxin system in control of cell fate. Arch Biochem Biophys. 2017;617:101–105. doi:10.1016/j.abb.2016.09.011
20. Rabinovitch RC, Samborska B, Faubert B, et al. AMPK maintains cellular metabolic homeostasis through regulation of mitochondrial reactive oxygen species. Cell Rep. 2017;21:1–9. doi:10.1016/j.celrep.2017.09.026
21. Kaminskyy VO, Piskunova T, Zborovskaya IB, et al. Suppression of basal autophagy reduces lung cancer cell proliferation and enhances caspase-dependent and -independent apoptosis by stimulating ROS formation. Autophagy. 2012;8:1032–1044. doi:10.4161/auto.20123
22. He C, Rong R, Liu J, et al. Effects of Coptis extract combined with chemotherapeutic agents on ROS production, multidrug resistance, and cell growth in A549 human lung cancer cells. Chin Med. 2012;7:11. doi:10.1186/1749-8546-7-11
23. Jia JJ, Geng WS, Wang ZQ, et al. The role of thioredoxin system in cancer: strategy for cancer therapy. Cancer Chemother Pharmacol. 2019;84:453–470. doi:10.1007/s00280-019-03869-4
24. Bhatia M, McGrath KL, Di Trapani G, et al. The thioredoxin system in breast cancer cell invasion and migration. Redox Biol. 2016;8:68–78. doi:10.1016/j.redox.2015.12.004
 © 2020 The Author(s). This work is published and licensed by Dove Medical Press Limited. The
full terms of this license are available at https://www.dovepress.com/terms
and incorporate the Creative Commons Attribution
- Non Commercial (unported, 3.0) License.
By accessing the work you hereby accept the Terms. Non-commercial uses of the work are permitted
without any further permission from Dove Medical Press Limited, provided the work is properly
attributed. For permission for commercial use of this work, please see paragraphs 4.2 and 5 of our Terms.
© 2020 The Author(s). This work is published and licensed by Dove Medical Press Limited. The
full terms of this license are available at https://www.dovepress.com/terms
and incorporate the Creative Commons Attribution
- Non Commercial (unported, 3.0) License.
By accessing the work you hereby accept the Terms. Non-commercial uses of the work are permitted
without any further permission from Dove Medical Press Limited, provided the work is properly
attributed. For permission for commercial use of this work, please see paragraphs 4.2 and 5 of our Terms.