")
Back to Journals » Psychology Research and Behavior Management » Volume 11
Among substance-abusing traffic offenders, poor sleep and poor general health predict lower driving skills but not slower reaction times
Authors Abdoli N, Sadeghi Bahmani D , Farnia V, Alikhani M , Golshani S, Holsboer-Trachsler E, Brand S
Received 12 May 2018
Accepted for publication 25 June 2018
Published 9 November 2018 Volume 2018:11 Pages 557—566
DOI https://doi.org/10.2147/PRBM.S173946
Checked for plagiarism Yes
Review by Single anonymous peer review
Peer reviewer comments 3
Editor who approved publication: Dr Igor Elman
Nasrin Abdoli,1 Dena Sadeghi Bahmani,1–4 Vahid Farnia,1 Mostafa Alikhani,1 Sanobar Golshani,1 Edith Holsboer-Trachsler,2 Serge Brand1–5
1Substance Abuse Prevention Research Center, Kermanshah University of Medical Sciences, Kermanshah, Iran; 2Center for Affective, Stress and Sleep Disorders, Psychiatric Clinics, University of Basel, Basel, Switzerland; 3Kermanshah University of Medical Sciences, Sleep Disorders Research Center, Kermanshah, Iran; 4Isfahan Neurosciences Research Center, Alzahra Research Institute, Isfahan University of Medical Sciences, Isfahan, Iran; 5Division of Sport Science, and Psychosocial Health, Department of Sport, Exercise and Health, University of Basel, Basel, Switzerland
Background: Traffic accidents are a significant health issue in Iran. Explanations for such accidents have included single consideration of the role of poor sleep and negative psychological trait and state variables. In this study, we examined whether and to what extent sleep, general health, and aggression can concomitantly predict driving behavior.
Methods: A total of 360 male traffic offenders (driving under substance use; mean age: 31 years) participated in this study. They completed the questionnaires covering sociodemographic, sleep-related, and behavior-related variables. In addition, their visual and acoustic reaction times were objectively tested.
Results: Poor sleep, poor general health, and higher aggression scores were associated with self-rated poor driving behavior. Poor sleep was directly associated with poor driving behavior and indirectly via poor general health and aggression. In contrast, visual and acoustic reaction times were unrelated to sleep, general health, aggression, or self-rated driving behavior.
Conclusion: To our knowledge, this is the first study in Iran to assess concomitantly poor sleep, poor general health, and higher aggression scores as independent predictors of poor driving behavior among a larger sample of substance-abusing traffic offenders. Furthermore, visual and acoustic reaction times were unrelated to sleep, general health, aggression, and driving behavior. Finally, importantly, poor sleep predicted both directly and indirectly poor driving behavior.
Keywords: driving behavior, sleep, aggression, general health, reaction time
Introduction
In Iran, cars and motorcycles are the most common means of transport, and not surprisingly, compared with Western countries (North America and Europe), the traffic-related prevalence of mortality is high.1–3 Despite a decreasing trend in traffic-related deaths,4 traffic accidents remain the second largest cause of mortality in Iran.5,6 Although the World Health Organization reported 24.1 traffic deaths per 100,000 people every year in Iran, the prevalence rate is substantially lower in, for example, Switzerland (3.4), Germany (4.3), and USA (11.6). Furthermore, traffic accidents are the main cause of injuries requiring surgical intervention in Iran.7–9
There is a broad consensus that up to 95% of traffic accidents are not due to the technical malfunctions but due to the poor driving behavior. The three possible factors in poor driving behavior are as follows: 1) trait variables, 2) state variables, and 3) sleep.
As regards trait variables, a line of research has examined associations between particular personality traits and poor driving behavior.10–14 Lucida et al and Mallia et al10,11 identified excitement-seeking as a risk factor for poor driving, whereas Pourabdian and Azmoon14 focused on trait anxiety as a possible risk factor for poor driving. In contrast, Dahlen et al13 identified narcissism as a risk factor for poor driving, whereas Beanland et al12 considered the impact of antagonism, negative affectivity, and disinhibition. These approaches thus point to a particular constellation of personality traits as a source of poor driving behavior.
In addition, there is evidence that current psychological state and traits can have an impact on driving behavior. For example, Hilton et al15 showed that current self-reported symptoms of depression were associated with increased road accidents among professional heavy goods vehicle drivers. Importantly, these authors claimed that lack of concentration and poor sleep, rather than symptoms of depression as such, might have negative effects on driving behavior. Also, Scott-Parker et al16 identified symptoms of depression as predictors of risky behavior among novice drivers, while in a further analyses, the same authors concluded that symptoms of anxiety rather than depression predicted risky driving among female but not male novice drivers.
Aggression merits particular attention, given that aggressive behavior might be regarded both as a trait and as a state variable, and also that aggressive driving is acknowledged as a contributor to motor vehicle accidents. Not surprising, the Manchester Driving Behavior Questionnaire (MDBQ)17 explicitly includes aggressive reactions (ie, aggressive violations and ordinary violations) as factors adversely affecting driving. In this regard, Beanland et al12 reported an overlap between state aggression behavior and the personality traits of antagonism, negative affectivity, and disinhibition. Likewise, in a survey carried out in the UK and the Irish Republic, Stephens and Sullman18 identified trait aggression as a predictor of crash-related behaviors. Specifically, aggressive forms of expression were higher for drivers who reported initiating road rage incidents, and the total scores for aggressive expression were also higher for drivers who reported recent crash-related events, such as loss of concentration, losing control of their vehicle, moving violations, near-misses, and major crashes.18
Next, as regards mental health status, Possis et al19 showed that, among veterans, risky driving behavior and poor mental health status were associated with poor driving behavior. Furthermore, in previous studies,2,3 we have showed that, among both traffic offenders and non-offenders, poor mental health status was associated with both poor driving behavior and aggression, while aggression was also associated with poor driving behavior. However, when both poor health status and aggression were entered in a regression equation, only poor health status emerged as a predictor of poor driving behavior.
As regards sleep, there is an extensive literature showing that poor sleep is associated with various negative cognitive,20–23 emotional,23–25 social,26 and behavioral characteristics.27,28 Poor sleep is causally related to work place problems and work place absenteeism.29,30 In this context, not surprisingly, poor sleep is also associated with increased risks of traffic issues.31–37 Thus, it is estimated that 10%–20% of all traffic accidents are causally related to poor sleep.38 For example, Hilton et al15 identified, in addition to symptoms of depression, poor sleep as a risk factor for lack of concentration, which in turn impacted negatively on driving behavior. Likewise, Garbarino et al39 showed among 949 truck drivers that up to 28% suffered from insomnia; most dramatically, insomniacs had a markedly higher likelihood of reporting both accidents and near-miss accidents. Recently, Bioulac et al40 confirmed the association between poor sleep and poor driving behavior in their systematic review and meta-analysis. Thomann et al41 identified an explanation for this association in the impaired scores on psychomotor vigilance of people with excessive daytime sleepiness (due to poor night sleep) when compared with healthy controls. However, in their recent review of the associations between poor sleep and sleepiness on the one hand and objective reaction times on driving simulators on the other hand, Schreier et al42 found that the associations were trivial and that it was not sleepiness as such, but rather the self-perception of sleepiness that more reliably explained the association between poor sleep and poor driving behavior. Thus, Hallvig et al43 showed that performance on a driving simulator and real driving were only weakly related and that this association was further weakened after taking subjective sleepiness into account. Finally, based on a systematic review and meta-analysis, Tabrizi et al44 showed that up to 50% of all drivers in Iran reported sleep complaints.
To summarize, trait variables, state variables, and poor sleep need to be considered in explanations of poor driving behavior. In addition, we believe that investigating such associations is particularly important in Iran, given the evidence that fatal traffic accidents are from 5.5 to 7 times higher than those in countries such as Switzerland or Germany. Next, the relationship between performance on driving simulators and sleep is not straightforward, and the role of trait and state variables in this relationship has yet to be considered. Accordingly, this study aimed at shedding light on the association between subjective sleep patterns, driving behavior (both subjective and objective),1 and trait and state variables in a large sample of Iranian traffic offenders. In this context, we put particular emphasis on the direct and indirect associations between subjective sleep and driving behavior (subjective and objective) via their association with general health status; in our previous studies,2,3 it was proved that poor mental health status was related to poor driving behavior.
The following five hypotheses were formulated. First, we expected poor sleep, poor driving behavior, poor general health, and high aggression scores to be associated.2,3,12,15,18,44 Second, we anticipated that, compared with good sleepers, poor sleepers would report more impaired subjective driving behavior and have lower general health, higher aggression scores, and slower reaction times.31–37 Third, we predicted that poor driving behavior would be independently predicted by poor sleep, poor general health, and higher aggression scores.2,3,12,15,18 Fourth, we expected that poor sleep would predict poor driving behavior indirectly as well as directly. Finally, based on the studies by Schreier et al42 and Hallvig et al,43 we assumed that reaction time on a driving simulator as a proxy for objective driving behavior would not be related to subjective driving behavior or to psychological functioning (general health, subjective sleep, and aggression).
Methods
Procedures
Substance-abusing male traffic offenders undergoing a thorough driving-related assessment took part in the present cross-sectional study. Although the assessment was mandatory for all traffic offenders as a consequence of violating traffic rules under the influence of psychotropic substances, taking part in this study and providing data for scientific ends were not mandatory. Accordingly, all eligible participants were informed about the aim of this study and the anonymous data handling. Thereafter, they signed a written informed consent. Participants came once to our research center, and all assessments took place in the late morning during 11 am and 2 pm. The first part of the assessment lasted for about 20 minutes, which includes the following: study information, signing the written informed consent, and completing the self-rating questionnaires. The second part lasted for about 15 minutes, which includes the following: measuring auditory and visual reaction time (see details below). Collectively, the entire assessment including welcome and discharge lasted for about 45 minutes. Data collection took place between June 2016 and April 2017. The review board of the Kermanshah University of Medical Sciences (KUMS; Kermanshah, Iran) approved the study, which was performed in accordance with the rules laid down in the Declaration of Helsinki and its later amendments.
Sample
A total of 485 substance-abusing male traffic offenders, whose driving license had been withdrawn, were approached; of whom, 360 (74.23%; mean age: 30.97 years; SD=9.51) agreed to participate in this study. After a brief somatic and psychiatric interview, and based on medical records and records from the penalty register of the traffic authorities, psychiatrists or clinical psychologists identified substance abuse as the main mental illness. Eighty-five percent of the participants were opium/opioid users, 13% were methamphetamine users, and 3% were alcohol and cannabis users. Seventy-three percent of the participants had car crashes and 27% had accidents with motor cycles. Inclusion criteria were as follows: 1) age 18 years or older; 2) male; 3) written informed consent; 4) willing and able to complete self-rating questionnaires; and 5) willing and able to undergo reaction time testing. Exclusion criteria were as follows: 1) current state of suicidality and 2) current state of psychosis.
Tools
Sociodemographic and driver-related information
This questionnaire asked for gender, age (years), highest educational level (primary school, high school, diploma, and university degree), civil status (single, married, and divorced/widowed), and years of driving experience.
Driving behavior
Participants completed the MDBQ.17,45,46 The MDBQ is a self-rating questionnaire consisting of 50 items measuring aberrant driving behaviors and focuses on aggressive violations (eg, “Sound your horn to indicate your annoyance to another road user”; “Become angered by another driver and give chase with the intention of giving him/her a piece of your mind”), ordinary violations (eg, “Disregard the speed limit on a residential road/motor way”; “Overtake a slow driver on the inside”; and “I drive so close to the car in front that it would be difficult to stop in an emergency”), errors (eg, “Underestimate the speed of an oncoming vehicle when overtaking”; “Fail to check your rear-view mirror before pulling out, changing lanes, etc.”), and lapses (eg, “Attempt to drive away from the traffic lights in third gear”; “Forget where you left your car in a car park”; and “Intending to drive to destination A, you ‘wake up’ to find yourself on the road to destination B”). Responses are given on six-point Likert scales ranging from 0 (= never) to 5 (= nearly all the time), with higher mean scores reflecting more numerous violations, errors, and lapses (Cronbach’s alpha =0.89).
General health
Participants completed the General Health Questionnaire (GHQ;47 Farsi version48). The GHQ is a self-rating questionnaire to identify psychological distress. It consists of 28 items and assesses anxiety and insomnia, depression, social dysfunction, and somatic health. Answers are given on four-point Likert scales ranging from 0 (= not at all) to 3 (= more than usual), with higher total scores reflecting more severe health issues (Cronbach’s alpha =0.91).
Aggression
Participants completed the Aggression Questionnaire (AGQ;49 Farsi version2,3). The AGQ is a self-rating questionnaire; it consists of 29 items and covers physical aggression, verbal aggression, anger, and hostility. Answers are given on seven-point Likert scales ranging from 1 (= extremely uncharacteristic of me) to 7 (= extremely characteristic of me), with higher scores reflecting a greater tendency toward aggressive behavior (Cronbach’s alpha =0.90).
Pittsburgh Sleep Quality Index (PSQI)
Subjective sleep: PSQI
The PSQI was designed by Buysse et al50 to measure sleep quality and to help diagnose people with good or poor sleep. The PSQI is a self-report scale that takes 5 minutes to complete; it consists of 19 items and contains seven subscales (subjective sleep quality, sleep latency, sleep duration, sleep efficiency, sleep disturbance, sleeping medication, and daytime dysfunction), each weighted equally on a scale from 0 to 3, with higher scores indicating poorer sleep quality. The seven components are then summed to obtain an overall PSQI score, ranging from 0 (good sleep quality) to 21 (poor sleep quality). Total scores of ≥5 reflect poor sleep, associated with considerable sleep complaints. The psychometric properties of the Farsi/Persian version were tested by Farrahi et al,51 with a sample of adult psychiatric patients and healthy controls.
Measuring auditory and visual reaction time
To measure the reaction time to auditory, visual and combined auditory–visual stimuli, participants underwent testing on a driving simulator. The apparatus mimicked the equipment of the driver’s position in a car, consisting of a seat, wheel, three pedals (brake, accelerator, and clutch), handbrake, gear shift, and direction indicator control. In addition, a screen and a loudspeaker were positioned in front of the participant. The tasks were as follows: on the screen, a virtual roadway was presented, suggesting continuous driving. At random, visual or acoustic stimuli were presented, and at these points, participants had to use the brakes. The outcome variable was the time lapse between the stimulus and the behavioral reaction (brakes). Two sets of 30 random stimuli were presented, reaction time was automatically recorded, and the average reaction time in milliseconds was calculated. The entire test lasted for about 15 minutes.
Statistical analysis
Preliminary calculations: first, we calculated whether educational level, civil status, age, or driving experience systematically changed the pattern of results. It turned out that neither civil status nor educational level had any effect. However, lower age was associated with higher aggression scores, while longer driving experience was associated with better driving behavior.
Main calculations: first, correlations were computed between sleep patterns (PSQI: subjective sleep quality, sleep duration, sleep latency, sleep efficacy, sleep disturbances, sleep medication, daytime dysfunction; overall score), driving behavior (MDBQ: overall score), general health (GHQ:2 overall score), aggression (overall score), and reaction times (auditory, visual, and visual–auditory stimuli). Second, t-tests for unrelated samples were carried out with the PSQI cutoff score of less than five points (no sleep disturbances) or five and higher points (sleep disturbances) as independent variables and driving behavior, general health, aggression, and reaction time as dependent variables. Third, a multiple regression analysis (stepwise; backward) was performed with the MDBQ total score as a dependent variable, and subjective sleep, general health, and aggression as predictors. Fourth, a path analysis was executed, again with the MDBQ total score as a dependent variable; we tested the direct effects of sleep on driving behavior and indirect effects via general health. The nominal level of statistical significance was set at alpha <0.05. Statistical computations were performed with SPSS® 25.0 (IBM Corporation, Armonk, NY, USA) for Apple® Mac®.
Results
Sociodemographic and driving-related information
Table 1 reports the descriptive sociodemographic and driving-related information.
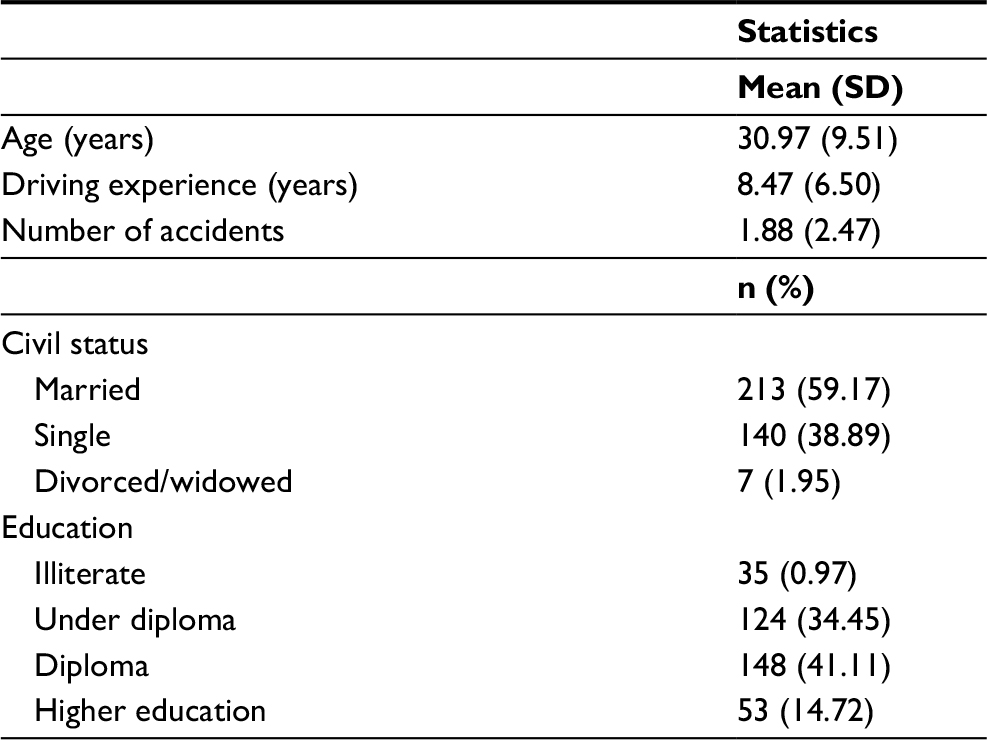 | Table 1 Descriptive statistical overview of sociodemographic information (N=360) |
Associations between sleep patterns, driving behavior, general health, and aggression
Table 2 reports the correlations between sleep patterns, general health, aggression, and driving behavior. Sleep, driving behavior, general health, and aggression scores were significantly associated, while this was not the case for reaction times.
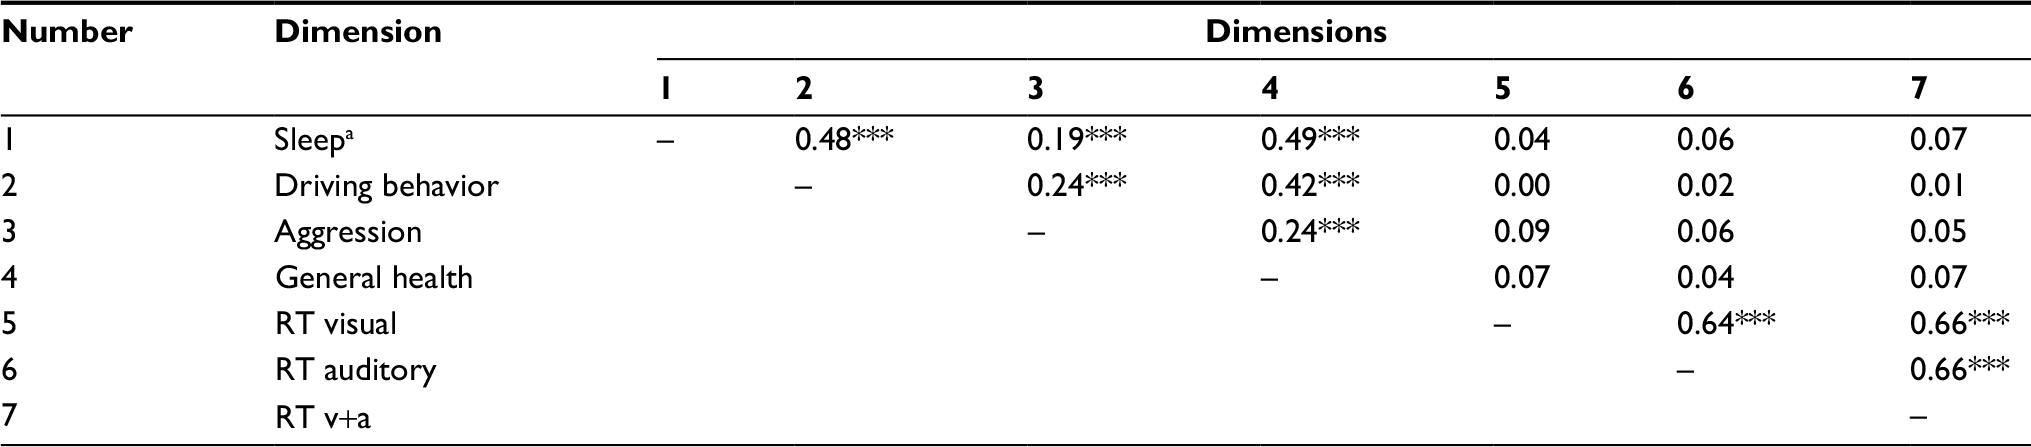 | Table 2 Overview of correlation coefficients (Pearson’s correlation coefficients) between dimensions of sleep, driving behavior, aggression, general health, and objective reaction time Note: aHigher scores in the Pittsburgh Sleep Quality Index reflect higher sleep disturbances. ***P<0.001. Abbreviations: RT, reaction time; v+a, visual and auditory. |
More specifically, all dimensions of negative PSQI scores (total score, sleep quality, sleep latency, sleep duration, sleep efficacy, sleep disturbances, sleep medication, and daytime functioning) were associated with poorer driving behavior (MDBQ), higher aggression, and poorer general health (Table 3).
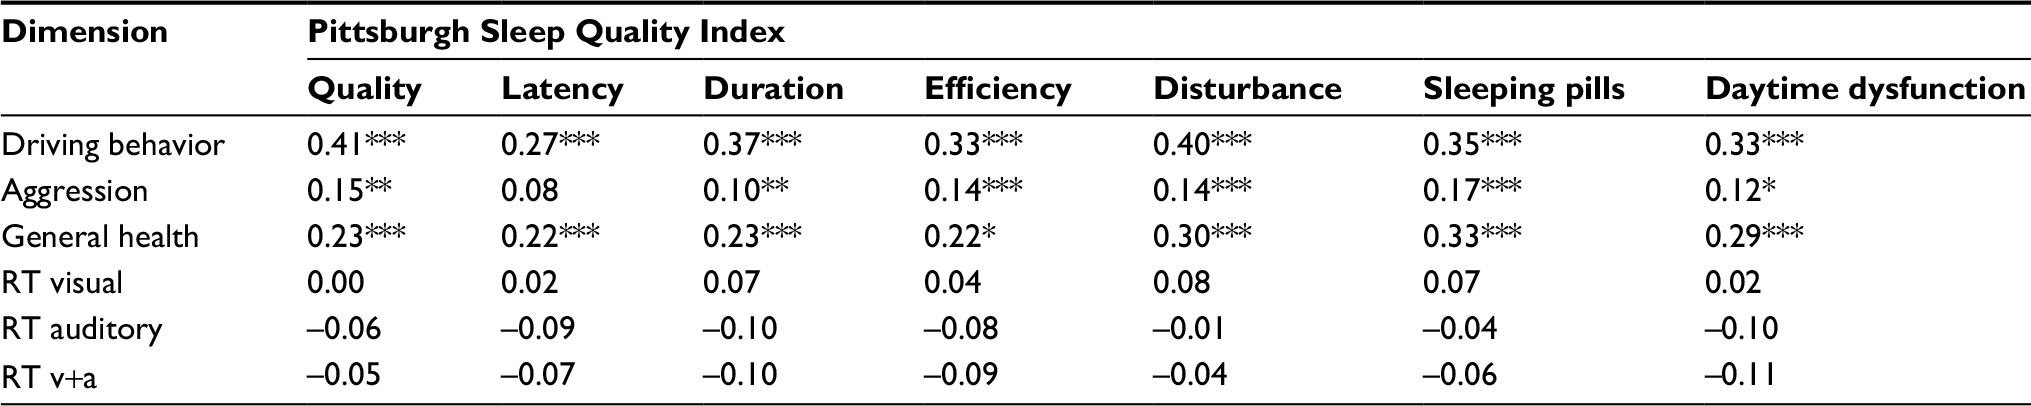 | Table 3 Overview of correlation coefficients (Pearson’s correlation coefficients) between dimensions of sleep (Pittsburgh Sleep Quality Index) and driving behavior, aggression, general health, and objective reaction time Note: *P<0.05; **P<0.01; and ***P<0.001. Abbreviations: RT, reaction time; v+a, visual and auditory. |
Driving behavior, general health, and aggression between participants with and without sleep disturbances
Table 4 reports the descriptive and inferential statistical indices comparing participants with (PSQI scores ≥5 points) and without sleep disturbances (PSQI scores <5 points). Compared to those without sleep complaints (n=21; 5.8%), participants with sleep complaints (n=339; 94.2%) reported poorer driving behavior, poorer general health, and higher aggression scores. No differences were found for reaction times.
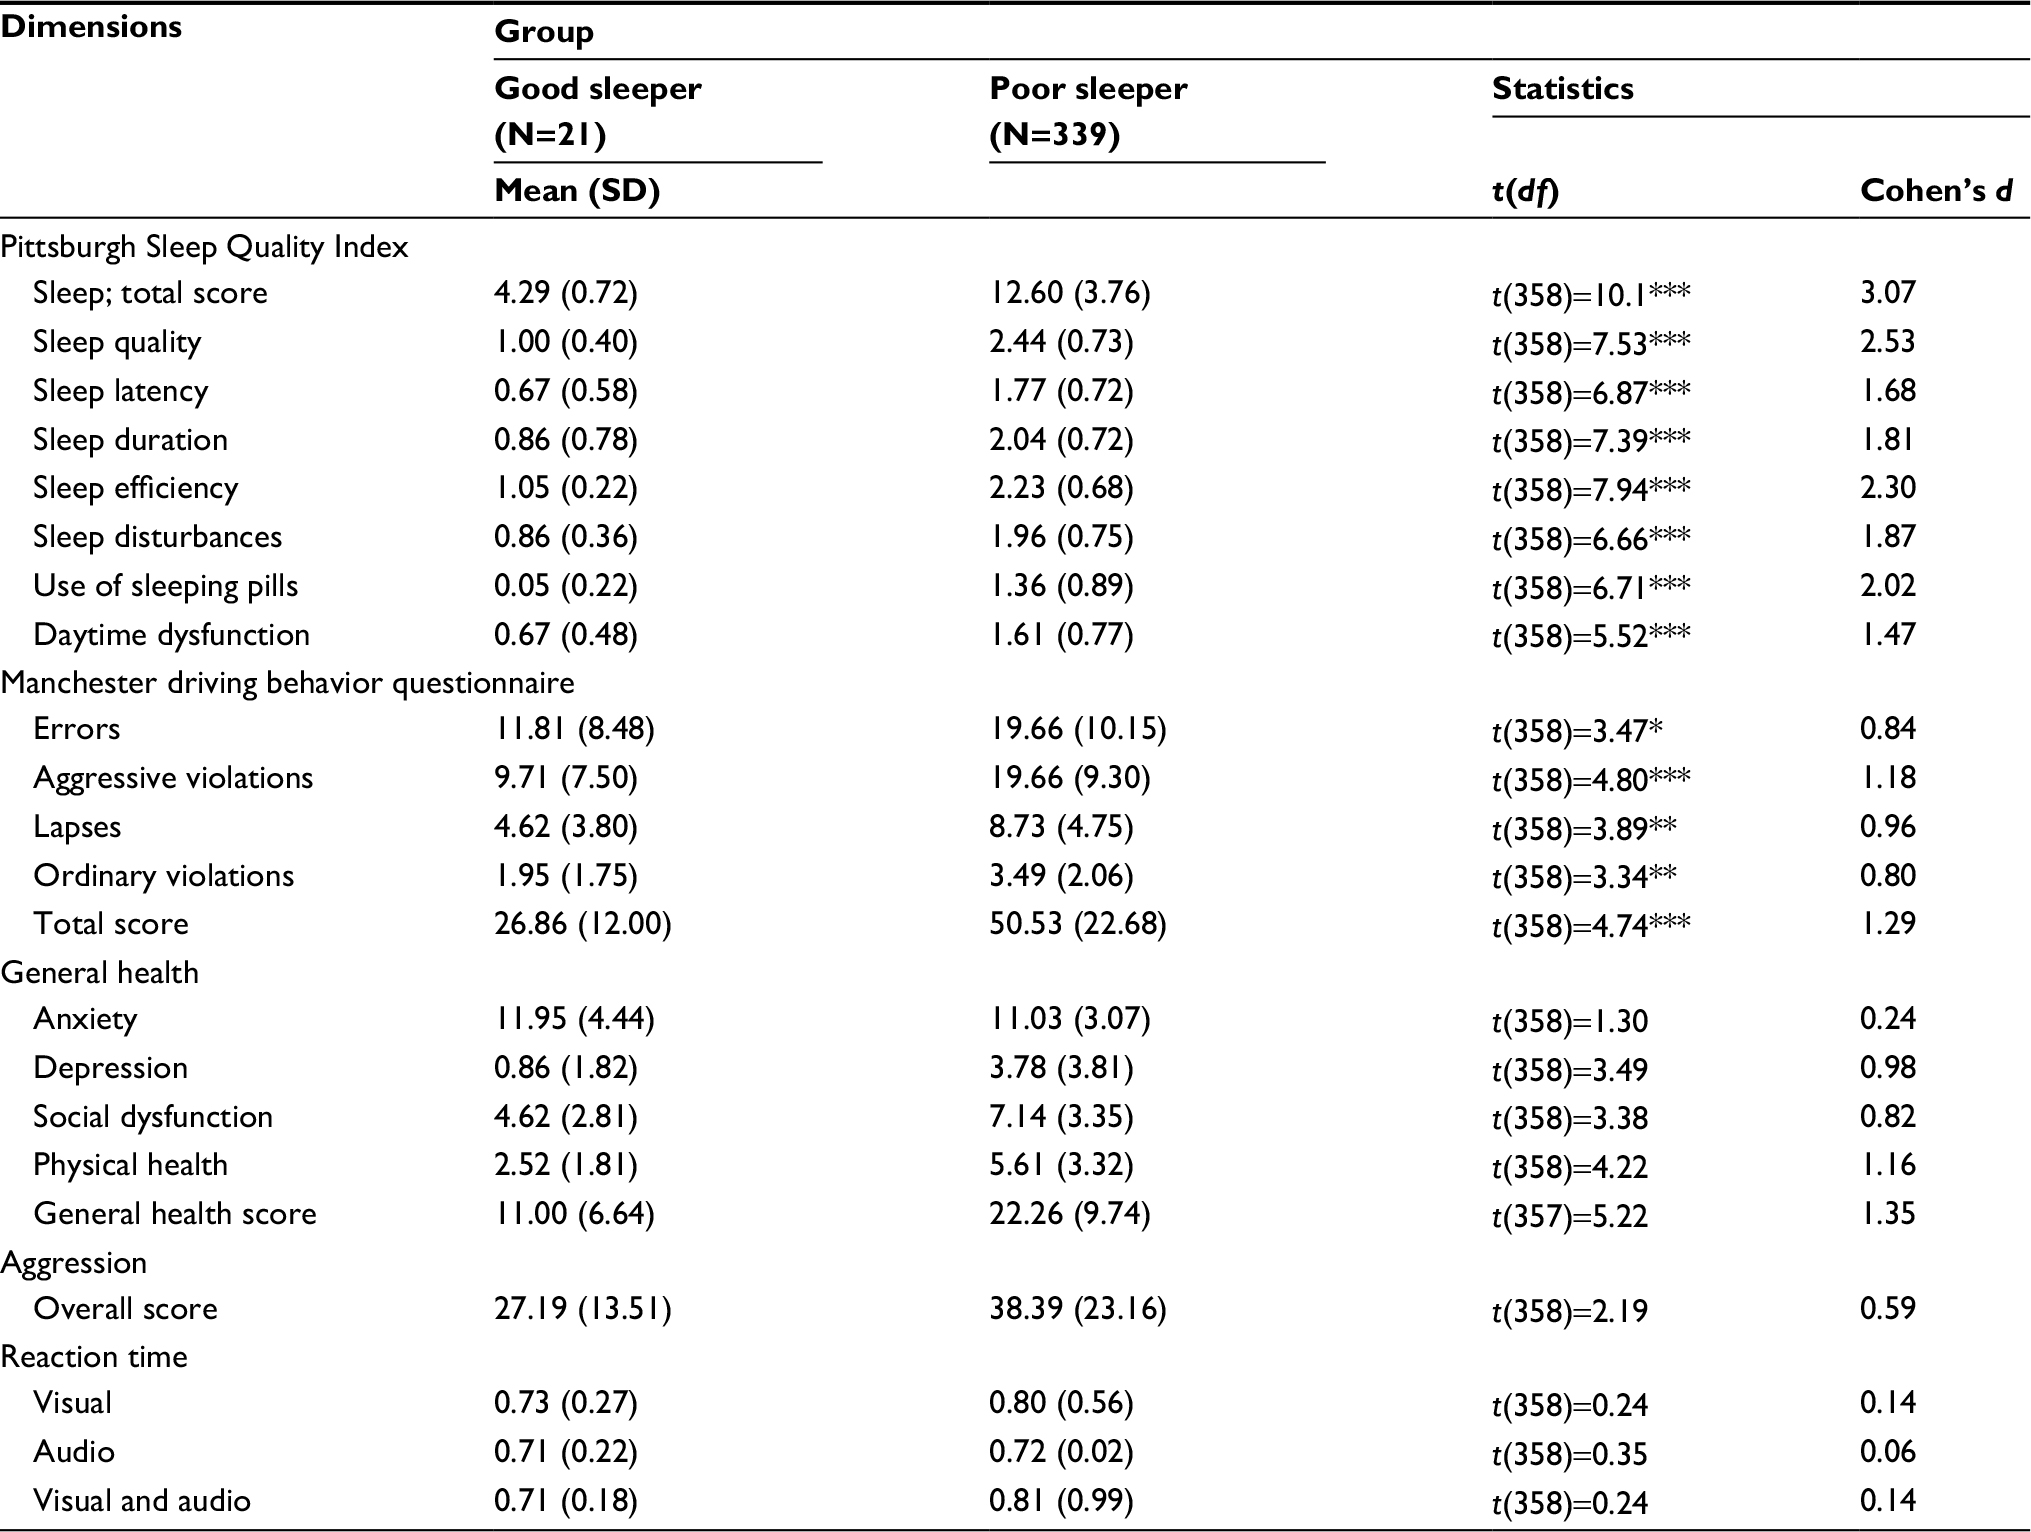 | Table 4 Descriptive and inferential statistical indices of sleep, driving behavior, aggression, and general health between poor and good sleepers Note: *P<0.05; **P<0.01; and ***P<0.001. |
Predicting driving behavior from sleep, general health, and aggression
A multiple regression analysis (stepwise backward; Table 5) was performed. Driving behavior was the dependent variable; sleep, general health, and aggression were predictors. Poor sleep and poor general health predicted poor driving behavior, while aggression did not reach statistical significance; aggression was therefore not entered in the equation.
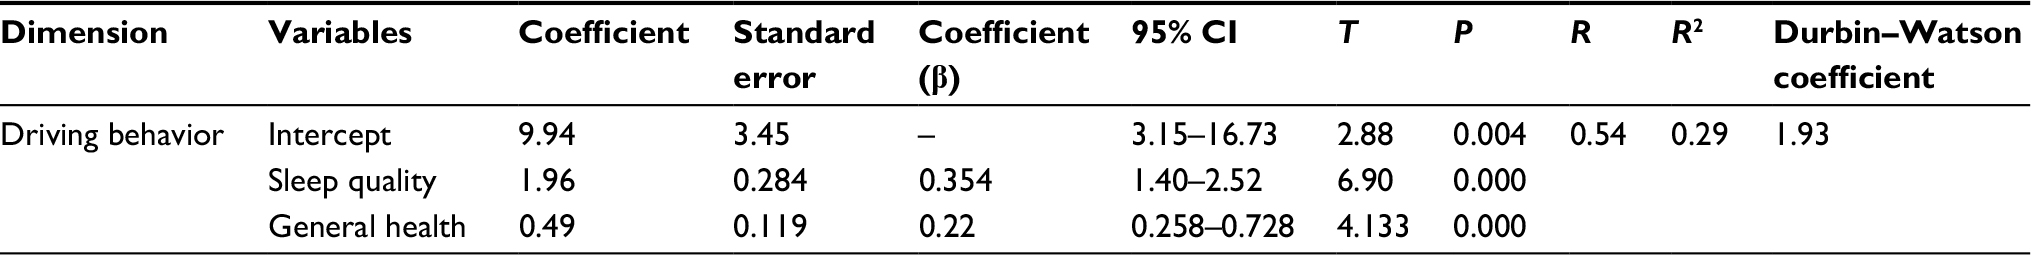 | Table 5 Multiple linear regression model to describe the influence of sleep quality, general health, and aggression on driving behavior Note: Variable excluded from the equation: aggression P>0.20. |
Direct and indirect effects of sleep on driving behavior, with general health as a mediating variable
As shown in Figure 1, sleep had both direct effects on driving behavior and indirect effects via general health. The equation is as follows: r=0.483 (r sleep and driving) = β=0.367 (sleep on driving) +0.485 (r sleep and general health) × β=0.23 (general health on driving).
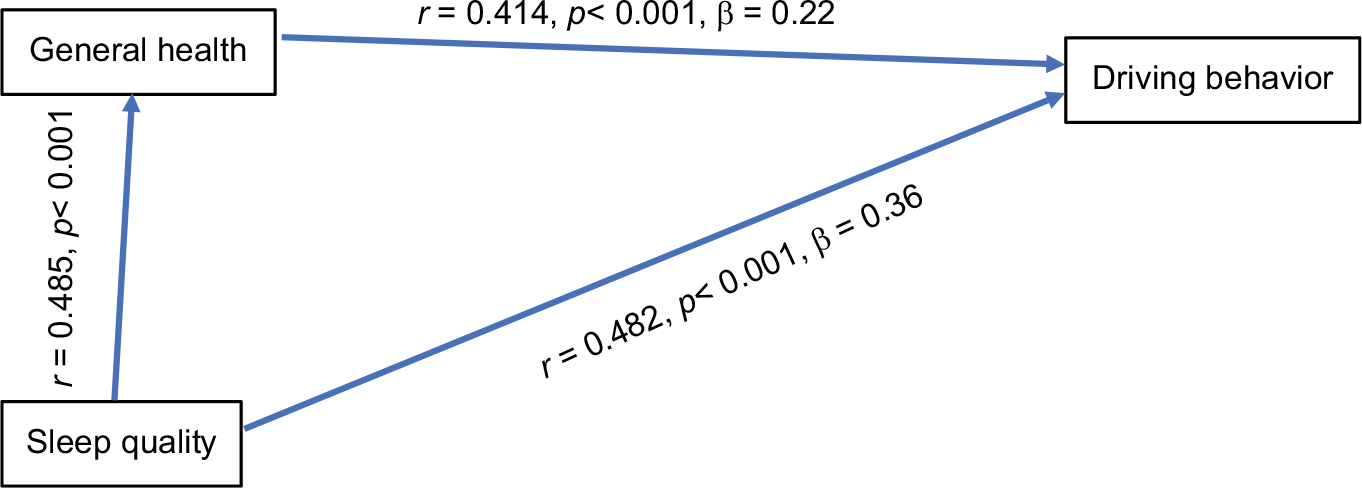 | Figure 1 Direct and indirect effects of sleep quality on driving behavior. |
Post-hoc analyses
Neither the type of substance use (opium/opioids, methamphetamine, cannabis) nor the type of accident (car or motor cycle) was systematically related to psychological functioning, sleep, and reaction time (all Fs<1.0, ps>0.43).
Discussion
The key findings of this study were that among a sample of male traffic offenders guilty of substance abuse, poor sleep was both directly and indirectly associated with poor subjective driving behavior, but not with objective reaction time. Poor sleepers also recorded higher scores for state variables such as depression, anxiety, and aggression. The pattern of results adds to the current literature in showing that poor sleep was both directly and indirectly associated with poor driving behavior. However, reaction times on a driving simulator were not associated with subjective sleep, psychological state, or subjective driving behavior.
Five hypotheses were formulated, and each of them is considered now in turn.
Our first hypothesis was that poor sleep, poor driving behavior, poor general health, and higher aggression scores would be associated, and this was confirmed. The pattern of results is therefore consistent with previous findings,2,3,12,15,18,44 although we believe that these results add to previous findings in that the associations were found among young Iranian males guilty of traffic offences related to substance abuse. A further novelty of this study is that the triad of trait (aggression), state (depression and anxiety), and sleep were found to contribute to the explanation of poor subjective driving behavior (Table 3). Moreover, more negative scores on all dimensions of the PSQI (overall score, sleep duration, sleep quality, sleep onset latency, sleep efficiency, sleep medication, and daytime functioning) were associated with poorer driving (MDBQ), higher aggression scores, and poorer general health (Table 3). These patterns of results suggest that it is not a single facet of sleep such as duration, efficacy, or sleep onset latency, but sleep as an overarching phenomenon that is related to poor driving behavior. Consequently, we believe that interventions to treat sleep problems might have a positive impact on driving performance, along with benefits for general health and aggression (as a proxy for impulse control).
Our second hypothesis was that, compared to good sleepers, poor sleepers would have more impaired subjective driving behavior, lower general health, and higher aggression scores, and again this was confirmed (Table 4). Thus, the present results accord well with the majority of the literature on this topic.31–37 The novel feature of the study is that these results were obtained from a sample of young Iranian males committing traffic offenses related to substance abuse and that poor sleep (n=339; 94.2% vs good sleep: n=21; 5.8%) is clearly a health problem among traffic offenders.
To gain a deeper insight into the associations between driving behavior, sleep, general health, and aggression, with the third hypothesis, we examined the extent to which poor driving behavior was independently predicted by poor sleep, poor general health, and aggression. The results here were not entirely clear-cut (Table 5). Specifically, while poor sleep and poor general health explained 29% of the variance in poor driving behavior (Table 5), the relative contribution of aggression as an additional predictor did not reach statistical significance and thus did not add to our understanding of poor driving behavior.
Fourth, given the impact of sleep quality on driving behavior, and given the relationship between sleep and general health, we hypothesized that poor sleep would predict poor driving behavior indirectly as well as directly, and this hypothesis was supported (Figure 1). Thus, we add to the current literature2,3,12,15,18 in an important way, confirming the prominent role of sleep in driving behavior.
The data available in this study are insufficient to provide a deeper psychological or neurophysiological explanation as to why poor sleep should be associated with poor driving behavior. The following speculations therefore draw upon previous research. First, Riemann et al52 with their hyperarousal model proposed an interactional and dynamic relationship between (dysfunctional) cognitive–emotional and physiological processes, leading to poor sleep and distressed behavior. It therefore seems possible that the experience of problems related to poor sleep could be related to problems in concentration and impulse control, leading ultimately to poorer driving behavior.15 Second, we note that dysfunctional coping strategies are associated with impaired sleep,53–55 and therefore, the link between poor sleep and poor driving behavior may be mediated in this way. Third, another theoretical and empirical approach focuses on the importance of prefrontal activity (PFC) and its impairment during poor quality sleep. Yoo et al56 performed imaging studies with adults suffering from insomnia and healthy controls. They found that under sleep restriction the amygdala displayed dramatically increased neuronal activation and responsiveness to negative emotional stimuli, which, most importantly, suggests a decrease in top-down, prefrontal control. Yoo et al speculated that “a night of sleep seems to ‘reset’ the correct brain reactivity to next-day emotional challenges by maintaining functional integrity of this amygdala circuit, and thus govern appropriate behavioral repertoires”.56 Therefore, the effect of sleep quality on PFC control might account for the link we found between sleep and driving behavior.
Our last hypothesis followed Schreier et al42 and Hallvig et al43 in anticipating that the objective reaction time on a driving simulator as a proxy of objective driving behavior would not be related to subjective driving behavior or to psychological functioning (general health, subjective sleep, and aggression), and this expectation was supported. While the lack of association between sleep patterns and objective reaction time does not accord with the findings from numerous studies on the relationship between poor sleep and poor cognitive performance,20–23 there is also an absence of explanations as to why this association might not be found. One possible explanation is that, while previous studies have focused on the effect of longer-term sleep deprivation on long-term cognitive performance20,22 or of experimentally manipulated sleep restriction on specific cognitive tasks such as divergent thinking,23 none of these studies took into account possible motivational factors in completing a cognitive task. We believe that participant motivation was critical in this study. Participants knew that their performance on the driving simulator could have an impact on the authorities’ decision to release or not to release their driving licenses in the near future. Thus, participants may have been particularly concerned to perform well. Second, being tested on a driving simulator might have had the character of an exciting and thrilling game, thus increasing participants’ arousal. Third, we know from studies on the cognitive performance of patients with Restless Legs Syndrome (RLS) that, despite their seriously impaired sleep quality, their performance on cognitive tests was not necessarily lower and could even be higher57 than that of healthy controls,58–60 but for contrary findings see, for instance, Fulda et al.61,62 To explain the lack of poorer cognitive performance among patients with RLS, Gamaldo et al57 speculated that these patients might have undergone a process of sleep loss adaptation. That is to say, despite their relative loss of sleep, they are able to produce proficient cognitive performances when necessary. The Iranian traffic offenders in this study may have undergone a similar sleep loss adaptation, apparent when tested under challenging and perhaps motivating conditions. Fourth, it is also conceivable that further latent but unassessed psychological or physiological processes might have biased the association between subjective sleep and reaction time on the driving simulator.
Despite the novelty of the findings, the following limitations warrant against overgeneralization of the findings. First, we only assessed relatively young male participants who were prosecuted by the authorities because they were driving while under influence of psychotropic substances. Thus, the present pattern of results may not generalize to female drivers, to Iranian drivers undergoing driving tests to obtain an international driving license, or, for example, to the elderly. Second, although a brief medical and psychiatric screening was performed to exclude acute suicidality and psychotic states, we did rely entirely on self-reports to assess psychological functioning (general health and aggression). A systematic bias due to self-ratings cannot therefore be excluded. Third, we also relied upon self-ratings to assess sleep quality. Actigraphs, for example, would have allowed a more objective estimation of sleep continuity. However, we also note that self-report measures of sleep characteristics are the gold standard for assessing sleep among large samples.63 Fourth, as already noted, it is also conceivable that further latent but unassessed neurophysiological and psychological dimensions might have biased two or more variables in the same or opposite direction. Fifth, the cross-sectional design of the study means that it is unable to shed light on the causal relationships between sleep, psychological functioning, driving behavior, and reaction time on the driving simulator. Finally, to estimate whether and to what extent the present pattern of results is unique for the present sample, it would be interesting to compare the present data with other samples such as both healthy male and female drivers without traffic violations.
Conclusion
To our knowledge, this is the first study in Iran to assess concomitantly poor sleep, poor general health, and higher aggression scores as independent predictors of poor driving behavior among a larger sample of substance-abusing traffic offenders. Furthermore, visual and acoustic reaction times were unrelated to sleep, general health, aggression, and driving behavior, putting into question, whether and to what extent objective visual and acoustic reaction times might be suitable to estimate the participants’ driving quality. Finally, importantly, poor sleep predicted both directly and indirectly poor driving behavior.
Acknowledgments
The authors thank Nick Emler (University of Surrey, Surrey UK) for proofreading the manuscript. The entire study was performed without external funding.
Disclosure
The authors report no conflicts of interest in this work.
References
Moradi S, Khademi A. Survey of victims of car accidents year 1387. J Forensic Med. (Persian) 2009;15:21–28. | ||
Abdoli N, Farnia V, Delavar A, et al. Mental health status, aggression, and poor driving distinguish traffic offenders from non-offenders but health status predicts driving behavior in both groups. Neuropsychiatr Dis Treat. 2015;11:2063–2070. | ||
Abdoli N, Farnia V, Delavar A, et al. Poor mental health status and aggression are associated with poor driving behavior among male traffic offenders. Neuropsychiatr Dis Treat. 2015;11:2071–2078. | ||
Hamzeh B, Najafi F, Karamimatin B, Ahmadijouybari T, Salari A, Moradinazar M. Epidemiology of traffic crash mortality in west of Iran in a 9 year period. Chin J Traumatol. 2016;19(2):70–74. | ||
Montazeri A. Road-traffic-related mortality in Iran: a descriptive study. Public Health. 2004;118(2):110–113. | ||
Zangooei Dovom H, Shafahi Y, Zangooei Dovom M. Fatal accident distribution by age, gender and head injury, and death probability at accident scene in Mashhad, Iran, 2006-2009. Int J Inj Contr Saf Promot. 2013;20(2):121–133. | ||
Zargar M, Khaji A, Karbakhsh M, Zarei MR. Epidemiology study of facial injuries during a 13 month of trauma registry in Tehran. Indian J Med Sci. 2004;58(3):109–114. | ||
Motamedi MH, Dadgar E, Ebrahimi A, Shirani G, Haghighat A, Jamalpour MR. Pattern of maxillofacial fractures: a 5-year analysis of 8,818 patients. J Trauma Acute Care Surg. 2014;77(4):630–634. | ||
Mohajerani SH, Asghari S. Pattern of mid-facial fractures in Tehran. Iran Dent Traumatol. 2011;27(2):131–134. | ||
Lucidi F, Mallia L, Lazuras L, Violani C. Personality and attitudes as predictors of risky driving among older drivers. Accid Anal Prev. 2014;72:318–324. | ||
Mallia L, Lazuras L, Violani C, Lucidi F. Crash risk and aberrant driving behaviors among bus drivers: the role of personality and attitudes towards traffic safety. Accid Anal Prev. 2015;79:145–151. | ||
Beanland V, Sellbom M, Johnson AK. Personality domains and traits that predict self-reported aberrant driving behaviours in a southeastern US university sample. Accid Anal Prev. 2014;72:184–192. | ||
Dahlen ER, Edwards BD, Tubré T, Zyphur MJ, Warren CR. Taking a look behind the wheel: an investigation into the personality predictors of aggressive driving. Accid Anal Prev. 2012;45:1–9. | ||
Pourabdian S, Azmoon H. The relationship between trait anxiety and driving behavior with regard to self-reported Iranian accident involving drivers. Int J Prev Med. 2013;4(10):1115–1121. | ||
Hilton MF, Staddon Z, Sheridan J, Whiteford HA. The impact of mental health symptoms on heavy goods vehicle drivers’ performance. Accid Anal Prev. 2009;41(3):453–461. | ||
Scott-Parker B, Watson B, King MJ, Hyde MK. A further exploration of sensation seeking propensity, reward sensitivity, depression, anxiety, and the risky behaviour of young novice drivers in a structural equation model. Accid Analysis Prevention. 2013;50:465–471. | ||
Reason J, Manstead A, Stradling S, Baxter J, Campbell K. Errors and violations on the roads: a real distinction? Ergonomics. 1990;33(10–11):1315–1332. | ||
Stephens AN, Sullman MJM. Trait predictors of aggression and crash-related behaviors across drivers from the United Kingdom and the Irish Republic. Risk Analysis. 2015;35(9):1730–1745. | ||
Possis E, Bui T, Gavian M, et al. Driving difficulties among military veterans: clinical needs and current intervention status. Mil Med. 2014;179(6):633–639. | ||
Curcio G, Ferrara M, Degennaro L, Loss S. Sleep loss, learning capacity and academic performance. Sleep Med Rev. 2006;10(5):323–337. | ||
van Dongen HPA, Maislin G, Mullington JM, Dinges DF. The cumulative cost of additional wakefulness: dose-response effects on neurobehavioral functions and sleep physiology from chronic sleep restriction and total sleep deprivation. Sleep. 2003;26(2):117–126. | ||
Killgore WD. Effects of sleep deprivation on cognition. Prog Brain Res. 2010;185:105–129. | ||
Killgore WDS, Kahn-Greene ET, Lipizzi EL, Newman RA, Kamimori GH, Balkin TJ. Sleep deprivation reduces perceived emotional intelligence and constructive thinking skills. Sleep Med. 2008;9(5):517–526. | ||
Brand S, Kirov R, Kalak N, et al. Poor sleep is related to lower emotional competence among adolescents. Behav Sleep Med. 2016;14(6):602–614. | ||
Kirov R, Brand S, Kolev V, Yordanova J. The sleeping brain and the neural basis of emotions. Behav Brain Sci. 2012;35(03):155–156. | ||
Mikoteit T, Brand S, Beck J, et al. Visually detected NREM Stage 2 sleep spindles in kindergarten children are associated with current and future emotional and behavioural characteristics. J Sleep Res. 2013;22(2):129–136. | ||
Catrett CD, Gaultney JF. Possible insomnia predicts some risky behaviors among adolescents when controlling for depressive symptoms. J Genet Psychol. 2009;170(4):287–309. | ||
Wong MM, Robertson GC, Dyson RB. Prospective relationship between poor sleep and substance-related problems in a national sample of adolescents. Alcohol Clin Exp Res. 2015;39(2):355–362. | ||
Leger D. Working with poor sleep. Sleep. 2014;37(9):1401–1403. | ||
Léger D, Bayon V. Societal costs of insomnia. Sleep Med Rev. 2010;14(6):379–389. | ||
Akerstedt T, Philip P, Capelli A, Kecklund G. Sleep loss and accidents-work hours, life style, and sleep pathology. Prog Brain Res. 2011;190:169–188. | ||
Léger D, Bayon V, Ohayon MM, et al. Insomnia and accidents: cross-sectional study (EQUINOX) on sleep-related home, work and car accidents in 5293 subjects with insomnia from 10 countries. J Sleep Res. 2014;23(2):143–152. | ||
Czeisler CA, Wickwire EM, Barger LK, et al. Sleep-deprived motor vehicle operators are unfit to drive: a multidisciplinary expert consensus statement on drowsy driving. Sleep Health. 2016;2(2):94–99. | ||
Gupta R, Pandi-Perumal SR, Almeneessier AS, Bahammam AS. Hypersomnolence and Traffic Safety. Sleep Med Clin. 2017;12(3):489–499. | ||
Shekari Soleimanloo S, White MJ, Garcia-Hansen V, Smith SS. The effects of sleep loss on young drivers’ performance: a systematic review. PLoS One. 2017;12(8):e0184002. | ||
Strohl KP, Brown DB, Collop N, et al; ATS Ad Hoc Committee on Sleep Apnea, Sleepiness, and Driving Risk in Noncommercial Drivers. An official American thoracic society clinical practice guideline: sleep apnea, sleepiness, and driving risk in noncommercial drivers. An update of a 1994 statement. Am J Respir Crit Care Med. 2013;187(11):1259–1266. | ||
American Academy of Sleep Medicine Board of Directors, Watson NF, Morgenthaler T, et al. Confronting drowsy driving: the American academy of sleep medicine perspective. J Clin Sleep Med. 2015;11(11):1335–1336. | ||
Gonçalves M, Amici R, Lucas R, et al; National Representatives as Study Collaborators. Sleepiness at the wheel across Europe: a survey of 19 countries. J Sleep Res. 2015;24(3):242–253. | ||
Garbarino S, Magnavita N, Guglielmi O, et al. Insomnia is associated with road accidents. Further evidence from a study on truck drivers. PLoS One. 2017;12(10):e0187256. | ||
Bioulac S, Micoulaud-Franchi J-A, Arnaud M, et al. Risk of motor vehicle accidents related to sleepiness at the wheel: a systematic review and meta-analysis. Sleep. 2017;40(10). | ||
Thomann J, Baumann CR, Landolt HP, Werth E. Psychomotor vigilance task demonstrates impaired vigilance in disorders with excessive daytime sleepiness. J Clin Sleep Med. 2014;10(9):1019–1024. | ||
Schreier DR, Banks C, Mathis J. Driving simulators in the clinical assessment of fitness to drive in sleepy individuals: a systematic review. Sleep Med Rev. 2017;38:86–100. | ||
Hallvig D, Anund A, Fors C, et al. Sleepy driving on the real road and in the simulator—A comparison. Accid Anal Prev. 2013;50:44–50. | ||
Tabrizi R, Moosazadeh M, Razzaghi A, et al. Prevalence of sleep quality disorder among Iranian drivers: a systematic review and meta-analysis. J Inj Violence Res. 2018;10(1):53–59. | ||
Alavi SS, Mohammadi M, Soori H, et al. Iranian version of Manchester Driving Behavior Questionnaire (MDBQ): psychometric properties. Iran J Psychiatry. 2016;11(1):37–42. | ||
Oreyzi Samani SHR, Haghayegh SA. Psychometric properties of the Manchester Driving Behavior Questionnaire. Payesh. 2010;9:21–28. | ||
Goldberg DP, Hillier VF. A scaled version of the General Health Questionnaire. Psychol Med. 1979;9(1):139–145. | ||
Namjoo S, Shaghaghi A, Sarbaksh P, Allahverdipour H, Pakpour AH. Psychometric properties of the General Health Questionnaire (GHQ-12) to be applied for the Iranian elder population. Aging Ment Health. 2017;21(10):1047–1051. | ||
Buss AH, Perry M. The aggression questionnaire. J Pers Soc Psychol. 1992;63(3):452–459. | ||
Buysse DJ, Reynolds CF, Monk TH, Berman SR, Kupfer DJ. The Pittsburgh sleep quality index: a new instrument for psychiatric practice and research. Psychiatry Res. 1989;28(2):193–213. | ||
Farrahi J, Nakhaee N, Sheibani V, Garrusi B, Amirkafi A. Psychometric properties of the Persian version of the Pittsburgh Sleep Quality Index addendum for PTSD (PSQI-A). Sleep Breath. 2009;13(3):259–262. | ||
Riemann D, Spiegelhalder K, Feige B, et al. The hyperarousal model of insomnia: a review of the concept and its evidence. Sleep Med Rev. 2010;14(1):19–31. | ||
Harvey AG. Pre-sleep cognitive activity: a comparison of sleep-onset insomniacs and good sleepers. Br J Clin Psychol. 2000;39(3):275–286. | ||
Pillai V, Roth T, Mullins HM, Drake CL. Moderators and mediators of the relationship between stress and insomnia: stressor chronicity, cognitive intrusion, and coping. Sleep. 2014;37(7):1199–1208. | ||
Pillai V, Steenburg LA, Ciesla JA, Roth T, Drake CL. A seven day actigraphy-based study of rumination and sleep disturbance among young adults with depressive symptoms. J Psychosom Res. 2014;77(1):70–75. | ||
Yoo S-S, Gujar N, Hu P, Jolesz FA, Walker MP. The human emotional brain without sleep — a prefrontal amygdala disconnect. Curr Biol. 2007;17(20):R877–R878. | ||
Gamaldo CE, Benbrook AR, Allen RP, Oguntimein O, Earley CJ. A further evaluation of the cognitive deficits associated with restless legs syndrome (RLS). Sleep Med. 2008;9(5):500–505. | ||
Rist PM, Elbaz A, Dufouil C, Tzourio C, Kurth T. Restless legs syndrome and cognitive function: a population-based cross-sectional study. Am J Med. 2015;128(9):1023.e33–.e39. | ||
Lee HB, Ramsey CM, Spira AP, Vachon J, Allen R, Munro CA. Comparison of cognitive functioning among individuals with treated restless legs syndrome (RLS), untreated RLS, and no RLS. J Neuropsychiatry Clin Neurosci. 2014;26(1):87–91. | ||
Driver-Dunckley E, Connor D, Hentz J, et al. No evidence for cognitive dysfunction or depression in patients with mild restless legs syndrome. Mov Disord. 2009;24(12):1843–1847. | ||
Fulda S, Beitinger ME, Reppermund S, Winkelmann J, Wetter TC. Short-term attention and verbal fluency is decreased in restless legs syndrome patients. Mov Disord. 2010;25(15):2641–2648. | ||
Fulda S, Szesny N, Ising M, et al. Further evidence for executive dysfunction in subjects with RLS from a non-clinical sample. Sleep Med. 2011;12(10):1003–1007. | ||
Wolfson AR, Carskadon MA, Acebo C, et al. Evidence for the validity of a sleep habits survey for adolescents. Sleep. 2003;26(2):213–216. |
 © 2018 The Author(s). This work is published and licensed by Dove Medical Press Limited. The full terms of this license are available at https://www.dovepress.com/terms.php and incorporate the Creative Commons Attribution - Non Commercial (unported, v3.0) License.
By accessing the work you hereby accept the Terms. Non-commercial uses of the work are permitted without any further permission from Dove Medical Press Limited, provided the work is properly attributed. For permission for commercial use of this work, please see paragraphs 4.2 and 5 of our Terms.
© 2018 The Author(s). This work is published and licensed by Dove Medical Press Limited. The full terms of this license are available at https://www.dovepress.com/terms.php and incorporate the Creative Commons Attribution - Non Commercial (unported, v3.0) License.
By accessing the work you hereby accept the Terms. Non-commercial uses of the work are permitted without any further permission from Dove Medical Press Limited, provided the work is properly attributed. For permission for commercial use of this work, please see paragraphs 4.2 and 5 of our Terms.