Back to Journals » Journal of Hepatocellular Carcinoma » Volume 7
Amide Proton Transfer Imaging vs Diffusion Kurtosis Imaging for Predicting Histological Grade of Hepatocellular Carcinoma
Authors Wu B ![]() , Jia F, Li X, Zhang M, Han D, Jia Z
, Jia F, Li X, Zhang M, Han D, Jia Z ![]()
Received 30 July 2020
Accepted for publication 27 August 2020
Published 9 October 2020 Volume 2020:7 Pages 159—168
DOI https://doi.org/10.2147/JHC.S272535
Checked for plagiarism Yes
Review by Single anonymous peer review
Peer reviewer comments 3
Editor who approved publication: Dr Ahmed Kaseb
Baolin Wu,1,* Fei Jia,2,* Xuekun Li,2 Meng Zhang,2 Dongming Han,2 Zhiyun Jia1,3
1Huaxi MR Research Center (HMRRC), Functional and Molecular Imaging Key Laboratory of Sichuan Province, Department of Radiology, West China Hospital of Sichuan University, Chengdu 610041, Sichuan, People’s Republic of China; 2Department of MR, First Affiliated Hospital of Xinxiang Medical University, Weihui 453100, Henan, People’s Republic of China; 3Department of Nuclear Medicine, West China Hospital of Sichuan University, Chengdu 610041, Sichuan, People’s Republic of China
*These authors contributed equally to this work
Correspondence: Dongming Han
Department of MR, First Affiliated Hospital of Xinxiang Medical University, Weihui 453100, Henan, People’s Republic of China
Tel +86 13849369537
Email [email protected]
Zhiyun Jia
Department of Nuclear Medicine, West China Hospital, Sichuan University, Chengdu 610041, Sichuan, People’s Republic of China
Tel + 86-13408419087
Fax + 86 28 85423503
Email [email protected]
Background: To investigate the value of amide proton transfer (APT) imaging in predicting the histological grade of hepatocellular carcinoma (HCC), compared with diffusion kurtosis imaging (DKI).
Methods: A total of 88 patients with HCC were enrolled and divided into four groups (G1, G2, G3, and G4) based on histologic grades. Preoperative APT signal intensity (SI), mean diffusivity (MD), mean kurtosis (MK) of HCC were measured and compared. Those quantitative magnetic resonance imaging (qMRI) parameters were compared using an analysis of variance. The correlations between the qMRI parameters and the histological grades were determined using Spearman’s rank analysis. In addition, the predictive performance for differentiating low- (G1 and G2) from high-grade (G3 and G4) HCC was evaluated using receiver operating characteristic (ROC) curve analysis.
Results: Significant differences were found in APT SIs, MD, and MK among the four groups (P< 0.05). Moderate to good relationships were found between the histologic grade of HCC and APT SI and MK (r=0.679, P< 0.001 and r=0.539, P< 0.001, respectively). The area under the ROC curves (AUCs) of APT SI, MK, and MD for differentiating low- from high-grade HCC were 0.890 (95%CI: 0.805– 0.947), 0.765 (95%CI: 0.662– 0.849) and 0.717 (95%CI: 0.611– 0.808), respectively. Comparison of ROC curves showed a significantly higher AUC of APT SI compared with those of the DKI-derived parameters (P < 0.05).
Conclusion: The APT imaging may be more accurate than DKI for predicting the histological grade of HCC.
Keywords: hepatocellular carcinoma, amide proton transfer, diffusion kurtosis imaging, histological grade
Background
Hepatocellular carcinoma (HCC) is the most common primary liver cancer and is mainly associated with liver cirrhosis.1 With a growing incidence and mortality of HCC, it has become a global health concern. Despite great efforts to improve the diagnosis and treatment in HCC, patients still have a high recurrence rate and very poor prognosis.1 Notably, a major factor that predicts tumor recurrence and long-term survival after liver resection in HCC patients is the histologic grade of HCC.2,3 At present, the accurate preoperative prediction of histologic grading of HCC remains a challenge. Thus, there is a need to develop a valuable tool to evaluate the histologic grading of HCC prior to liver resection. A more accurate predictive strategy for HCC grade prior to liver resection will be helpful to the adequate assessment of HCC and assist in improving the prognosis of those patients.
Recently, quantitative magnetic resonance imaging (qMRI) has provided a valuable tool tfor the diagnosis of HCC. As a special diffusion-weighted imaging (DWI) model which enables characterization of non-Gaussian water diffusion,4 the diffusion kurtosis imaging (DKI) has been widely used in the diagnosis of cancer. A previous study has demonstrated a better sensitivity of this model to the complex tissue microstructure with multiple b values.5 Compared with conventional DWI, some researchers have demonstrated an improved diagnostic performance of DKI in discriminating tumor grades of several solid malignancies, such as endometrial carcinoma,6 breast cancer,7 prostate cancer,8 and head and neck tumors.9 Moreover, a recent study revealed that DKI was superior to conventional DWI in predicting the microvascular invasion and histological grade of HCC.10
Amide proton transfer (APT) imaging, which was proposed by Zhou et al in 2013,11 is a kind of chemical exchange saturation transfer (CEST) imaging. It mainly measures the chemical transfer characteristics of amide protons located at 3.5 ppm, which can indirectly determine the content of endogenous mobile proteins and polypeptides.12 Early application of APT imaging on high-grade brain tumors found that the mean APT signal intensities (SIs) in the viable tumor cores were significantly higher than those of peritumoral edema and normal-appearing white matter.13 Recent studies have demonstrated the potential value of APT imaging in evaluating the histological grades of endometrioid endometrial adenocarcinoma (EEA),14 squamous cell carcinoma of the cervix (SCCC),15 and gliomas.16 As a novel contrast mechanism in the field of molecular imaging, APT imaging has provided a novel tool to the diagnosis of HCC grade. To the best of our knowledge, only one study has reported the application of APT imaging for the prediction of histological grade of HCC, and the authors found a higher AUC of APT SI for discriminating high- from low-grade HCCs was higher than that of ADC derived from conventional DWI, indicating that APT imaging can be a helpful imaging biomarker for a more accurate prediction of HCC grade than DWI.17
However, due to the limited research, the application value of APT imaging in predicting the pathological grade of HCC still needs further explanation. Moreover, whether APT SI can provide a more reliable predictive tool for differentiating HCC grades than DKI-derived parameters remains unclear. Thus, the purpose of the present study was to investigate the value of APT imaging for the evaluation of HCC grade, with comparison to the DKI technique.
Methods
This prospective study was approved by the institutional review board of the First Affiliated Hospital of Xinxiang Medical University and followed the ethical guidelines of the Declaration of Helsinki. Written informed consent was obtained from each patient prior to inclusion.
Patients
Our study initially enrolled 127 patients with suspected HCC, and all of those patients underwent liver MR scanning prior to surgery. Thirty-nine patients were excluded because they: (1) did not undergo liver resection and/or pathological examination (n=17); (2) had a history of preoperative treatment prior to MR imaging (n=9); (3) were not diagnosed with HCC after evaluating the final histopathological examinations (n=7); (4) had a low quality of MRIs (n=3); and (5) had tumor lesions smaller than 1 cm (n=3).
Consequently, the present study included 88 patients with histopathological-confirmed HCC, comprising 78 males and 10 females, with a mean age of 53.45±13.67 years (range from 31 to 67 years). The demographic and clinical data of the included HCC patients are shown in Table 1. According to the Edmondson and Steiner grading system, all the tumors were histologically classified as follows: grade 1 (G1, n=19), grade 2 (G2, n=30), grade 3 (G3, n=28), and grade 4 (G4, n=11).
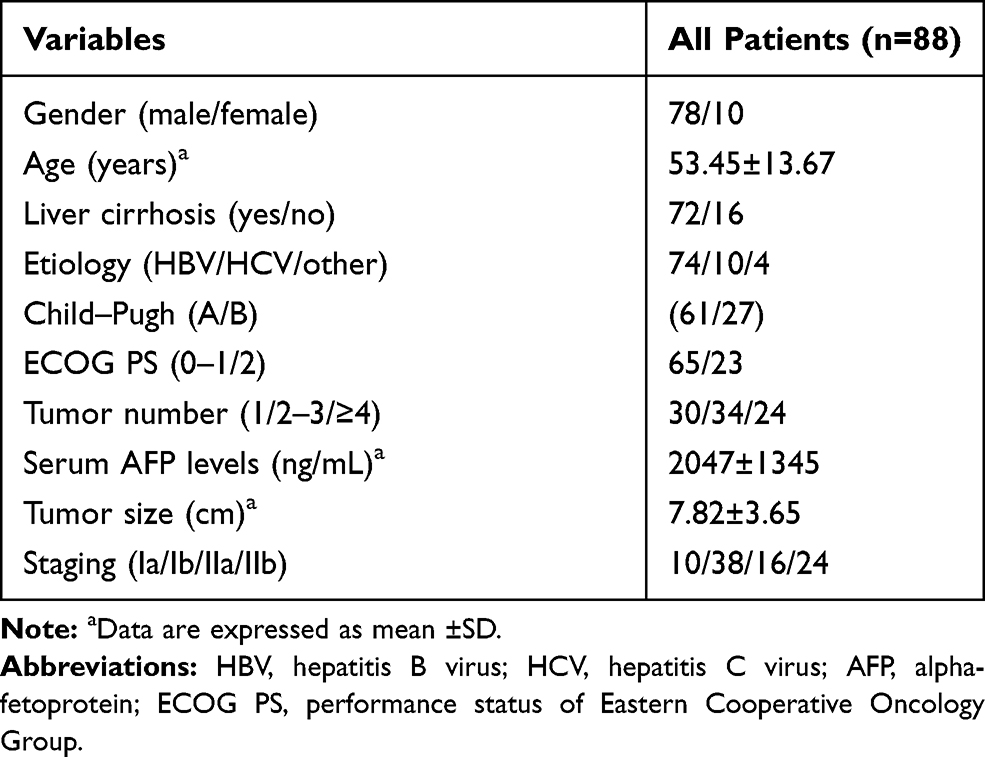 |
Table 1 Baseline Demographic and Clinical Characteristics of Included Patients with HCC |
Data Acquisition
Liver MRI data were acquired on a GE 3.0T MR750 scanner with a 32-channel phased-array torso coil. The scanning range was from the top of diaphragm to the lower edge of liver. Each patient was asked to have no food or drink for six to eight hours before MR scanning. Since the contrast agents can seriously interfere with the APT signal, all patients were also asked to have no form of contrast-enhanced imaging 24 h before the liver MR examinations. First, conventional MRI data were obtained, including the three-dimensional fat-suppressed T1-weighted gradient-echo (LAVA) and axial respiratory triggered fat-suppressed fast spin-echo (FSE) T2-weighted imaging sequences. Then, a single-shot fast spin echo-planar imaging (FS-EPI) sequence was used to obtain two-dimensional axial APT images. For APT imaging, the frequency offsets were ±600, ±575, ±550, ±525, ±500, ±475, ±450, ±425, ±400, ±375, ±350, ±325, ±300, ±275, ±250, ±225, ±200, ±175, ±150, ±125, ±100, ±75, ±50, ±25 and 0 Hz, and three unsaturated images at 5000 Hz were obtained for signal normalization. Since APT imaging is a single-layer scanning technique, the APT images were only obtained in the maximum diameter of the tumor by referring to the axial T2-weighted imaging. In addition, a spin-echo echo-planar imaging (SE-EPI) sequence was used to acquire two-dimensional axial DKI images. The DKI data were acquired along 30 directions, with b values of 0, 1000, and 2000 s/mm2. A detailed description of the MR imaging parameters is shown in Table 2.
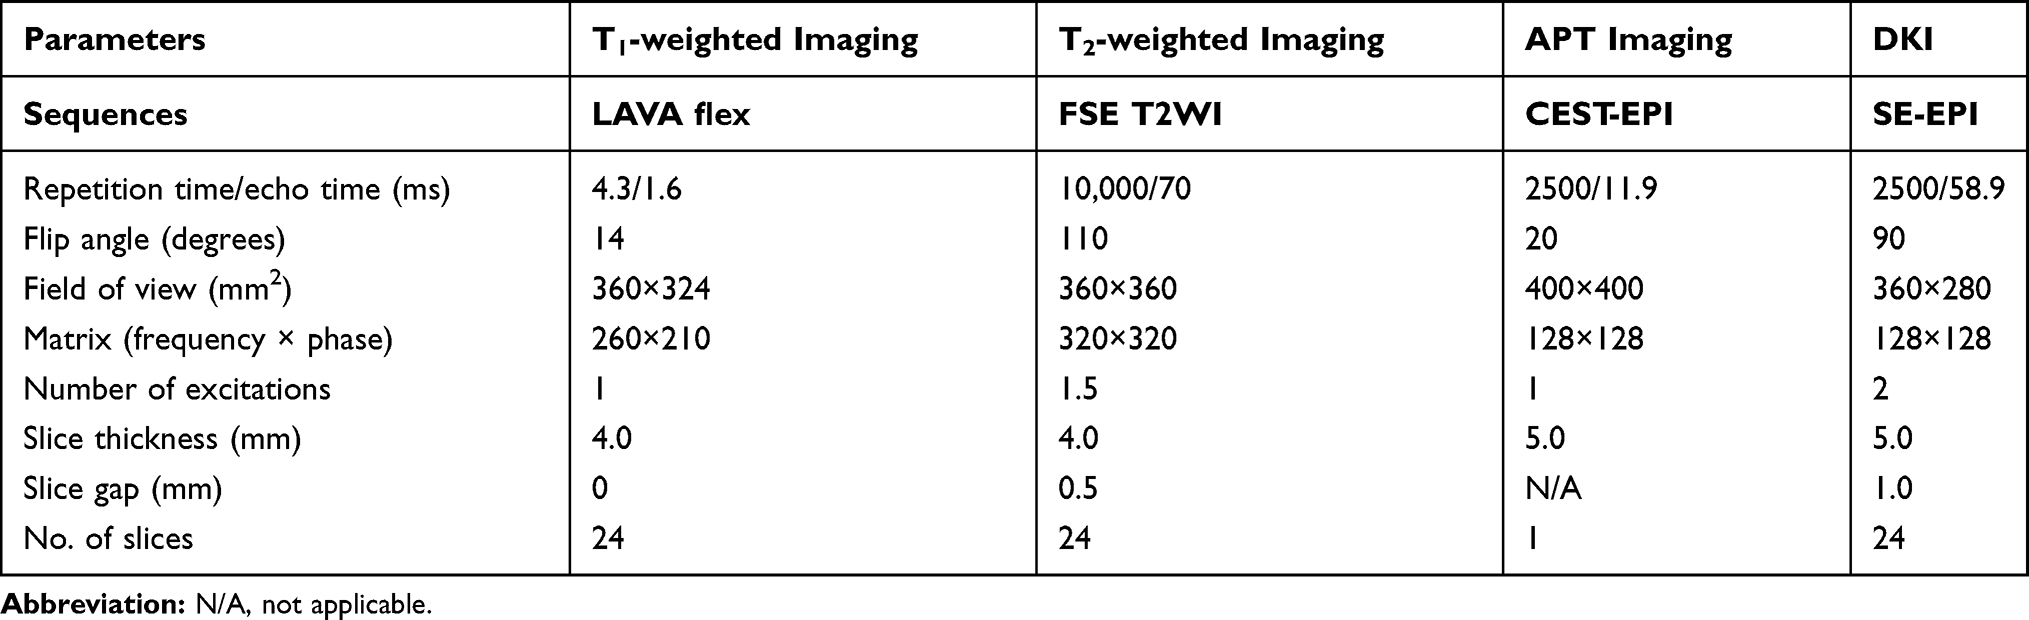 |
Table 2 Details of MRI Parameters |
Data Analysis
After liver MR scanning, the imaging data were transferred to the GE AW4.6 workstation (Advantage workstation 4.6, GE Healthcare, Milwaukee, WI, USA) for postprocessing. In CEST imaging, the exchangeable protons in specific molecules are selectively saturated and, after transfer of this saturation by chemical exchange to water protons, detected indirectly through a signal change of bulk water. Contrast is thus generated by imaging the signal difference of protons in bulk water and expressed quantitatively using magnetic transfer ratio asymmetry (MTRasym). The MTR was defined as 1−Ssat/S0, where S0 and Ssat are the water signals before and after pulse saturation, respectively.11 For APT imaging, the asymmetry analysis at 3.5 ppm downfield from the water signal was calculated as MTRasym (3.5 ppm): MTRasym (3.5 ppm) = Ssat (−3.5 ppm)/S0 − Ssat (+3.5 ppm)/S0 = MTR’asym (3.5ppm) + APTR, where MTR’asym is the inherent asymmetry of the conventional magnetization transfer effect, and APTR is the APT ratio.11 As a result, the measured MTRasym (3.5 ppm) values can be defined as the apparent APT SIs, and therefore, it is appropriate to define the calculated MTRasym (3.5 ppm) images as APT-weighted imaging. In this study, the APT SI was defined as MTRasym (3.5 ppm)×100 (%). The details of the calculation formulas and data processing of the APT- and DKI-derived parameters have been reported in previous studies.10,14 Two of the authors (BLW and FJ, with seven and five years of experience in liver MR imaging, respectively) who were blinded to the histopathological results independently performed the data analysis. First, on the largest diameter of the tumor, a boundary was drawn along the tumor edge on the original APT and DKI images by referring to the tumor contour on the conventional T1- and T2-weighted images. Second, in the solid part of the tumor, three regions of interest (ROIs) of similar size (approximately 100 mm2) were manually delineated. Finally, the ROIs in the original APT and DKI images were automatically copied to the pseudo-colored maps to obtain the mean APT SIs, mean diffusivity (MD), and mean kurtosis (MK) values within each ROI. For each qMRI parameter, we calculated the average value of the three ROIs and recorded the averaged value of the two observers for further analysis. For patients with multifocal lesions, the one with the largest diameter was chosen for analysis according to a previous study.10
Pathological Evaluation
H&E staining of tumor slices and pathological evaluation was performed for the surgically resected specimens by a pathologist (a non-author with 31 years of experience in liver pathology) who was blinded to the liver MRI results. The histologic grade, size, and location of the HCC were included in the pathological reports. The histologic grade of HCC was reported according to the Edmondson and Steiner grading system.18 One author (XKL) consulted the electronic medical records and collected the pathological data of each patient.
Statistical Analysis
Statistical analyses were performed using SPSS version 22.0 (IBM Corporation, Armonk, NY, USA) and MedCalc version 19.2.0 (MedCalc, Mariakerke, Belgium) software. The differences in those qMRI parameters among different HCC grades were analyzed using an analysis of variance, followed by a post hoc test using least significant difference method. A Shapiro–Wilk test was used to evaluate the normal distribution of the qMRI parameters. Then, if those parameters were determined to be normally distributed, the intraclass correlation coefficient (ICC), a measurement reflecting the differences in reliability between the two independent observers, was used to assess the reproducibility of those parameters. ICC values of less than 0.40 and values greater than or equal to 0.75 indicated poor and excellent agreement, respectively; and values between 0.40–0.59 and 0.60–0.74 were indicative of fair and good agreement, respectively.14 The Spearman rank analysis was used to compare the correlation between those qMRI parameters and the histological grades. According to a previous study,19 the degree of the correlations were divided into four grades: a r value of equal or more than 0 but less than 0.25 was defined as a little or no relationship; a r value of equal or more than 0.25 but less than 0.5 was defined as a fair relationship; a r value of equal or more than 0.5 but less than 0.75 was defined as a moderate to good relationship; and a r value of equal or more than 0.75 was defined as a very good to excellent relationship. A Bland–Altman plot analysis was used to illustrate the agreement between the interobserver measurements. Receiver operating characteristic (ROC) analysis was used to determine the diagnostic performance of APT SI and DKI-derived parameters in distinguishing the low-grade (G1 and G2) and high-grade (G3 and G4) HCC. DeLong test20 was used for the comparison of ROC curves. A P<0.05 was considered to indicate a significant difference.
Results
Interobserver Agreement
The Shapiro–Wilk test revealed that all the qMRI parameters were normally distributed (observer 1: P=0.124 for APT SIs, 0.238 for MD, and 0.241 for MK; observer 2: P=0.215 for APT SIs, 0.169 for MD, and 0.249 for MK). The ICC values between the two radiologists were 0.998 (95%CI: 0.996–0.998), 0.994 (95%CI: 0.991–0.996), and 0.995 (95%CI: 0.992–0.997) for APT SI, MK and MD, respectively, suggesting an excellent reliability. As for each of those qMRI parameters, the Bland–Altman analysis showed a good concordance degree between the two observers, with only two values beyond the 95% limits of agreement for each parameter (Figure 1).
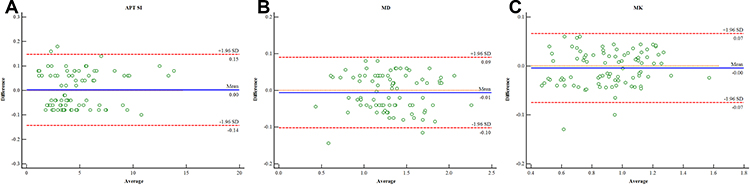 |
Figure 1 Bland–Altman plots showing the distribution of the differences of the APT SI (A), MD (B), and MK (C) between the two observers. The blue horizontal solid line represents the mean difference; and the two red horizontal lines represent the limits of agreement, which are defined as the mean difference ±1.96 SD of the differences. |
Comparisons of the qMRI Parameters
The results showed that there were significant differences in APT SIs (G1: 2.74±1.27%; G2: 3.47±1.02%; G3: 6.21±2.66%; and G4: 7.53±3.17%), MD (G1: 1.51±0.22×10⁻³ mm2/s; G2: 1.35±0.36×10⁻³ mm2/s; G3: 1.20±0.35×10⁻³ mm2/s; and G4: 1.11±0.29×10⁻³ mm2/s), and MK (G1: 0.75±0.22; G2: 0.86±0.23; G3: 0.97±0.12; and G4: 1.17±0.18) values among different tumor grades (Table 3). Post hoc pairwise comparisons showed significant differences in APT SIs between G1 and G3, G1 and G4, G2 and G3, and G2 and G4; and in MK between G1 and G3, G1 and G4, G2 and G3, G2 and G4, and G3 and G4; and in MD between G1 and G3, G1 and G4, and G2 and G4 (all P<0.05) (Figure 2). Figures 3 and 4 show typical MR images and pathologic results of two patients with low-grade (G2) and high-grade (G4) HCC, respectively.
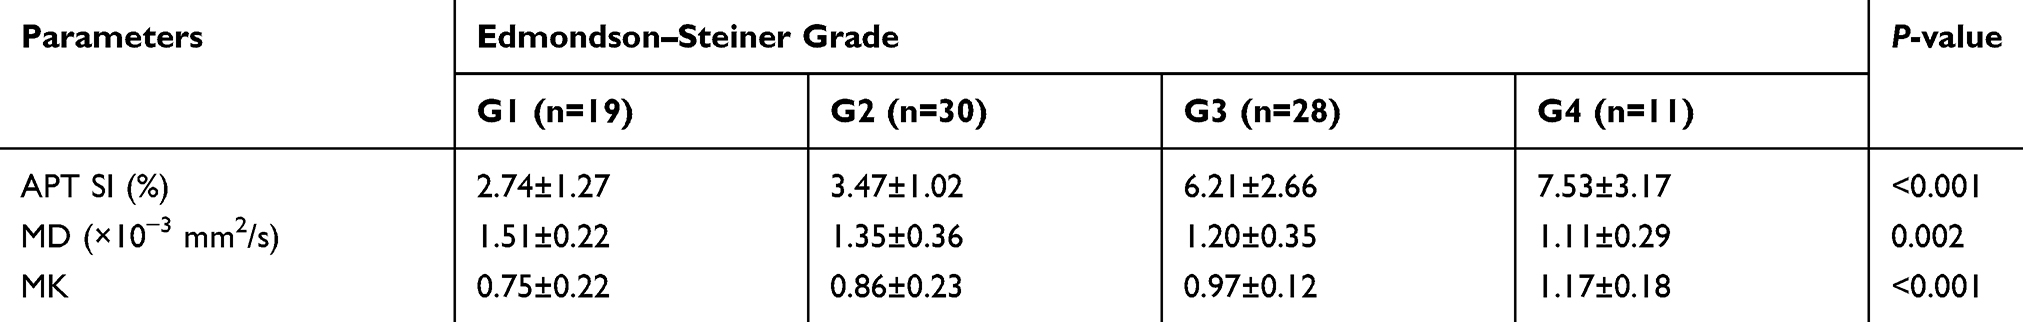 |
Table 3 Comparisons of the Parameters Derived from APT Imaging and DKI Among Different Histological Grades |
 |
Figure 2 Column and scatter plot diagrams show individual data points, averages and standard deviations of APT SIs (A), MK (B), and MD (C) for each HCC grade. *P<0.05, **P<0.01, and ***P<0.001 for pairwise comparisons. |
 |
Figure 3 Typical images from a 52-year-old man with grade 2 HCC. (A) T2-weighted image. (B) original APT image. (C) APT pseudo-colored map indicates that the average APT SI value determined by two observers is 3.17%. (D and E) DKI pseudo-colored maps indicate that the average MD and MK values determined by two observers are 1.18×10⁻³ mm2/s and 0.62, respectively. (F) microscopic image of H&E staining of HCC (original magnification, ×200). |
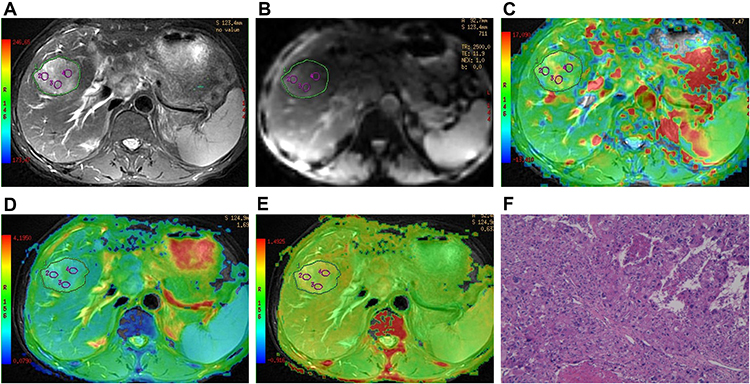 |
Figure 4 Typical images from a 47-year-old man with grade 4 HCC. (A) T2-weighted image. (B) original APT image. (C) APT pseudo-colored map indicates that the average APT SI value determined by two observers is 6.35%. (D and E) DKI pseudo-colored maps indicate that the average MD and MK values determined by two observers are 0.82×10⁻³ mm2/s and 0.85, respectively. (F) microscopic image of H&E staining of HCC (original magnification, ×200). |
Correlations of Histologic Grade with the qMRI Parameters
The Spearman correlation coefficients between the parameters derived from APT imaging and DKI and the histopathological grades of HCC are shown in Table 4. A moderate to good relationship was found between the histologic grade of HCC with APT SI and MK (r=0.679, P<0.001 and r=0.539, P<0.001). A fair relationship was demonstrated between the histologic grade of HCC and MD (r=−0.435, P<0.001).
 |
Table 4 Spearman Correlation Coefficients of the APT- and DKI-derived Parameters with the Histopathological Grades of HCC |
ROC Analysis for Diagnostic Performance of the qMRI Parameters
Figure 5 and Table 5 show the ROC curve analysis results. The AUCs of APT SI, MK and MD for differentiating low- from high-grade HCC were 0.890 (95%CI: 0.805–0.947), 0.765 (95%CI: 0.662–0.849) and 0.717 (95%CI: 0.611–0.808), respectively. Comparison of ROC curves demonstrated that the area under the ROC curve (AUC) of APT SI was significantly higher than those of the DKI-derived parameters (Z=1.983, P=0.0474 and Z=2.654, P=0.008, compared with MK and MD respectively). Under the optimal cutoff value, the APT SI has an optimized balance between the sensitivity (85.71%) and specificity (82.05%) for differentiating low- from high-grade HCC.
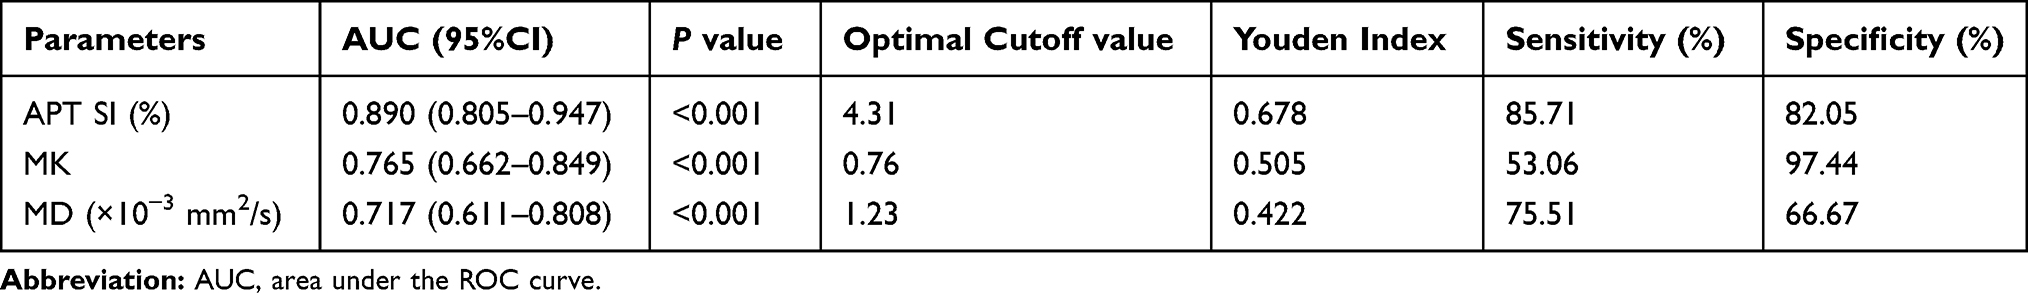 |
Table 5 Diagnostic Performance of the Parameters Derived from APT Imaging and DKI in Differentiating Low- from High-grade HCC |
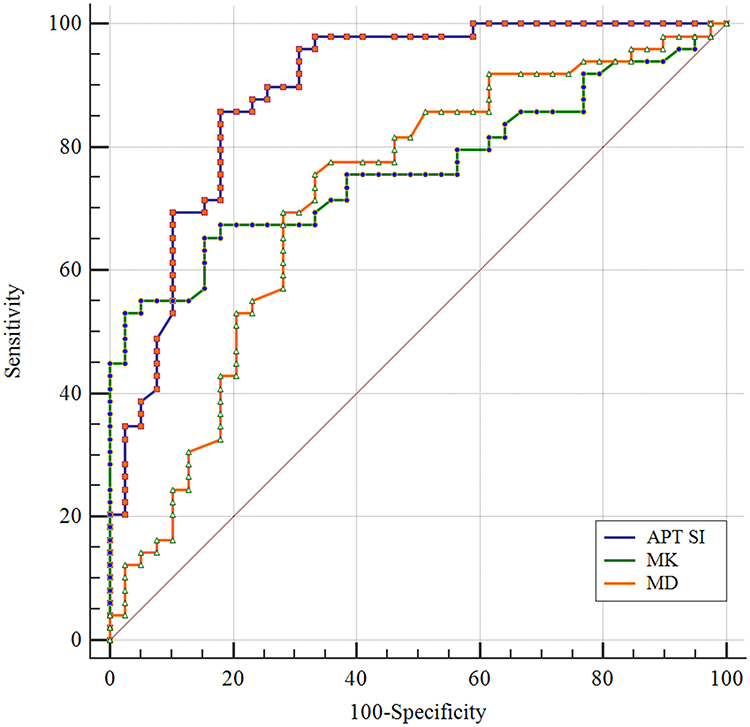 |
Figure 5 ROC curves of the APT SI and DKI-derived parameters for differentiating low-from high-grade HCC. The AUCs for APT SI, MK and MD are 0.890 (95%CI: 0.805–0.947), 0.765 (95%CI: 0.662–0.849), and 0.717 (95%CI: 0.611–0.808), respectively. |
Discussion
The present study demonstrated differences in values of the preoperative APT SI, MD, and MK among different histologic grades of HCC. In addition, APT SI was positively correlated with the histologic grade of HCC (r=0.679, P<0.001). Furthermore, comparison of ROC curves showed that the AUC of APT SI was significantly higher than those of DKI-derived parameters. Our findings indicate that the APT imaging, a novel molecular MRI technique, may be more accurate in differentiating low- from high-grade of HCC than DKI.
The application of MRI in HCC grading has developed rapidly, and the most widely used is DWI. A recent study compared DKI-derived parameters with conventional DWI in predicting the histological grade of HCC, and suggested that DKI-derived MK was superior to conventional ADC for predicting the HCC grade.10 Thus, to develop a more useful and noninvasive tool to evaluate the HCC grade, our study mainly focused on evaluating the value of APT imaging in the evaluation of HCC grade, with comparison with DKI. The potential value of APT imaging in estimating the histologic grades of tumors, such as SCCC,15,21 diffuse gliomas,16 and EEA,14 has been demonstrated by previous studies. For example, Li et al investigated the application of APT imaging in estimating histologic grades of SCCC and found that APT SI was positively correlated with the SCCC grades.15 Another APT imaging study showed a progressive increase of APT SI from low- to high-grade of gliomas and positive correlations between APT SI and Ki-67 LI and between APT SI and cell density.16 Moreover, a positive correlation between the APT SI and the histologic grades of EEA has been demonstrated by a recent study.14 Thus, our findings are compatible with these previous studies and indicate that the APT imaging may be a promising method for predicting the histologic grades of tumors.
The APT SI, a unique parameter of APT imaging, can reflect the content of protein and polypeptide in tissues.11 Our study showed that a progressive increase in APT SIs were found from low- to high-grade HCC. Similarly, Takayama et al found that the APT SIs of high-grade EEA were significantly higher than those of low-grade EEA.14 In addition, APT imaging studies on brain tumors have demonstrated higher APT SIs than low-grade gliomas.16,22 Malignant tumors often show obvious cell and structural atypia, including an increase in the nucleo-to-cytoplasmic ratio, megakaryocytes, and malformed nuclei appear, and the number of ribosomes in the cytoplasm also increase.15 As the degree of differentiation of HCC becomes lower and lower during hepatocarcinogenesis, the cellular density and nuclear-to-cytoplasmic ratios increase, and the architecture becomes more complex.23 Theoretically, the effect of APT imaging in tumor is primarily correlated with the tissue content of labile amide protons of mobile proteins.24,25 The association of high APT SI values and high cellularity and proliferation has been clearly demonstrated in brain tumors.12,26 Therefore, the upward trend in APT SI for high-grade HCC may be associated with several factors, such as a higher tumor cell proliferation rate and cellular density.
Our study also revealed significant differences in MD and MK values among different HCC grades, and higher-grade HCC had lower MD and higher MK values than lower-grade HCC. These findings are consistent with a recent study.10 DKI can describe tissue water molecule motion, and MK may be a more meaningful indicator for the complexity of the organizational structure compared with MD.27 Decreased MD and increased MK values in higher-grade HCC may be attributed to the increased cellular density, nuclear-to-cytoplasmic ratios, and architectural complications.28
Further ROC curve analysis revealed that APT SI showed the highest AUC (AUC=0.890; 95%CI: 0.805–0.947) in differentiating low- from high-grade HCC, and the AUC of APT SI was significantly higher than those of the DKI-derived parameters. Meanwhile, APT SI showed an optimized balance of sensitivity (85.71%) and specificity (82.05%) for the differentiation of HCC grade. These results indicate that APT SI is more accurate to predict the histologic grade of HCC than DKI. Thus, the APT imaging may provide a more reliable tool to assist in selecting an adequate therapeutic strategy and predicting prognosis of HCC. Notably, although APT SI outperformed DKI-derived parameters in differentiating low- from high-grade HCC, our study revealed no differences in all of the three qMRI parameters between G1 and G2, which may suggest that APT SI is nonsuperior to DKI-derived parameters in distinguishing low-grade HCC (G1 and G2). The reason may be that the concentration of mobile amide protons and peptides increases more significantly in high-grade HCC, while the concentration of mobile amide protons and peptides changes slightly in low-grade HCC, which is difficult to be detected by APT imaging.
This study has several limitations. First, the APT imaging is single slice scanning. Thus, the APT images were only acquired on the maximum tumor area due to time limitations, which makes it impossible to fully assess signal changes in the whole tumor. Second, the APT and DKI images were obtained using EPI acquisition with free breathing, which might result in low resolution and poor signal-to-noise ratio of the images, and the APT imaging and DKI sequences are also easily affected by motion and susceptibility artifacts.29 However, previous study has shown that this free-breathing imaging protocol is feasible because of a good reproducibility and a shorter acquisition time compared with that of respiratory-triggered and breath-hold imaging protocol.30 Third, the APT imaging is influenced by many factors, such as the nuclear Overhauser effect and magnetization transfer effect. At present, pure APT effect can be obtained through some technical improvements.31 Fourth, the freehand ROI analysis could produce artificial errors, which might affect the accuracy of the values of those qMRI parameters. Fifth, we only conducted a comparative study of APT imaging and DKI in the prediction of HCC grade, whether a combination of them can be more accurate than single technique in predicting the histologic grade of HCC remains unclear. Thus, a future study investigating the predictive performance of this combination is needed. Finally, this is a single-center study with a relatively small sample size. A prospective cohort study with a large sample size is needed in the future to provide more reliable findings.
Conclusions
In summary, our preliminary study showed that APT SI was positively correlated with the histologic grading of HCC and had a better diagnostic performance than DKI-derived parameters in differentiating low- from high-grade HCC. These findings indicate that APT imaging may be a potential noninvasive biomarker for the prediction of histologic grading of HCC and can provide helpful quantitative MRI information to assist in HCC diagnosis and clinical treatment strategy. In the future, large-scale investigations are needed to confirm the value of APT imaging in HCC diagnosis and grading.
Abbreviations
HCC, hepatocellular carcinoma; APT, amide proton transfer; SI, signal intensity; DKI, diffusion kurtosis imaging; DWI, diffusion-weighted imaging; ROI, region of interest; MD, mean diffusivity; MK, mean kurtosis; AUC, area under the curve; ICC, intraclass correlation coefficient; ROC, receiver operating characteristic.
Acknowledgments
This study was supported by the National Natural Science Foundation of China (81971595 and 81771812); the Sichuan Science and Technology Support Program (2018SZ0391); the Innovation Spark Project of Sichuan University (2019SCUH0003); and the Henan Province Medical Science and Technology Research Project (2018020349).
Disclosure
The authors declare no conflicts of interest in this work.
References
1. Balogh J, Victor D, Asham EH, et al. Hepatocellular carcinoma: a review. J Hepatocell Carcinoma. 2016;3:41–53.
2. Zhou L, Rui JA, Wang SB, et al. Factors predictive for long-term survival of male patients with hepatocellular carcinoma after curative resection. J Surg Oncol. 2007;95(4):298–303.
3. Zhou L, Rui JA, Ye DX, Wang SB, Chen SG, Qu Q. Edmondson-Steiner grading increases the predictive efficiency of TNM staging for long-term survival of patients with hepatocellular carcinoma after curative resection. World J Surg. 2008;32(8):1748–1756.
4. Jensen JH, Helpern JA, Ramani A, Lu H, Kaczynski K. Diffusional kurtosis imaging: the quantification of non-gaussian water diffusion by means of magnetic resonance imaging. Magn Reson Med. 2005;53(6):1432–1440.
5. Rosenkrantz AB, Padhani AR, Chenevert TL, et al. Body diffusion kurtosis imaging: basic principles, applications, and considerations for clinical practice. J Magn Reson Imaging. 2015;42(5):1190–1202.
6. Chen T, Li Y, Lu SS, et al. Quantitative evaluation of diffusion-kurtosis imaging for grading endometrial carcinoma: a comparative study with diffusion-weighted imaging. Clin Radiol. 2017;72(11):
7. Sun K, Chen X, Chai W, et al. Breast cancer: diffusion kurtosis MR imaging-diagnostic accuracy and correlation with clinical-pathologic factors. Radiology. 2015;277(1):46–55.
8. Rosenkrantz AB, Sigmund EE, Johnson G, et al. Prostate cancer: feasibility and preliminary experience of a diffusional kurtosis model for detection and assessment of aggressiveness of peripheral zone cancer. Radiology. 2012;264(1):126–135.
9. Payabvash S. Quantitative diffusion magnetic resonance imaging in head and neck tumors. Quant Imaging Med Surg. 2018;8(10):1052–1065.
10. Cao L, Chen J, Duan T, et al. Diffusion kurtosis imaging (DKI) of hepatocellular carcinoma: correlation with microvascular invasion and histologic grade. Quant Imaging Med Surg. 2019;9(4):590–602.
11. Zhou J, Payen J-F, Wilson DA, Traystman RJ, van Zijl PC. Using the amide proton signals of intracellular proteins and peptides to detect pH effects in MRI. Nat Med. 2003;9(8):1085–1090.
12. Zhou J, Lal B, Wilson DA, Laterra J, van Zijl PC. Amide proton transfer (APT) contrast for imaging of brain tumors. Magn Reson Med. 2003;50(6):1120–1126.
13. Wen Z, Hu S, Huang F, et al. MR imaging of high-grade brain tumors using endogenous protein and peptide-based contrast. Neuroimage. 2010;51(2):616–622.
14. Takayama Y, Nishie A, Togao O, et al. Amide proton transfer MR imaging of endometrioid endometrial adenocarcinoma: association with histologic grade. Radiology. 2018;286(3):909–917.
15. Li B, Sun H, Zhang S, Wang X, Guo Q. Amide proton transfer imaging to evaluate the grading of squamous cell carcinoma of the cervix: a comparative study using 18F FDG PET. J Magn Reson Imaging. 2019;50(1):261–268.
16. Togao O, Yoshiura T, Keupp J, et al. Amide proton transfer imaging of adult diffuse gliomas: correlation with histopathological grades. Neuro-Oncology. 2014;16(3):441–448.
17. Lin Y, Luo X, Yu L, et al. Amide proton transfer-weighted MRI for predicting histological grade of hepatocellular carcinoma: comparison with diffusion-weighted imaging. Quant Imaging Med Surg. 2019;9(10):1641–1651.
18. Edmondson HA, Steiner PE. Primary carcinoma of the liver: a study of 100 cases among 48,900 necropsies. Cancer. 1954;7(3):462–503.
19. Woo S, Lee JM, Yoon JH, Joo I, Han JK, Choi BI. Intravoxel incoherent motion diffusion-weighted MR imaging of hepatocellular carcinoma: correlation with enhancement degree and histologic grade. Radiology. 2014;270(3):758–767.
20. DeLong ER, DeLong DM, Clarke-Pearson DL. Comparing the areas under two or more correlated receiver operating characteristic curves: a nonparametric approach. Biometrics. 1988;44(3):837–845.
21. Li B, Sun H, Zhang S, Wang X, Guo Q. The utility of APT and IVIM in the diagnosis and differentiation of squamous cell carcinoma of the cervix: a pilot study. Magn Reson Imaging. 2019;63:105–113.
22. Park JE, Kim HS, Park KJ, Kim SJ, Kim JH, Smith SA. Pre- and posttreatment glioma: comparison of amide proton transfer imaging with MR spectroscopy for biomarkers of tumor proliferation. Radiology. 2016;278(2):514–523.
23. Muhi A, Ichikawa T, Motosugi U, et al. High-b-value diffusion-weighted MR imaging of hepatocellular lesions: estimation of grade of malignancy of hepatocellular carcinoma. J Magn Reson Imaging. 2009;30(5):1005–1011.
24. Zhou J, Heo HY, Knutsson L, van Zijl PCM, Jiang S. APT-weighted MRI: techniques, current neuro applications, and challenging issues. J Magn Reson Imaging. 2019;50(2):347–364.
25. Yan K, Fu Z, Yang C, et al. Assessing amide proton transfer (APT) MRI contrast origins in 9 L gliosarcoma in the rat brain using proteomic analysis. Mol Imaging Biol. 2015;17(4):479–487.
26. Zhou J, Zhu H, Lim M, et al. Three-dimensional amide proton transfer MR imaging of gliomas: initial experience and comparison with gadolinium enhancement. J Magn Reson Imaging. 2013;38(5):1119–1128.
27. Zhu LH, Zhang ZP, Wang FN, Cheng QH, Guo G. Diffusion kurtosis imaging of microstructural changes in brain tissue affected by acute ischemic stroke in different locations. Neural Regen Res. 2019;14(2):272–279.
28. Guo AC, Cummings TJ, Dash RC, Provenzale JM. Lymphomas and high-grade astrocytomas: comparison of water diffusibility and histologic characteristics. Radiology. 2002;224(1):177–183.
29. Akbey S, Ehses P, Stirnberg R, Zaiss M, Stöcker T. Whole‐brain snapshot CEST imaging at 7 T using 3D‐EPI. Magn Reson Med. 2019;82(5):1741–1752.
30. Chen X, Qin L, Pan D, et al. Liver diffusion-weighted MR imaging: reproducibility comparison of ADC measurements obtained with multiple breath-hold, free-breathing, respiratory-triggered, and navigator-triggered techniques. Radiology. 2014;271(1):113–125.
31. Sun PZ, Xiao G, Zhou IY, Guo Y, Wu R. A method for accurate pH mapping with chemical exchange saturation transfer (CEST) MRI. Contrast Media Mol Imaging. 2016;11(3):195–202.
 © 2020 The Author(s). This work is published and licensed by Dove Medical Press Limited. The
full terms of this license are available at https://www.dovepress.com/terms
and incorporate the Creative Commons Attribution
- Non Commercial (unported, 3.0) License.
By accessing the work you hereby accept the Terms. Non-commercial uses of the work are permitted
without any further permission from Dove Medical Press Limited, provided the work is properly
attributed. For permission for commercial use of this work, please see paragraphs 4.2 and 5 of our Terms.
© 2020 The Author(s). This work is published and licensed by Dove Medical Press Limited. The
full terms of this license are available at https://www.dovepress.com/terms
and incorporate the Creative Commons Attribution
- Non Commercial (unported, 3.0) License.
By accessing the work you hereby accept the Terms. Non-commercial uses of the work are permitted
without any further permission from Dove Medical Press Limited, provided the work is properly
attributed. For permission for commercial use of this work, please see paragraphs 4.2 and 5 of our Terms.