Back to Journals » Nature and Science of Sleep » Volume 14
Altered Salivary Microbiota in Patients with Obstructive Sleep Apnea Comorbid Hypertension
Authors Chen X, Chen Y ![]() , Feng M, Huang X, Li C, Han F
, Feng M, Huang X, Li C, Han F ![]() , Zhang Q, Gao X
, Zhang Q, Gao X ![]()
Received 3 November 2021
Accepted for publication 11 March 2022
Published 8 April 2022 Volume 2022:14 Pages 593—607
DOI https://doi.org/10.2147/NSS.S347630
Checked for plagiarism Yes
Review by Single anonymous peer review
Peer reviewer comments 4
Editor who approved publication: Prof. Dr. Ahmed BaHammam
Xuehui Chen,1 Yanlong Chen,1 Mengqi Feng,1 Xin Huang,1 Changtao Li,2 Fang Han,3 Qian Zhang,4,5,* Xuemei Gao1,5,*
1Department of Orthodontics, Peking University School and Hospital of Stomatology, Beijing, 100081, People’s Republic of China; 2Department of Orthodontics, Beijing Haidian Hospital, Haidian Section of Peking University Third Hospital, Beijing, 100080, People’s Republic of China; 3Sleep Medicine Center, Department of Respiratory and Critical Care Medicine, Peking University People’s Hospital, Beijing, 100044, People’s Republic of China; 4Central Laboratory, Peking University School and Hospital of Stomatology, Beijing, 100081, People’s Republic of China; 5National Engineering Laboratory for Digital and Material Technology of Stomatology & Beijing Key Laboratory of Digital Stomatology, Beijing, 100081, People’s Republic of China
*These authors contributed equally to this work
Correspondence: Qian Zhang, Central Laboratory, Peking University School and Hospital of Stomatology, 22 Zhongguancun South Ave, Beijing, 100081, People’s Republic of China, Tel +861082195773, Email [email protected] Xuemei Gao, Department of Orthodontics, Peking University School and Hospital of Stomatology, 22 Zhongguancun South Ave, Beijing, 100081, People’s Republic of China, Tel +861082195350, Email [email protected]
Purpose: Microorganisms contribute to the pathogenesis of obstructive sleep apnea (OSA)-associated hypertension (HTN), while more studies focus on intestinal microbiome. However, the relationship between oral microbiota and OSA-associated HTN has yet to be elucidated. This study aimed to identify differences in salivary microbiota between patients with OSA comorbid HTN compared with OSA patients, and furthermore evaluate the relationship between oral microbiome changes and increased blood pressure in patients with OSA.
Patients and Methods: This study collected salivary samples from 103 participants, including 27 healthy controls, 27 patients with OSA, 23 patients with HTN, and 26 patients with OSA comorbid HTN, to explore alterations of the oral microbiome using 16S rRNA gene V3-V4 high-throughput sequencing. And ultra-high-performance liquid chromatography was used for metabolomic analysis.
Results: Alpha- and beta-diversity analyses revealed a substantial difference in community structure and diversity in patients with OSA comorbid HTN compared with patients with OSA or HTN. The relative abundance of the genus Actinomyces was significantly decreased in patients with HTN compared with healthy controls, and those with OSA concomitant HTN compared with the patients in OSA, but was not significantly different between patients with OSA and healthy controls. Linear discriminant analysis effect size and variance analysis also indicated that the genera Haemophilus, Neisseria, and Lautropia were enriched in HTN. In addition, Oribacterium was an unique taxa in the OSA comorbid HTN group compared with the control group. Metabolomic analysis of saliva identified compounds associated with cardiovascular disease in patients with OSA comorbid HTN.2-hydroxyadenine, was significantly increased in the group of patients with OSA compared with controls, and L-carnitine was significantly decreased in patients with OSA comorbid HTN compared with OSA patients.
Conclusion: This study highlighted noninvasive biomarkers for patients with OSA comorbid HTN. As the first study to find alterations of the salivary microbiome in patients with OSA comorbid HTN, it may provide a theoretical foundation for clinical diagnosis and treatment of this condition.
Keywords: OSA, hypertension, oral microbiome, 16S rRNA, metabolomics
Introduction
Systemic hypertension, a very common chronic disease, is a leading risk factor for stroke, heart failure, atrial fibrillation, chronic kidney disease, and other life-threatening diseases.1 It also coexists with obstructive sleep apnea (OSA), which is characterized by intermittent and repeated collapse of the upper airway, resulting in intermittent hypoxia (IH), hypercapnia, daytime sleepiness, and other consequences such as hypertension (HTN).2 Approximately 50% of adult patients with OSA have underlying HTN, and OSA is thought to be the cause of 75% of cases of treatment-resistant HTN.3 Daytime systolic blood pressure and diastolic blood pressure values have been proven to be significantly positively related to AHI and significantly negatively related to nadir nocturnal oxygen saturation.4 Furthermore, a study conducted in Iceland in 20145 was the first to apply cluster study analysis to identify subtypes of patients with OSA associated with different comorbidities. Since then, several studies have utilized subtype analysis and revealed that HTN is an important predictive value for subtype identification.6 Vavougious et al also found that comorbidities were the hallmarks of moderate and severe OSA phenotypes, and HTN was associated with the comorbidities subtype independently.6 The underlying mechanisms of OSA regulating HTN include increased chemosensory sensitivity leading to daytime sympathetic vasoconstriction, resistance to vascular inflammation, and excessive production of superoxide ions.7
Individuals harbor distinct microbial communities, with microorganisms affecting the host through synthesis or catabolism and direct host-microbial interactions and signals. Moreover, the imbalance of structures or functions of microbiota is related to various diseases,8 such as breast cancer,9,10 obesity,11 Sjogren’s syndrome,12 and so on. This provides a new thought for the diagnosis and treatment of diseases. Numerous studies have proposed that microbiota participate in the pathogenesis of HTN. Veillonella, Actinomyces, Haemophilus, and Neisseria are the most copious taxa among the nitrate-reducing bacteria of the dorsal tongue.13 Pamela et al found the concentration of Neisseria subflava was significantly higher in subgingival samples of normotensive subjects compared with patients with HTN.14 Also, recent studies demonstrated an important link between OSA and microbiomes.15 The nasal microbiome of subjects with severe OSA was rich in Streptococcus, Prevotella, and Veillonella, and these taxa were associated with inflammatory markers.16 Other research revealed a significant decrease of species diversity and abundance in the oropharyngeal microbiota of middle-aged men with OSA compared with subjects without OSA, but concurrently, the proportion of Neisseria was higher in the group with severe OSA.17
Some studies have reported that microbiota may participate in the pathogenesis of OSA-related HTN, with most of these studies focusing on gut microbes. A rat model of OSA verified that the blood pressure effect of a high-fat diet on rats could be reproduced by intestinal flora transplantation.18 Probiotics C. butyricum and HylonVII reduced gut dysbiosis, loss of epithelial goblet cells, and thinning of the mucus barrier caused by OSA,19 and prebiotics, probiotics, and transplantation of fecal microbiota may have antihypertensive effects on OSA-related HTN.20 OSA combined with a high-salt diet increased blood pressure through increasing the concentration of blood trimethylamine oxide (TMAO) and depleting Lactobacillus in the gut microbiome of rats.21
As the beginning of the digestive tract, the oral cavity is also rich in microorganisms and variable due to changes of the host microecological environment. Oral microbes are linked to some diseases such as diabetes, systemic sclerosis, and cancer.22,23 Furthermore, research has shown that oral microbiota play important roles in various pathways, including direct invasion, platelet aggregation, oxidative stress response, and inflammatory responses, resulting in cardiovascular disease (CVD) of patients.24,25 Oral bacteria were recently reported to reduce Th17 cells and increase the M1/M2 macrophage ratio in the small intestine, thereby promoting chronic inflammation.26 Ko et al collected oral mucosal samples (including tongue, buccal mucosa, palate) to analyze oral microbiota in patients with OSA-associated HTN.27 And saliva samples have been routinely taken as a representative average of the entire ecosystem of the oral cavity.
Based on the above, the current study aimed to investigate the association of salivary microbiota with the distinct subtype of OSA combined with HTN, which might indicate new guidance or directions for the treatment of OSA-related HTN.
Materials and Methods
Participants, Study Design, and Clinical Assessment
The study was designed as cross-section study research and was approved by the Institutional Review Board of Peking University Hospital of Stomatology (PKUSSIRB - 201950155). Written informed consent was obtained from all participants. Research conducted in this study adhered to the tenets of the Declaration of Helsinki.
A total of 103 consecutive participants were recruited to the study from two co-operation general hospitals between June 2019 and November 2020. Inclusion criteria were: >18 years old, male, volunteered in the projects, and met the requirements of each group. Exclusion criteria for the study were: a) inappropriate disease history or serious disease(s)/conditions of all systems other than HTN—for example, serious cardiovascular disease (myocardial infarction, etc.), respiratory disease (chronic obstructive pulmonary disease, COVID-19, etc.), other sleep conditions (insomnia, etc.), serious neuropsychiatric diseases, serious endocrine system conditions (diabetes, etc.) or the presence of a malignant tumor; b) inappropriate oral signs, such as severe periodontitis, Sjogren’s syndrome, oral ulcer, presence of a dental prosthesis in the mouth, or other oral diseases; c) inappropriate lifestyle habits and medical history, including vegan diet, periodontal treatment in the past 6 months, and use of antibiotics within the last 3 months.
OSA was defined by standard American Academy of Sleep Medicine criteria: AHI≥5 was defined as OSA.28 HTN was diagnosed by ambulatory blood pressure monitoring, defined as 24-hour systolic blood pressure (SBP) ≥130 mmHg or diastolic blood pressure (DBP) ≥80 mmHg or use of medications for HTN, which is equal to clinic SBP ≥140 mmHg or DBP ≥90 mmHg. The measurement of blood pressure accorded with guidelines. Participants sat in a chair relax for at least 5 min, avoided caffeine, exercise and did not smoke for at least 30 min.29
Four groups were included in the study. There were 27 patients in OSA group who went through full-night hospitalization of polysomnography (PSG) in Sleep Center of Peking University People’s Hospital. The blood pressure of these participants remained at normal levels. The complication group comprised 26 patients who had both OSA and HTN. The control group included 27 patients that did not exhibit positive findings by PSG or blood pressure monitoring. Finally, the HTN group contained 23 patients who came from the Cardiology Department of Beijing Haidian Hospital having been diagnosed by 24-h ambulatory blood pressure monitoring; subjects were recruited to this group when their clinic blood pressure was ≥140/90 mmHg and measured their real-time blood pressure and recorded the data as their blood pressure before saliva collection. Home sleep test indicated that they did not meet the diagnostic conditions of OSA.
Saliva Sample Collection and DNA Extraction
All subjects did not eat, drink, or brush their teeth for at least 2 h prior to saliva collection at 7:00–9:00 a.m., then rinsed their mouth with pure water, and rested for at least 10 min before saliva collection. A minimum of 3 mL unstimulated whole saliva samples were collected into sterile centrifugal tubes, then immediately placed on ice and processed within 2 h. Saliva samples were centrifuged at 12,000 g for 30 min at 4°C, and the resulting precipitate and supernatant were stored separately at −80°C. Genomic DNA was extracted using a QIAamp DNA mini kit (Qiagen, Hilden, Germany) according to the manufacturer’s instructions. The purity and concentration of extracted DNA was tested by a NanoDrop 8000 spectrophotometer (NanoDrop Technologies, Wilmington, DE, USA), and the molecular size of the DNA was estimated by 1% agarose gel electrophoresis. DNA samples were stored at −80°C until further use.
16S rRNA Gene Amplification and Sequencing, and Processing of Sequence Data
Extracted DNA was used as template to amplify the V3-V4 variable region of bacterial 16S rRNA genes. The forward primer was 5′-ACTCCTACGGGAGGCAGCA-3′ and the reverse primer was 5′-GGACTACHVGGGTWTCTAAT-3′. The thermal cycle consisted of an initial denaturation at 98°C for 5 min, followed by 25 cycles of denaturation at 98°C for 30s, annealing at 53°C for 30s, and extension at 72°C for 45s, then a final extension for 5 min at 72°C. After purification using Vazyme VAHTSTM DNA Clean Beads (Vazyme, Nanjing, China) and quantification by the Quant-iT PicoGreen dsDNA Assay Kit (Invitrogen, Carlsbad, CA, USA), amplicons were pooled in equal amounts, and paired-end (2×250 bp) sequencing was performed using an Illumina NovaseqTM 6000 platform (Illumina, San Diego, CA, USA) at Shanghai Personal Biotechnology Co., Ltd (Shanghai, China). After trimming off the barcodes and primers, the raw sequence data were filtered, denoised, merged, and chimeras removed using the DADA2 plugin. Amplicon sequence variants (ASVs) were classified taxonomically according to the Human Oral Microbiome Database (HOMD) (V15.2).
Metabolomic Analysis of Saliva
Metabolomic analysis was performed on random samples from each group, including six samples from the control group, six from the HTN group, six from the OSA group, and seven samples from the complication group. The supernatant of the salivary samples was thawed at 4°C and mixed in equal portions of 100 μL with 400 μL cold methanol/acetonitrile (1:1, V/V) to remove protein. The mixture was centrifuged for 15 min (14,000 g, 4°C) and the resulting supernatant was dried in a vacuum centrifuge. For liquid chromatography-mass spectrometry (LC-MS) analysis, the samples were re-dissolved in 100 μL acetonitrile/water (1:1, V/V) solvent. Analyses were performed using an ultra-high-performance liquid chromatography (UHPLC) system (1290 Infinity LC, Agilent Technologies) coupled to a quadrupole time-of-flight mass spectrometer (AB Sciex TripleTOF 6600). The samples were separated on the Agilent 1290 Infinity LC by hydrophilic interaction liquid chromatography (HILIC) column with a column temperature of 25°C, flow rate of 0.5 mL/min, injection volume of 2 μL, and mobile phase composition of 25 mM ammonium acetate, 25 mM ammonia, water, and acetonitrile. QC samples were inserted into the sample queue to monitor and evaluate the stability of the system and the reliability of the experimental data.
Statistical Analysis
One-way analysis of variance (ANOVA) in SPSS 22.0 (IBM, Armonk, NY, USA) was used to evaluate the differences of clinical indicators among the four experimental groups. Sequence data analyses were mainly performed using QIIME2 (2019.4)30 and R packages (v3.2.0). Multivariate linear regression was performed to test associations between clinical covariates (age, BMI) and the salivary microbiome, with a q-value <0.10 used as significance cut-off. (MaAsLin, Galaxy Version 1.0.1).16 Alpha diversity was measured with the indices of Chao1, Shannon, and Richness, respectively. Beta diversity analysis was performed to investigate the structural variation of microbial communities across samples using Bray-Curtis metrics and was visualized using principal coordinates analysis (PCoA). Comparisons of the similarities between different groups were conducted using Analysis of similarities (Anosim) based on Bray-Curtis metrics. Kruskal–Wallis tests in SPSS 22.0 were used to analyze the different taxa at the genus level, with p<0.05 considered statistically significant. Linear discriminant analysis (LDA) effect size (LEfSe) analysis was used to determine the organisms most likely to explain differences among the groups. A nested cross-validation based on the random forest model was conducted to illustrate the diagnostic value of the salivary microbiome, using a receiver operating characteristic (ROC) curve to evaluate the diagnostic value of the salivary microbiome. Microbial functions were predicted by PICRUSt2 with the Kyoto Encyclopedia of Genes and Genomes (KEGG) database, and STAMP software was used to identify the difference of pathways by White nonparametric t-test, with p<0.05 considered statistically significant. For metabolomic analyses, after normalizing the total peak intensity to processed data, the R package was used for multivariate data analysis, including Pareto-scaled principal component analysis (PCA) and orthogonal partial least-squares discriminant analysis (OPLS-DA). When VIP value >1, metabolites were further tested at the univariate level by Student’s t-test to measure the significance of each metabolite; p<0.05 was considered statistically significant.
Results
Demographic and Clinical Characteristics of the Study Participants
A total of 103 subjects were recruited to the study. There were 27 patients in the control group, 27 in the OSA group, 23 in the HTN group, and 26 in the complication group (OSA+HTN). General information for the different groups is shown in Table 1. No significant differences were observed in terms of age, body mass index (BMI), and AHI between the OSA group and the complication group, However, SBP and DBP were significantly increased in the complication group compared with the OSA group (p<0.001 and p=0.002 for SBP and DBP, respectively). In addition, compared with the HTN group, the complication group had a considerably higher BMI and AHI (p=0.031 and p=0.001, respectively), despite no significant differences in age, SBP, or DBP. In consideration of age and BMI, were significantly differences among groups, multivariate linear regression analysis revealed that age and BMI did not affect the difference in salivary microbiomes among groups (q >0.10).
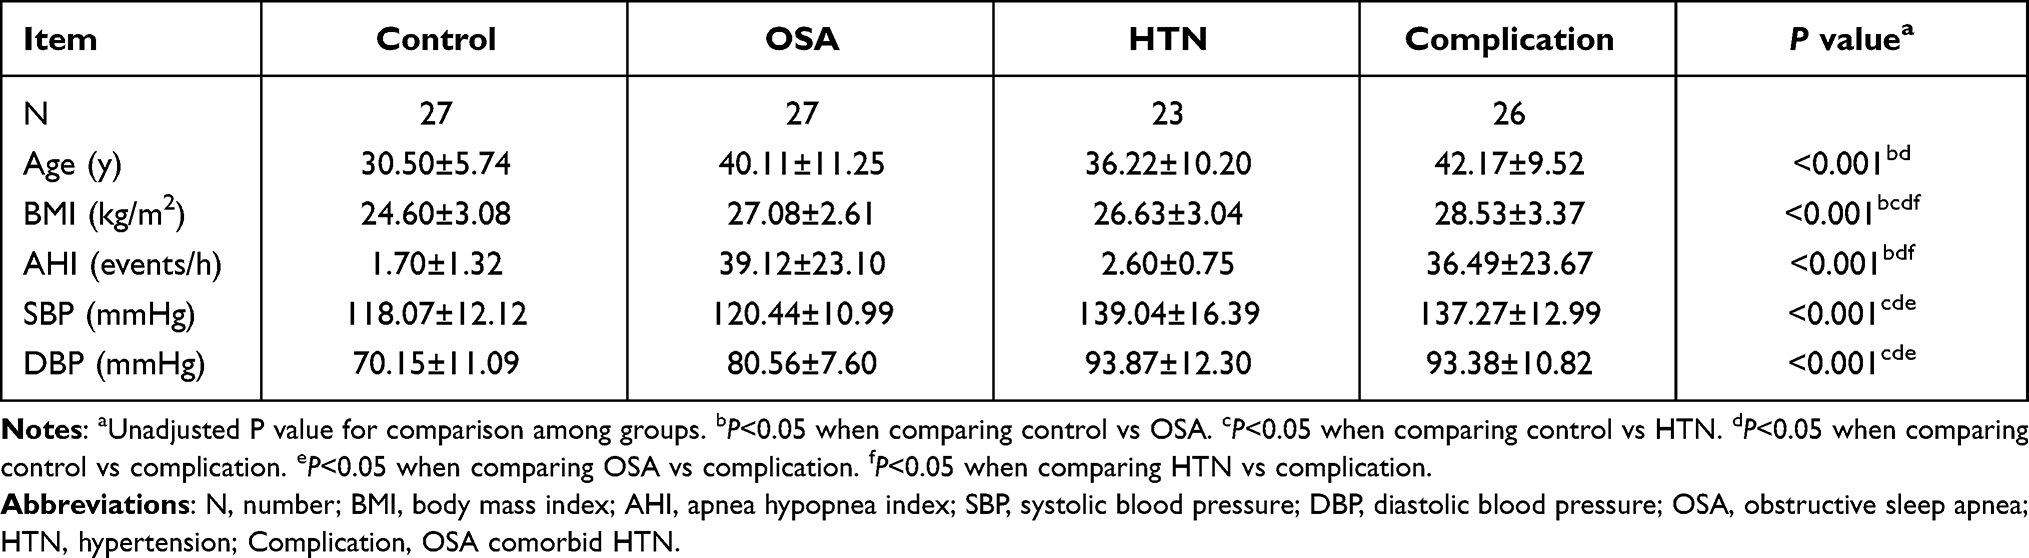 |
Table 1 Demographic and Clinical Characteristics of the Study Participants |
Diversity and Variation of Salivary Microbiome
A total of 12,732,407 raw reads were generated from 103 samples, with an average of 123,616 (range from 99,143 to 161,937) sequences per sample. The DADA2 plug-in of QIIME2 was used to select representative sequences, and after filtering, there were 8,683,851 clean reads in total, with an average of 83,402 (range from 57,599 to 119,679) reads per sample. Finally, 51,186 ASVs were detected among the 103 samples. According to the Human Oral Microbiome Database (HOMD) (V15.2), all sequences were classified into taxa. In total, there were 15 phyla, 35 classes, 64 orders, 119 families, and 247 genera detected in the saliva of the 103 patients.
The shape of the rarefaction curve (Supplementary Figure 1) demonstrated that the plateauing stage had been reached, indicating that the sequencing depth of all samples was reasonable and the sequencing results could reflect the microbial information in the saliva samples. Alpha diversity among the groups was described by evenness, richness, and diversity. The Chao1 index of the HTN group was considerably lower than that of the control group (p<0.001), whereas there was no significant change in Chao1 index in the OSA and complication groups compared with the control group (p=0.15 and p=0.42, respectively). The Chao1 index was substantially lower in the HTN group compared with the complication group (p=0.014), whereas the Richness index was significantly lower in HTN group compared with control and complication groups (p=0.001 and p=0.0087, respectively). The Shannon index did not reveal a significant variation in alpha diversity among the four groups (p=0.43) (Figure 1A–C). Variation of salivary microbial community structure was investigated using PCoA based on the Bray-Curtis distance (Figure 1D and E). Samples obtained from patients in the OSA and complication groups clearly clustered away from those obtained from the control group, highlighting a significant difference in the phylogenetic structures of the salivary microbial communities (Anosim, p=0.026 for control vs OSA group; p=0.014 for control vs complication group, respectively). In addition, there were significant differences among the control, HTN, and complication groups (Anosim, p=0.001 for control vs HTN group; p=0.021 for HTN vs complication group, respectively).
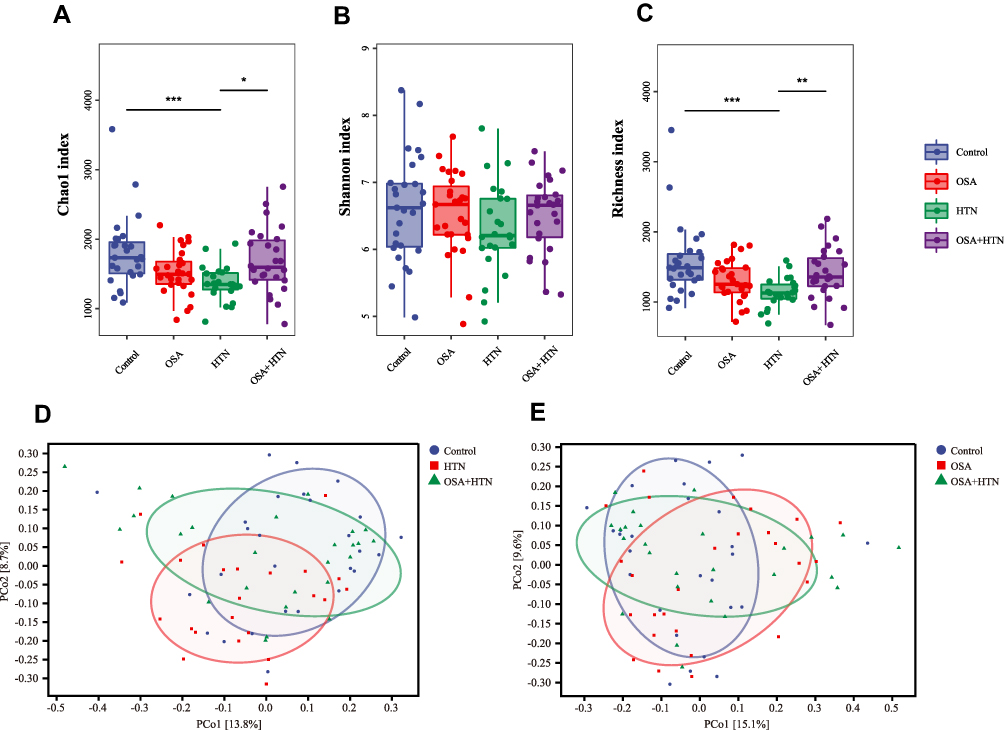 |
Figure 1 The Alpha and Beta diversity. The Alpha diversity was estimated by Chao1 index (A), Shannon index (B) and Richness index (C). Both Chao1 index and Richness index was significantly decreased in HTN group (p<0.001) compared with control group. Compared with complication group (OSA+HTN), Chao1 index and Richness index was significantly decreased in HTN group (p=0.014, p=0.0087, respectively). Alpha diversity by Shannon index did not show a significant difference among these 4 groups (p=0.43). Beta diversity was calculated using bray_curties distance by PCoA to analyze the variation of salivary microbial community structure (D and E). *p<0.05, **p<0.01, ***p<0.001. Abbreviations: OSA, obstructive sleep apnea; HTN, hypertension. |
Taxa Composition of Salivary Microbiome
The top 10 phyla in terms of abundance are presented in Figure 2A. Firmicutes, Actinobacteria, Proteobacteria, and Bacteroidetes were four components in the saliva microbiome with a relative abundance greater than 10%. At the genus level, Figure 2B shows the top 20 most abundant taxa. The genera with highest abundance in the HTN group were Haemophilus, Lautropia, Neisseria, Fusobacterium, and Aggregatibacter based on the heatmap. The genera Peptostreptococcaceae_[XI][G-1], Actinomyces, Absconditabacteria_(SR1)_[G-1], Granulicatella, Corynebacterium, and Peptostreptococcus had the highest abundance in the OSA group, while Porphyromonas, Leptotrichia, and Treponema exhibited a higher abundance in the complication group (Figure 2C).
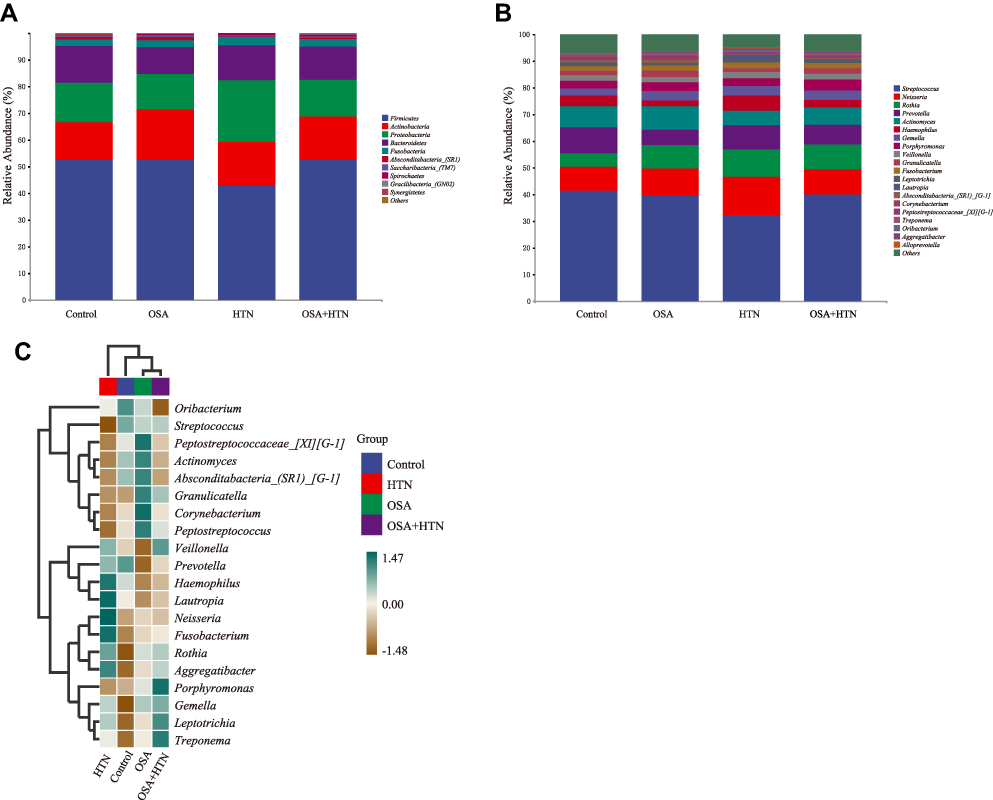 |
Figure 2 Phylogenetic profile of salivary microbes among patients with OSA (n=27), HTN (n=23), OSA with HTN (n=26) and healthy controls (n=27). Composition of Salivary microbiota at the phylum level (A) and genus level (B). The heatmap shows relative abundance of microbiota at the genus level in each group (C). Abbreviations: OSA, obstructive sleep apnea; HTN, hypertension. |
Comparison of Bacterial Flora Characteristics Among Different Groups
Compared with the control group, the abundances of Rothia, Granulicatella, and Peptostreptococcus in the OSA group were significantly increased (p=0.027, p=0.013, and p=0.014, respectively), while that of the genus Haemophilus was decreased (p=0.032). Correspondingly, Rothia was also increased in the complication group (p=0.014 vs the control group), and Absconditabacteria_(SR1)_[G-1] and Oribacterium were significantly decreased (p=0.033 and p=0.016, respectively), compared with controls. While the other three genera Granulicatella, Peptostreptococcus, and Haemophilus had no significant difference in the complication group compared with the control group. Moreover, the abundances of Actinomyces, Absconditabacteria_(SR1)_[G-1], and Peptostreptococcaceae_[XI][G-1] were significantly decreased (p=0.029, p=0.009, and p=0.02, respectively) in the complication group compared with the OSA group.
Compared with the control group, three genera, including Rothia, Neisseria, and Lautropia, were significantly increased in the HTN group (p=0.004, p=0.043, and p<0.001, respectively), while Actinomyces was significantly decreased (p=0.044). Furthermore, compared with the HTN group, the abundances of Lautropia and Haemophilus were significantly decreased in the complication group (p=0.01 and p=0.003, respectively) and that of Peptostreptococcus was significantly increased (p=0.019) (Figure 3). Detailed statistics represented in Supplementary Table 1.
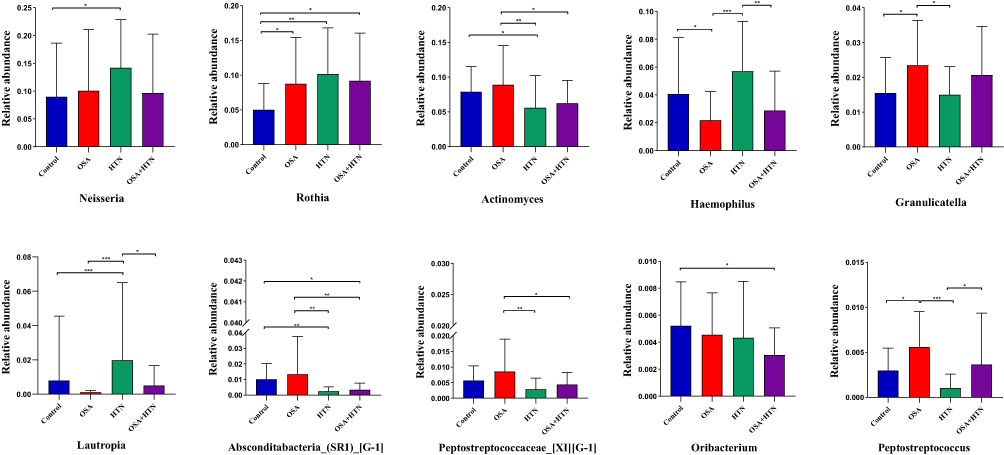 |
Figure 3 Comparison of the relative abundance of the top 20 genera with changes in relative abundance. *p<0.05, **p<0.01, ***p<0.001. Abbreviations: OSA, obstructive sleep apnea; HTN, hypertension. |
The LEfSe method was applied to analyze more specific differences in microflora composition and look for potential biomarkers of the four experimental groups. A cladogram representative of salivary microbial structure and predominant bacteria showing the greatest differences in taxa among the four groups was produced based on an LDA threshold of 2 (Figure 4). At the genus level, the predominant bacteria of the OSA group were Peptostreptococcaceae__XI__G_1_, Peptostreptococcus, Parvimonas, Mogibacterium, Pseudopropionibacterium, and Peptidiphaga, while Neisseria, Rothia, Haemophilus, Lautropia, Campylobacter, Kingella, Cardiobacterium, Ralstonia, Flavitalea, and Anaeroglobus were enriched in the HTN group. In addition, the genus Johnsonella occupied an important position in the complication group.
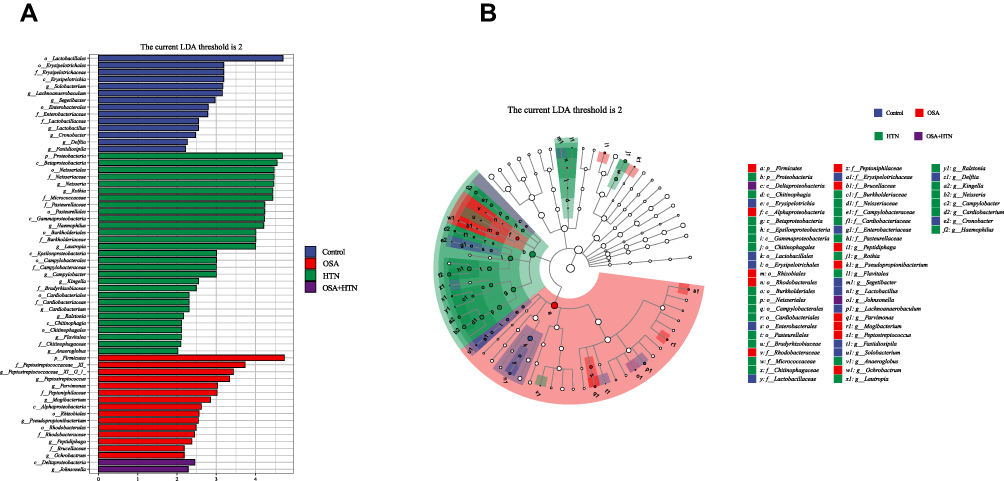 |
Figure 4 Predicted salivary microbiome taxa by linear discriminant analysis effect size (LEfSe), of OSA group (n=27), HTN group (n=23), OSA with HTN group (n=26) and healthy controls (n=27). (A) Histogram of taxonomic. (B) Cladogram of taxonomic. Each dot represents a taxonomic hierarchy, from inner to outer circles represented taxa from phylum to genus level. Linear discriminant analysis (LDA) score>2 indicates significant bacterial differences among four groups. Prefix p_phylum, c_class, o_order, f_family and g_genus. Abbreviations: OSA, obstructive sleep apnea; HTN, hypertension. |
Microbial functions were predicted by PICRUSt2 using the KEGG database and indicated that pathways of nitrogen metabolism, citrate cycle, bacterial secretion system, toluene degradation, phenylalanine metabolism, lipopolysaccharide biosynthesis, and fatty acid metabolism had significantly higher abundance in the HTN group compared with the control group. In addition, compared with control group, the pathways of metabolism of xenobiotics by cytochrome P450, polyketide sugar unit biosynthesis, phosphonate and phosphinate metabolism, and proteasome exhibited significantly higher abundance in the OSA group. Furthermore, the KEGG pathways of vasopressin-regulated water reabsorption, steroid biosynthesis, inositol phosphate metabolism, and lipoic acid metabolism presented significantly lower abundance in the complication group compared with the OSA group (Supplementary Figures 2–6).
Identification of Genus-Based Microbial Markers
To illustrate the diagnostic value of the salivary microbiome for the OSA and complication groups, random forest classifier models were constructed to identify OSA samples from control samples (model 1), complication samples from HTN samples (model 2), and complication samples from OSA samples (model 3), and a nested cross-validation was then conducted on these random forest models. In model 1, all patients with OSA were included, that is, patients with OSA in the model included both those from the OSA group and those from the complication group, and this combined grouping was renamed all-OSA group. The model was shown by ROC curve analysis, and the area under the ROC curve (AUC) value was 91.9% (95% CI, 85.35–98.51%). In model 2, five genera were selected as the optimal marker set and achieved an AUC value of 94.7% (95% CI, 86.57–100%). These five genera were Cronobacter, Escherichia, Kingella, Oribacterium, and Peptostreptococcus. Moreover, in model 3, Anaeroglobus, Bacteroides, Fretibacterium, Solobacterium, and Veillonella were selected as optimal marker genera and the AUC value was 78.5% (95% CI, 65.85–91.13%) (Figure 5A–C).
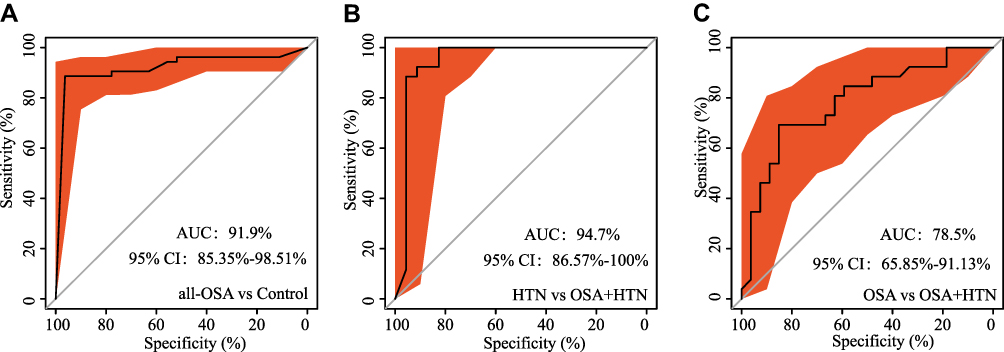 |
Figure 5 Receiver operating characteristic (ROC) for ASVs-based markers identified by random forest models. (A) Prediction of the key genera for all-OSA (OSA+complication) group from control group, area under the parametric curve (AUC)=91.9% (95% CI, 85.35–98.51%). (B) AUC value achieved 94.7% (95% CI, 86.57–100%) between HTN group and complication (OSA+HTN) group. (C) AUC value achieved 78.5% (95% CI, 65.85–91.13%) between OSA group and complication (OSA+HTN) group. Abbreviations: OSA, obstructive sleep apnea; HTN, hypertension. |
Salivary Metabolomics
PCA of the metabolomics samples revealed that the QC samples were closely clustered in the positive mode, indicating that the experimental results were reproducible. In addition, there was a tendency of separation among the groups. Data were interrogated based on the orthogonal partial least-squares discrimination analysis (OPLS-DA), which established intergroup separation between the OSA group and the control group (Figure 6A), and between the complication and control groups (Figure 6B). The discriminant metabolites that account for the intergroup separation, between the complication and HTN groups, and between the complication group and the OSA group, were also identified by OPLS-DA (Figure 6C and D). Four discriminant metabolites were measured in the OSA group relative to the control group, (2-hydroxyadenine, erucic acid, 7-methylxanthine, and pyruvaldehyde), while 26 discriminant metabolites were measured in the HTN group relative to the control group. The levels of 2-hydroxyadenine and 7-methylxanthine were significantly increased in the patients with OSA (p=0.004 and p=0.04, respectively) compared with the control group. Furthermore, there were 6 metabolites that were altered in the complication group compared with the OSA group, while four discriminant metabolites (L-carnitine, Tyr-Gln, N-(omega)-hydroxyarginine, and His-Ala) were measured in the complication group compared with the HTN group; all four of these metabolites were significantly increased in the complication group compared with HTN group.(p=0.038, p=0.039, p=0.045, and p=0.048, respectively). The changes in metabolites are shown in Supplementary Table 2 and Supplementary Figures 7–11.
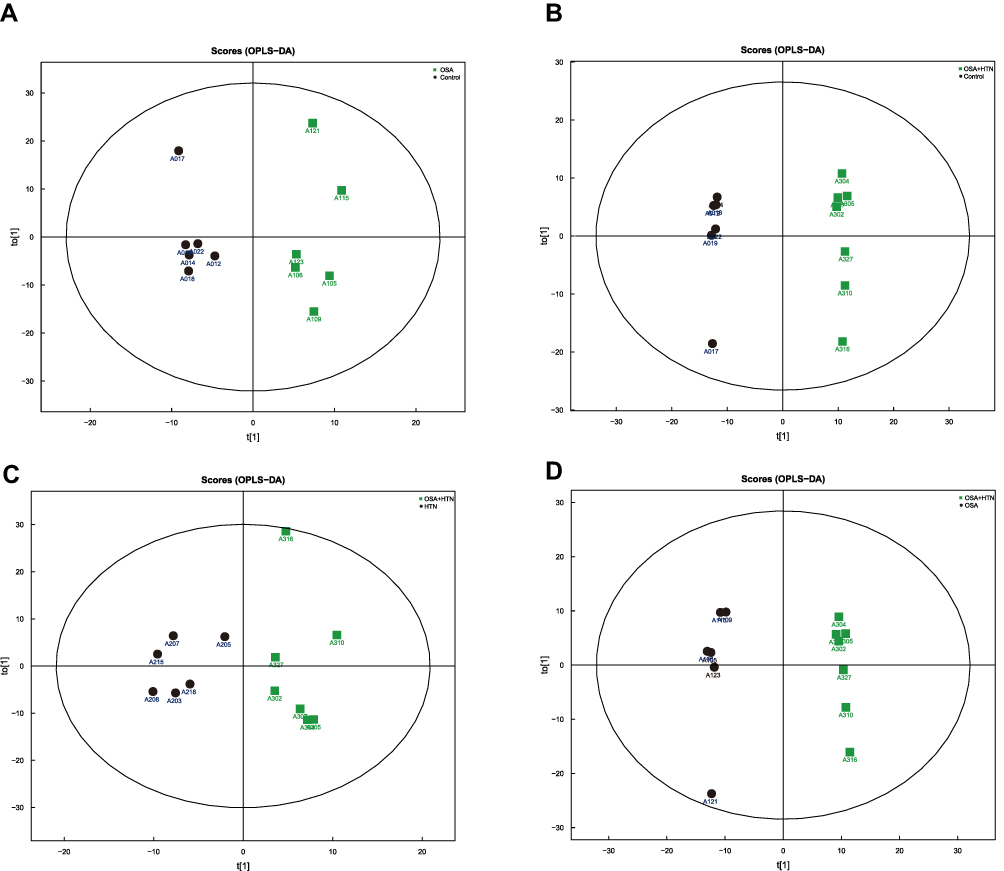 |
Figure 6 Score plots of the orthogonal partial least-squares discriminant analysis (OPLS-DA) model for saliva samples. (A) OPLS-DA model for OSA and control group, the model parameters were: R2X=0.344 R2Y=0.949 Q2=0.352. (B) OPLS-DA model for complication (OSA+HTN) and control group, the model parameters were R2X=0.619 R2Y=0.998 Q2=0.772. (C) OPLS-DA model for complication (OSA+ HTN) and HTN group, the model parameters were: R2X=0.609 R2Y=0.993 Q2=0.587. (D) OPLS-DA model for complication (OSA+HTN) and OSA group, the model parameters were: R2X=0.378 R2Y=0.881 Q2=−0.0792. Abbreviations: OSA, obstructive sleep apnea; HTN, hypertension. |
Discussion
In recent years, attention has increased towards OSA combined with HTN.6,31 This subtype of OSA is common and greatly impacts health. However, these patients have fewer typical OSA symptoms such as sleep disturbance and daytime sleepiness, so it may not be easily detected in clinical practice, and it is also somewhat inconvenient to identify in the case of troublesome polysomnography. Therefore, the identification of biomarkers for this subtype of OSA is desirable and may facilitate a more targeted treatment approach. Studies of the gut microbiome of patients with OSA have revealed that the microbiome is associated with OSA-related HTN, but there are limited studies examining oral microbiomes in patients with OSA.
Saliva samples have been routinely taken as a representative average of the entire ecosystem of the oral cavity, therefore, the current study conducted salivary microbiome analysis in patients with OSA combined with HTN to confirm the hypothesis that oral microbiomes might be associated with the distinct subtype of OSA combined with HTN. Alpha diversity of patients with OSA or HTN decreased compared with the control group, indicating a decrease in the richness of the microflora, which was similar to the results of previous studies.16,32 Simultaneously, beta-diversity analysis suggested there was significantly different community evolution structures among the different groups of patients. Ko et al found the abundance of the Porphyromonas was significantly higher in oral mucosal samples of OSA patients with or without HTN compared with controls. Furthermore, the abundance of the Syntrophomonas was significantly higher in patients with mild OSA plus HTN compared with that in patients with mild OSA without HTN.27 We did not find Porphyromonas has significant different among groups probably because saliva samples were taken in our study. Moreover, individuals with HTN but without OSA were recruited in our study to verify whether the microbiological alterations were caused by HTN or OSA.
In the current study, some taxa correlated with OSA-related HTN were defined. Rothia was relatively more abundant in all three disease groups (OSA, HTN, and complication) compared with the control group. A previous study reported that Rothia was correlated with apnea-hypopnea of patients with severe OSA,16 while another study showed that Rothia was present at a high level in the gut microbiome of people with HTN,33 which was congruent with the current study. Therefore, Rothia may indicate the emergence of a disease state or unhealthy outcomes. In addition, in most of the oral microbial studies on diseases, an increased abundance of Oribacterium is associated with oral lesions.34,35 In the current study, Oribacterium was a specific taxa in the complication group compared with control group, and while the underlying mechanism for the OSA-related HTN was not identified, it might be that Oribacterium can be used as a biomarker of the complication group as it was proved in random forest model 2 to distinguish patients of the complication group from those in the HTN group. Furthermore, in the current study, the abundance of Actinomyces was significantly lower in the complication group compared with the OSA group, and as one of the most copious taxa among the nitrate-reducing bacteria, it was also decreased in the HTN group. Nitrate-reducing bacteria such as Actinomyces were found on the dorsum of the tongue, cleaning of the tongue and the use of chlorhexidine mouthwash prevents increased proportion of nitrate reducing species.12 However, there was no significant difference between the OSA and control groups. Therefore, we speculate that the decrease of Actinomyces in patients with OSA is associated with a potential mechanism of OSA-related hypertension, and it may be possible to predict the tendency to develop HTN in patients with OSA by the reduction of Actinomyces in the salivary microbiome of these individuals.
As the second largest biobank in the human body, microbes have attracted increasing attention regarding the occurrence and development of diseases. Various microorganisms exist in human tissues and organs, including the skin, digestive tract, oral cavity, and so on. The oral microbiome is related to nitrate metabolism and cardiovascular health. Approximately 1/4 of the nitrate intake returns to the mouth via an entero-salivary nitrate-nitrite-nitric oxide (NO) pathway.13 Nitrate-reducing bacteria in oral cavity can reduce nitrate to nitrite, which is absorbed into the bloodstream through the digestive tract and converted into NO,36,37 a multifunctional signaling molecule involved in cardiovascular homeostasis and an effective endogenous vasodilator. Blockage of the nitrate-nitrite-NO pathway by the use of antimicrobial mouthwash was paralleled by a small increase in SBP in treated men and women with HTN.38 Findings from the current study are consistent with this theory, hence the development of the hypothesis that the decrease of Actinomyces, which leads to the decrease of NO production, is associated with the increase of blood pressure in patients in the HTN and complication groups. The relative abundance of Absconditabacteria_(SR1) in the oral flora of patients with inflammatory bowel disease (IBD) was higher than normal, and was positively correlated with the levels of inflammatory cytokines such as fecal calprotectin.39 Absconditabacteria_(SR1) may be related to the inflammatory state caused by OSA, but there was no evidence of a possible mechanism of OSA-related HTN associated with Absconditabacteria_(SR1)_[G-1] and Peptostreptococcaceae_[XI][G-1] in the previous literature, therefore we regarded these taxa more likely as outcome indicators. Streptococcus and Prevotella are known to be related to the production of acetate, one of the short-chain fatty acids (SCFAs) that result from anaerobic fermentation of dietary fibers by gut microbiota and which has an important vasodilator effect.40,41 However, no significant differences of Streptococcus and Prevotella were identified among the four groups in the current study.
In addition, Haemophilus, Neisseria, and Lautropia were speculated to be biomarkers of HTN. Haemophilus, another nitrate-reducing bacteria,13 had a significantly lower abundance in the complication group compared with the HTN group, while simultaneously presented a significantly lower level in the OSA group compared with the control group. Consequently, we speculate that OSA might cause HTN by reducing the production of Haemophilus. Furthermore, the abundance of Neisseria in the HTN group was significantly higher than that in the control group, which was consistent with previous studies on intestinal microorganisms in patients with HTN.18 Concurrently, in a study of oral microorganisms and salivary NO, Neisseria was more abundant in subjects with HTN compared with normal subjects, suggesting that the concentration of this bacteria was a biomarker for the development of HTN.14 Moreover, Lautropia exhibited a significantly higher relative abundance in the HTN group compared with the control group in the current study. This was consistent with a previous study showing that Lautropia was higher in abundance in pharyngeal swabs from patients with pulmonary HTN that from control samples.32 In OSCC cell lines, Lautropia mirabilis upregulated IL-6 and TNF-α, which are cytokines related to the inflammatory response.42 All these genera were verified in LEfSe analysis in the current study.
Bacterial metabolites may also be responsible for OSA-related HTN. Oral microorganisms may contribute to the occurrence of cardiovascular disease through direct invasion, immune responses, promotion of platelet aggregation, inflammatory responses, and oxidative stress responses.43 OSA may induce related inflammatory factors such as C-reactive protein, TNF-α, and IL-6,44 through oral bacterial pathogens, like Rothia, Haemophilus, and Actinomyces, which can promote the occurrence and development of HTN. DNA and lipopolysaccharide from oral bacterial pathogens activate nuclear factor-κB (NF-κB) and activator protein 1 (AP1), which lead to increased production of inflammatory factors and activation of neutrophils, leading to the production of numerous reactive oxygen species (ROS).45 Intermittent hypoxia induced by OSA induces systemic inflammation and sympathetic hyperactivity by enhancing the production of ROS. The ROS-HIF-1-endothelium signaling pathway and the ROS-TLR-NF-κB signaling pathway are responsible for hypertension and cardiovascular dysfunction in patients with OSA.46,47 In addition, hypoxia induced by OSA can lead to mitochondrial dysfunction, which affects related enzyme systems, such as endothelial NO synthase production.48
Previous study compared clinical chemistry measurements of enzymes, metabolites between patients with HTN and controls,49 few studies used metabolomic to analysis metabolites in patients with HTN, especially OSA related HTN. Ultra-high-performance liquid chromatography was used for metabolomic analysis to screen for differential metabolites in our study, including indicators that are not routinely used in clinical. Metabolomic analysis found evidence of cardiovascular damage associated with OSA. As previously stated, OSA enhances ROS production. 2-Hydroxyadenine, a purine produced in cells by reactive oxygen,50 was significantly increased in the group of patients with OSA in the current study. Meanwhile, L-carnitine was significantly decreased in the complication group compared with the OSA group, and this metabolite triggers cardioprotective effects through reduced inflammation, oxidative stress, and necrosis of cardiac myocytes, and can also reduce HTN.51 The decrease of L-carnitine in the complication group may be responsible for the increase of blood pressure in these patients.
This study does have some limitations. OSA may have an impact on multiple systems of the whole body. In the study, HTN was confirmed with 24-h ambulatory blood pressure monitoring, OSA was confirmed with full-night hospitalization PSG, and the medical history and complications of all subjects were carefully taken in the study. However, it is inevitable that other complications, although very minor, might also interfere with the data. Such as age and BMI, thought they were proved no influence on the comparison among groups they should be better matched in the future study. Moreover, salivary flora has the advantage of easy collection and may induce changes in the gut microbiome through swallowing, but the performance of bacteria in the mouth is not necessarily identical to their role(s) in the intestine. This study allows the screening different flora, but causal relationships between salivary flora and disease require further study by verification of CPAP therapy intervention or through in vivo experiments. In addition, this study does not represent the performance of other genders, ages, and regional races.
Conclusions
This study demonstrates the characteristic changes in salivary microbiota of patients with OSA, patients with HTN, and patients with both OSA and HTN. Findings from the study led to the hypothesis that the decrease of Actinomyces may be associated with OSA-related HTN. To identify specific microbial markers for the different groups of patients, models were constructed to distinguish all-OSA patients from control subjects, patients with OSA and HTN (complication group) from patients with OSA, and patients with OSA and HTN (complication group) from patients with HTN. The diagnostic efficacy of these models was validated and highlights potential noninvasive diagnostic biomarkers for the subtype of OSA that is associated with HTN. Moreover, bacterial metabolites may also be responsible for OSA-related hypertension. OSA produced ROS can increased 2-hydroxyadenine indirectly. And the decrease of L-Carnitine may be associated with the hypertension in OSA patients.
Abbreviations
OSA, obstructive sleep apnea; HTN, hypertension; BMI, body mass index; AHI, apnea hypopnea index; SBP, systolic blood pressure; DBP, diastolic blood pressure.
Data Sharing Statement
The sequencing data from this study have been deposited in Genome Sequence Archive in National Genomics Data Center, China National Center for Bioinformation/Beijing Institute of Genomics, Chinese Academy of Sciences (GSA: CRA006039) that are publicly accessible at https://ngdc.cncb.ac.cn/gsa.
Acknowledgments
We thank Dr Bing Zhou, Yuhua Zuo, Xueli Zhang, Long Zhao, Jing Li (Sleep Center of Peking University People’s Hospital), Dr Qingchun Ma (Cardiology Department of Peking University People’s Hospital), Dr Liping Song, and Ping Han (Cardiology Department of Beijing Haidian Hospital) for help in sample collection and generous volunteer subjects who recruited in this study. We also thank all the participants in the trial.
Author Contributions
All authors made a significant contribution to the work reported, whether that is in the conception, study design, execution, acquisition of data, analysis and interpretation, or in all these areas: took part in drafting, revising or critically reviewing the article; gave final approval of the version to be published; have agreed on the journal to which the article has been submitted; and agree to be accountable for all aspects of the work.
Funding
This work was supported partly by National Program for Multidisciplinary Cooperative Treatment on Major Diseases (PKUSSNMP-201902), National Natural Science Foundation of China (82170102), and Science Foundation of HaiDian Hospital (KYM2017014).
Disclosure
The authors declare that they have no conflicts of interest in this work.
References
1. Fuchs FD, Whelton PK. High blood pressure and cardiovascular disease. Hypertension. 2020;75(2):285–292. doi:10.1161/hypertensionaha.119.14240
2. Veasey SC, Rosen IM. Obstructive sleep apnea in adults. N Engl J Med. 2019;380(15):1442–1449. doi:10.1056/NEJMcp1816152
3. Pedrosa RP, Drager LF, Gonzaga CC, et al. Obstructive sleep apnea: the most common secondary cause of hypertension associated with resistant hypertension. Hypertension. 2011;58(5):811–817. doi:10.1161/hypertensionaha.111.179788
4. He QY, Feng J, Zhang XL, et al. Relationship of daytime blood pressure and severity of obstructive sleep apnea among Chinese: a multi-center investigation in China. Chin Med J. 2010;123(1):18–22.
5. Ye L, Pien GW, Ratcliffe SJ, et al. The different clinical faces of obstructive sleep apnoea: a cluster analysis. Eur Respir J. 2014;44(6):1600–1607. doi:10.1183/09031936.00032314
6. Vavougios GD, George DG, Pastaka C, Zarogiannis SG, Gourgoulianis KI. Phenotypes of comorbidity in OSAS patients: combining categorical principal component analysis with cluster analysis. J Sleep Res. 2016;25(1):31–38. doi:10.1111/jsr.12344
7. Dempsey JA, Veasey SC, Morgan BJ, O’Donnell CP. Pathophysiology of sleep apnea. Physiol Rev. 2010;90(1):47–112. doi:10.1152/physrev.00043.2008
8. Young VB. The role of the microbiome in human health and disease: an introduction for clinicians. BMJ. 2017;356:j831. doi:10.1136/bmj.j831
9. Chen J, Douglass J, Prasath V, et al. The microbiome and breast cancer: a review. Breast Cancer Res Treat. 2019;178(3):493–496. doi:10.1007/s10549-019-05407-5
10. Gopalakrishnan V, Helmink BA, Spencer CN, Reuben A, Wargo JA. The influence of the gut microbiome on cancer, immunity, and cancer immunotherapy. Cancer Cell. 2018;33(4):570–580. doi:10.1016/j.ccell.2018.03.015
11. Maruvada P, Leone V, Kaplan LM, Chang EB. The human microbiome and obesity: moving beyond associations. Cell Host Microbe. 2017;22(5):589–599. doi:10.1016/j.chom.2017.10.005
12. Tsigalou C, Stavropoulou E, Bezirtzoglou E. Current insights in microbiome shifts in Sjogren’s syndrome and possible therapeutic interventions. Front Immunol. 2018;9:1106. doi:10.3389/fimmu.2018.01106
13. Pignatelli P, Fabietti G, Ricci A, Piattelli A, Curia MC. How periodontal disease and presence of nitric oxide reducing oral bacteria can affect blood pressure. Int J Mol Sci. 2020;21(20):7538. doi:10.3390/ijms21207538
14. Barbadoro P, Ponzio E, Coccia E, et al. Association between hypertension, oral microbiome and salivary nitric oxide: a case-control study. Biol Chem. 2021;106:66–71. doi:10.1016/j.niox.2020.11.002
15. Cai Y, Juszczak HM, Cope EK, Goldberg AN. The microbiome in obstructive sleep apnea. Sleep. 2021;44(8). doi:10.1093/sleep/zsab061
16. Wu BG, Sulaiman I, Wang J, et al. Severe obstructive sleep apnea is associated with alterations in the nasal microbiome and an increase in inflammation. Am J Respir Criti Care Med. 2019;199(1):99–109. doi:10.1164/rccm.201801-0119OC
17. Yang W, Shao L, Heizhati M, et al. Oropharyngeal microbiome in obstructive sleep apnea: decreased diversity and abundance. J Clin Sleep Med. 2019;15(12):1777–1788. doi:10.5664/jcsm.8084
18. Durgan DJ, Ganesh BP, Cope JL, et al. Role of the gut microbiome in obstructive sleep apnea-induced hypertension. Hypertension. 2016;67(2):469–474. doi:10.1161/hypertensionaha.115.06672
19. Ganesh BP, Nelson JW, Eskew JR, et al. Prebiotics, probiotics, and acetate supplementation prevent hypertension in a model of obstructive sleep apnea. Hypertension. 2018;72(5):1141–1150. doi:10.1161/hypertensionaha.118.11695
20. Mashaqi S, Gozal D. Obstructive sleep apnea and systemic hypertension: gut dysbiosis as the mediator? J Clin Sleep Med. 2019;15(10):1517–1527. doi:10.5664/jcsm.7990
21. Liu J, Li T, Wu H, et al. Lactobacillus rhamnosus GG strain mitigated the development of obstructive sleep apnea-induced hypertension in a high salt diet via regulating TMAO level and CD4(+) T cell induced-type I inflammation. Biomed Pharmacother. 2019;112:108580. doi:10.1016/j.biopha.2019.01.041
22. Jia G, Zhi A, Lai PFH, et al. The oral microbiota - a mechanistic role for systemic diseases. Br Dent J. 2018;224(6):447–455. doi:10.1038/sj.bdj.2018.217
23. Sun J, Tang Q, Yu S, et al. Role of the oral microbiota in cancer evolution and progression. Cancer Med. 2020;9(17):6306–6321. doi:10.1002/cam4.3206
24. Chistiakov DA, Orekhov AN, Bobryshev YV. Links between atherosclerotic and periodontal disease. Exp Mol Pathol. 2016;100(1):220–235. doi:10.1016/j.yexmp.2016.01.006
25. DeSouza CA, Dengel DR, Macko RF, Cox K, Seals DR. Elevated levels of circulating cell adhesion molecules in uncomplicated essential hypertension. Am J Hypertens. 1997;10(12 Pt 1):1335–1341. doi:10.1016/s0895-7061(97)00268-9
26. Kobayashi R, Ogawa Y, Hashizume-Takizawa T, Kurita-Ochiai T. Oral bacteria affect the gut microbiome and intestinal immunity. Pathog Dis. 2020;78(3). doi:10.1093/femspd/ftaa024
27. Ko CY, Hu AK, Chou D, et al. Analysis of oral microbiota in patients with obstructive sleep apnea-associated hypertension. Hypertens Res. 2019;42(11):1692–1700. doi:10.1038/s41440-019-0260-4
28. Berry RB, Budhiraja R, Gottlieb DJ, et al. Rules for scoring respiratory events in sleep: update of the 2007 AASM manual for the scoring of sleep and associated events. deliberations of the sleep apnea definitions task force of the American Academy of Sleep Medicine. J Clin Sleep Med. 2012;8(5):597–619. doi:10.5664/jcsm.2172
29. Whelton PK, Carey RM, Aronow WS, et al. 2017 ACC/AHA/AAPA/ABC/ACPM/AGS/APhA/ASH/ASPC/NMA/PCNA Guideline for the prevention, detection, evaluation, and management of high blood pressure in adults: executive summary: a report of the American college of cardiology/American heart association task force on clinical practice guidelines. Hypertension. 2018;71(6):1269–1324. doi:10.1161/hyp.0000000000000066
30. Bolyen E, Rideout JR, Dillon MR, et al. Reproducible, interactive, scalable and extensible microbiome data science using QIIME 2. Nat Biotechnol. 2019;37(8):852–857. doi:10.1038/s41587-019-0209-9
31. Zinchuk AV, Jeon S, Koo BB, et al. Polysomnographic phenotypes and their cardiovascular implications in obstructive sleep apnoea. Thorax. 2018;73(5):472–480. doi:10.1136/thoraxjnl-2017-210431
32. Zhang C, Zhang T, Lu W, et al. Altered airway microbiota composition in patients with pulmonary hypertension. Hypertension. 2020;76(5):1589–1599. doi:10.1161/hypertensionaha.120.15025
33. Wang P, Dong Y, Zuo K, et al. Characteristics and variation of fecal bacterial communities and functions in isolated systolic and diastolic hypertensive patients. BMC Microbiol. 2021;21(1):128. doi:10.1186/s12866-021-02195-1
34. Hernandez BY, Zhu X, Goodman MT, et al. Betel nut chewing, oral premalignant lesions, and the oral microbiome. PLoS One. 2017;12(2):e0172196. doi:10.1371/journal.pone.0172196
35. Yu FY, Wang QQ, Li M, et al. Dysbiosis of saliva microbiome in patients with oral lichen planus. BMC Microbiol. 2020;20(1):75. doi:10.1186/s12866-020-01733-7
36. Kapil V, Milsom AB, Okorie M, et al. Inorganic nitrate supplementation lowers blood pressure in humans: role for nitrite-derived NO. Hypertension. 2010;56(2):274–281. doi:10.1161/hypertensionaha.110.153536
37. Lundberg JO, Weitzberg E, Cole JA, Benjamin N. Nitrate, bacteria and human health. Nat Rev Microbiol. 2004;2(7):593–602. doi:10.1038/nrmicro929
38. Bondonno CP, Liu AH, Croft KD, et al. Antibacterial mouthwash blunts oral nitrate reduction and increases blood pressure in treated hypertensive men and women. Am J Hypertens. 2015;28(5):572–575. doi:10.1093/ajh/hpu192
39. Qi Y, Zang SQ, Wei J, et al. High-throughput sequencing provides insights into oral microbiota dysbiosis in association with inflammatory bowel disease. Genomics. 2021;113(1 Pt 2):664–676. doi:10.1016/j.ygeno.2020.09.063
40. Rey FE, Faith JJ, Bain J, et al. Dissecting the in vivo metabolic potential of two human gut acetogens. J Biol Chem. 2010;285(29):22082–22090. doi:10.1074/jbc.M110.117713
41. Natarajan N, Hori D, Flavahan S, et al. Microbial short chain fatty acid metabolites lower blood pressure via endothelial G protein-coupled receptor 41. Physiol Genomics. 2016;48(11):826–834. doi:10.1152/physiolgenomics.00089.2016
42. Baraniya D, Jain V, Lucarelli R, et al. Screening of health-associated oral bacteria for anticancer properties in vitro. Front Cell Infect Microbiol. 2020;10:575656. doi:10.3389/fcimb.2020.575656
43. Zeng YM, Hu AK, Su HZ, Ko CY. A review of the association between oral bacterial flora and obstructive sleep apnea-hypopnea syndrome comorbid with cardiovascular disease. Sleep Breath. 2020;24(4):1261–1266. doi:10.1007/s11325-019-01962-9
44. Ryan S, Taylor CT, McNicholas WT. Systemic inflammation: a key factor in the pathogenesis of cardiovascular complications in obstructive sleep apnoea syndrome? Thorax. 2009;64(7):631–636. doi:10.1136/thx.2008.105577
45. D’Aiuto F, Nibali L, Parkar M, Patel K, Suvan J, Donos N. Oxidative stress, systemic inflammation, and severe periodontitis. J Dent Res. 2010;89(11):1241–1246. doi:10.1177/0022034510375830
46. Chen YC, Su MC, Liou CW, et al. Co-upregulation of Toll-like receptors 2 and 6 on peripheral blood cells in patients with obstructive sleep apnea. Sleep Breath. 2015;19(3):873–882. doi:10.1007/s11325-014-1116-4
47. Janssen C, Pathak A, Grassi G, van de Borne P. Endothelin contributes to the blood pressure rise triggered by hypoxia in severe obstructive sleep apnea. J Hypertens. 2017;35(1):118–124. doi:10.1097/hjh.0000000000001134
48. Lavie L, Lavie P. Molecular mechanisms of cardiovascular disease in OSAHS: the oxidative stress link. Eur Respir J. 2009;33(6):1467–1484. doi:10.1183/09031936.00086608
49. Sohail MU, Hedin L, Al-Asmakh M. Dysbiosis of the salivary microbiome is associated with hypertension and correlated with metabolic syndrome biomarkers. Diabetes Metab Syndr Obes. 2021;14:4641–4653. doi:10.2147/dmso.S325073
50. Kamiya H. Mutagenicities of 8-hydroxyguanine and 2-hydroxyadenine produced by reactive oxygen species. Biol Pharm Bull. 2004;27(4):475–479. doi:10.1248/bpb.27.475
51. Wang ZY, Liu YY, Liu GH, Lu HB, Mao CY. L-carnitine and heart disease. Life Sci. 2018;194:88–97. doi:10.1016/j.lfs.2017.12.015
 © 2022 The Author(s). This work is published and licensed by Dove Medical Press Limited. The
full terms of this license are available at https://www.dovepress.com/terms
and incorporate the Creative Commons Attribution
- Non Commercial (unported, 3.0) License.
By accessing the work you hereby accept the Terms. Non-commercial uses of the work are permitted
without any further permission from Dove Medical Press Limited, provided the work is properly
attributed. For permission for commercial use of this work, please see paragraphs 4.2 and 5 of our Terms.
© 2022 The Author(s). This work is published and licensed by Dove Medical Press Limited. The
full terms of this license are available at https://www.dovepress.com/terms
and incorporate the Creative Commons Attribution
- Non Commercial (unported, 3.0) License.
By accessing the work you hereby accept the Terms. Non-commercial uses of the work are permitted
without any further permission from Dove Medical Press Limited, provided the work is properly
attributed. For permission for commercial use of this work, please see paragraphs 4.2 and 5 of our Terms.