Back to Journals » Journal of Inflammation Research » Volume 18
Altered Nasal Microbiota-Metabolome Interactions in Allergic Rhinitis: Implications for Inflammatory Dysregulation
Authors Ma Q, Wang N, Zheng X, Liu J, Che Y, Wang J
Received 1 April 2025
Accepted for publication 28 June 2025
Published 26 July 2025 Volume 2025:18 Pages 9919—9934
DOI https://doi.org/10.2147/JIR.S526181
Checked for plagiarism Yes
Review by Single anonymous peer review
Peer reviewer comments 2
Editor who approved publication: Dr Anish R. Maskey
Qianzi Ma,1,2 Nan Wang,3 Xingyue Zheng,1 Junjie Liu,1 Yanlu Che,4 Jingting Wang2
1Department of Otorhinolaryngology-Head and Neck Surgery, The Second Affiliated Hospital, Harbin Medical University, Harbin, People’s Republic of China; 2Department of Otorhinolaryngology of The Sixth Affiliated Hospital, School of Medicine, South China University of Technology, Foshan, People’s Republic of China; 3Department of Otolaryngology, Qingdao Women and Children’s Hospital, Qingdao, People’s Republic of China; 4Department of Otorhinolaryngology-Head and Neck Surgery, The Fourth Affiliated Hospital, Harbin Medical University, Harbin, People’s Republic of China
Correspondence: Jingting Wang, Email [email protected]
Objective: The aim of this study was to investigate the correlation between nasal microbiome, metabolites, and their potential contribution to the pathogenesis of allergic rhinitis (AR), a widespread chronic inflammatory disorder that poses a considerable healthcare burden worldwide. Immune dysregulation and environmental factors are key in the development of allergic responses, but the importance of host-microbiota interactions in influencing these responses is gaining recognition.
Methods: 32 AR patients and 20 healthy controls underwent 16S rDNA sequencing and untargeted metabolomics analysis. Microbial diversity, composition, and functional pathways were compared between groups. Metabolomic alterations were evaluated using LC-MS/MS, and correlations between microbiota and metabolites were analyzed.
Results: While α-diversity did not differ significantly between groups, β-diversity analysis revealed distinct microbial community shifts in AR patients. Specifically, Actinobacteria and Bacteroidetes abundances were increased, and genera Vibrio and Aeromonas were significantly enriched. Metabolomic profiling identified 528 differential metabolites, including altered levels of LPC, and pathway analysis highlighted disrupted linoleic acid metabolism, arachidonic acid metabolism, and tryptophan metabolism. Correlation analysis revealed significant associations between specific microbial taxa (eg, Aeromonas, Vibrio) and metabolites (eg, LPC, arachidonic acid), suggesting a potential link between microbiota-derived metabolic shifts and inflammatory responses in AR.
Conclusion: The perturbation of nasal microbiota-metabolite interactions may play a role in the pathogenesis of AR, emphasizing the need for future investigations into potential pathophysiological mechanisms.
Keywords: allergic rhinitis, nasal microbiota, metabolomics, inflammation
Introduction
Allergic rhinitis (AR) is a common chronic inflammatory disorder characterized by nasal congestion, sneezing, and itching, affecting over 1 billion individuals globally and imposing substantial healthcare burdens.1,2 While immune dysregulation and environmental factors are central to its pathogenesis, emerging evidence highlights the critical role of host-microbiota interactions in shaping allergic responses.3,4 Notably, the nasal microbiota represents the first line of defense against inhaled allergens, directly interacting with mucosal immune cells to modulate Th1/Th2 balance. Unlike the gut microbiota, which influences systemic immunity, nasal microbes exert localized effects on airway inflammation, making them a key target for AR-specific research.5 However, the precise mechanisms governing the interaction between nasal microbiota and metabolism in AR remain poorly understood.
Previous studies have identified alterations in nasal microbial composition in AR patients, with enrichment of pro-inflammatory taxa like Vibrio and depletion of protective genera such as Lactobacillus.5 Functional annotation of AR microbiota showed that glycan biosynthesis and metabolism pathways were extremely active.5 Concurrently, while gut microbiota-derived metabolites (eg, short-chain fatty acids) have been implicated in allergic inflammation,6,7 the metabolic landscape of the nasal cavity-and its direct interaction with local immune cells-remains underexplored. Nasal metabolites, such as lipid mediators and amino acid derivatives, may directly influence mast cell activation and eosinophil recruitment, processes central to AR pathogenesis.
This study integrates 16S rDNA sequencing and untargeted metabolomics to characterize nasal microbiota and metabolite profiles in patients with AR. We hypothesize that nasal microbial dysbiosis drives local metabolic perturbations (eg, lipid and amino acid metabolism), which in turn activate pro-inflammatory signaling pathways (eg, NF-κB, TLR4) in nasal epithelial cells and immune cells. By identifying microbiota-metabolite-immune interactions, this work aims to provide mechanistic insights into AR pathogenesis and validate potential therapeutic targets.
Materials and Methods
Research Objects and Experimental Design
The study involved 32 patients diagnosed with allergic rhinitis (AR) from outpatient clinics at the Second Affiliated Hospital of Harbin Medical University between April 2023 and July 2024, constituting the study group. The control group comprised 20 healthy individuals who received a physical examination concurrently. Analysis showed no statistically significant differences (P>0.05) in general characteristics such as sex, age, and BMI between the two groups, indicating their comparability (Table 1).
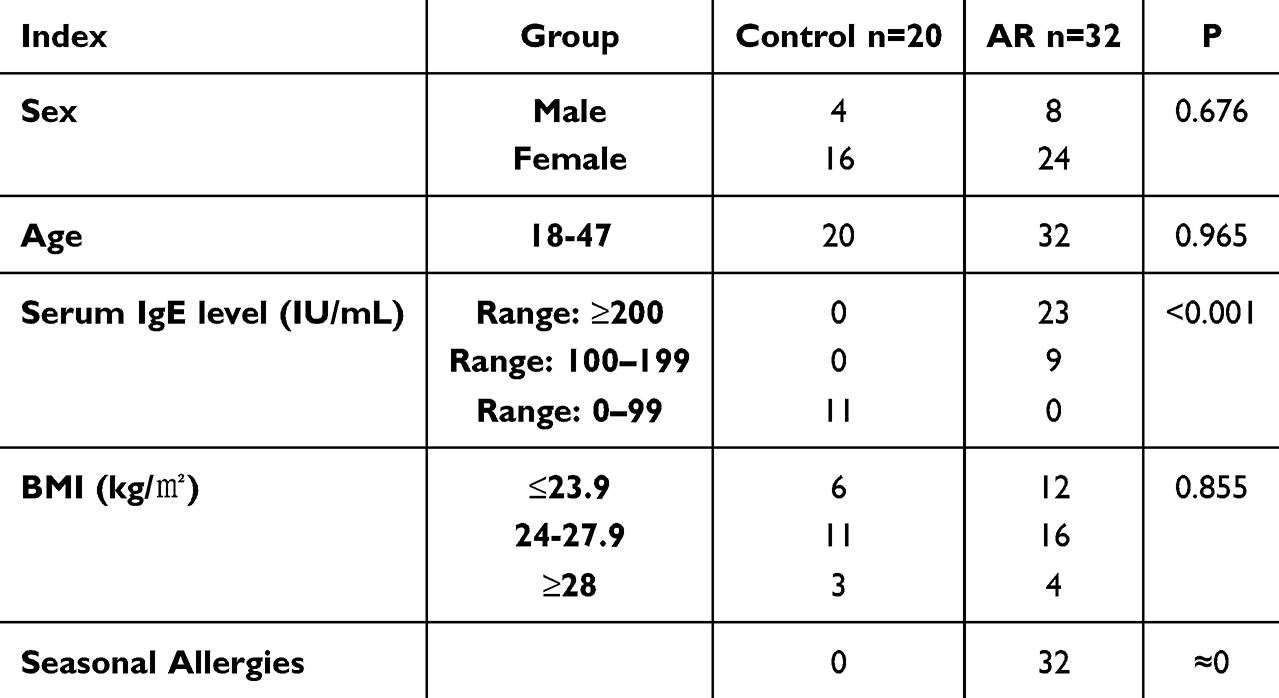 |
Table 1 Clinical Characteristics of the Participants in the Study |
Inclusion Criteria
AR group: (1) The diagnosis of AR was confirmed by a hospital clinician in conjunction with clinical manifestations and serum IgE test results and an allergen skin prick test. (2) Participants aged 18 years or above, capable of providing informed consent. (3) Has not received immunotherapy or any other related drug treatment in the past 4 weeks.
Control group, (1) Healthy individuals who underwent medical examinations showed normal results. (2) Absence of personal or familial allergic history. (3) Absence of allergic symptoms. (4) After a thorough examination (including allergen detection) to eliminate interfering factors. (5) Voluntary participation in this research.
Exclusion Criteria
The exclusion criteria for AR patients were as follows: (1) Received antibiotics, glucocorticoids, or antihistamines within the past three months. (2) Combined sinusitis, nasal polyps, or nasal tumors. (3) Afflicted with additional respiratory system disorders. (4) Concomitant systemic diseases. (5) History of psychiatric disorders or laboratory abnormalities may have influenced the results. (6) Nasal irrigation was performed within the last 2 weeks.
Sample Collection
Sample collection followed aseptic procedures. Participants were positioned supine, and the skin around the mouth and nose was disinfected with iodine. Guided by a nasal endoscope, a sterile disposable cotton swab was inserted into the nasal cavity, rotated at least six times until fully saturated, then placed in a liquid nitrogen tube. Within 15 minutes, it was transferred to a −80°C freezer for storage until DNA extraction.
Microbiota Analysis
Total DNA was extracted from nasal secretions using a commercial DNA extraction kit following the manufacturer’s instructions to ensure high-quality and high-purity DNA. Specific primers targeting theV3-V4 region of 16S rRNA gene were designed for PCR amplification. The PCR products were then subjected to library construction using the DNA Library Prep Kit. The libraries were quantified using Qubit 2.0 Fluorometer and Q-PCR, followed by sequencing on the NovaSeq 6000 platform with PE250 paired-end reads. Subsequently, the sequencing data underwent analysis using QIIME2 software. The DADA2 module was utilized for denoising, removing low-quality and chimera sequences, quantifying sequences, and generating Amplicon Sequence Variants (ASVs). Parameters of the DADA2 module were set for accuracy to ensure high-quality sequences. ASVs were taxonomically annotated using the Silva 138.1 database with a minimum match threshold of 0.7, providing classification information from phylum to species for subsequent diversity analysis. Chao1 index, Shannon index, and Observed_otus index were calculated. Rarefaction curve analysis was conducted by random subsampling to assess sequencing depth sufficiency. Principal Coordinate Analysis (PCoA) was performed using the Unweighted UniFrac distance matrix to evaluate differences in microbial community composition between samples. PCoA results were visualized in a two-dimensional coordinate plot to demonstrate sample clustering. The LEfSe algorithm was employed to identify taxonomic biomarkers between groups, with genus-level abundance changes validated using t-tests. Microbial metabolic functions were predicted using PICRUSt2, and functional annotation was based on the KEGG pathway database (v95), with differential pathway analysis conducted using Wilcoxon rank-sum tests (P < 0.05).
Metabolomics Analysis
Nasal secretion samples were immediately stored at −80°C post-collection to ensure metabolite stability. Prior to analysis, samples were thawed on ice and diluted at a 1:10 ratio with ultrapure water. The diluted sample was mixed with anhydrous sodium sulfate, 50% sulfuric acid, and ether, vortexed for 1 minute, and centrifuged at 4,000 rpm for 20 minutes at 4°C. The supernatant was collected for further analysis. Metabolite analysis was performed using an ultra-performance liquid chromatography-quadrupole time-of-flight mass spectrometry (UPLC-Q-TOF/MS) system. Mass spectrometry was performed in both positive and negative ion modes using an electrospray ionization (ESI) source. The raw mass spectrometry data were preprocessed with Compound Discoverer 3.3 software, which involved noise reduction, peak extraction, and alignment. Qualitative and quantitative analysis of metabolites was conducted by comparing with metabolite databases such as HMDB and KEGG. Quality control samples (QC samples) were analyzed to ensure data accuracy and reliability. QC samples, created by combining equal volumes of all samples, were periodically injected to monitor instrument stability and data quality. Principal component analysis was used to examine initial variations in metabolic patterns among samples and detect potential biomarkers. Partial least squares discriminant analysis was then employed to differentiate metabolic characteristics between the AR group and the control group, with model reliability evaluated through permutation testing. Identified differential metabolites underwent pathway enrichment analysis using the KEGG database to uncover metabolic pathways linked to AR.
Statistical Methods
Statistical analyses were conducted utilizing SPSS 25.0 (IBM, USA), R 3.4.3 (R Foundation) and Python 3.5 (Python Software Foundation), and the threshold for significance was set at P<0.05. The microbiome data were analyzed by QIIME2 (v2022.2) for quality control and ASV annotation, and the metabolomics data were preprocessed by Compound Discoverer 3.3 (Thermo Fisher Scientific) and imported into R/Python for statistical modeling.
Results
Comparison of Nasal Microbiota Between AR Patients and the Control Group
α Diversity and β Diversity
Chao1, Shannon and observed_otus indices were used to evaluate the richness and evenness of microbial communities. Statistical analysis showed that no significant differences were observed between the AR group and the control group in any of the above indicators (Figure 1A, P >0.05), indicating that the species diversity and abundance of the nasal microbiota in the two groups were basically the same.
 |
Figure 1 Comparison of bacterial alpha diversity indices, including the Chao1, Shannon, and observed_otus indices (A). Principal component analysis (PCA) (B). Principal coordinate analysis (PCoA). Dots of the same color represent each biological repetition in the group, and the distribution state of dots reflects the difference between and within the group (C). Venn diagrams were generated according to the OTUs (D). |
Principal coordinate analysis (PCoA) showed that the AR group and the control group were significantly separated at the species level (PERMANOVA, P < 0.01), and 32.7% of the inter-group difference could be explained. Principal component analysis (PCA) further verified this result, and the cumulative contribution rate of the first two principal components was 41.2%. The two groups of samples were significantly separated along the PC1 axis, indicating that the composition of the nasal microbial community changed significantly in the disease state. (Figure 1B and C).
Based on ASVs (amplicon-sequence variants) analysis, a total of 15,832 ASVs were detected, of which 2,604 core ASVs were shared between the AR group and the control group. The number of unique ASVs in the AR group (10,836) was significantly higher than that in the control group (4,796), suggesting that the nasal microbiota of AR patients has a more unique species composition (Figure 1D).
Variations in the Nasal Microbiota Composition in Patients Suffering From AR
Based on 16S rRNA gene sequencing results, we conducted a detailed analysis of the nasal microbiota composition in patients with AR compared to the control group, focusing on differences at the phylum, genus, and species levels.
At the phylum level, Firmicutes, Proteobacteria, Actinobacteria, and Bacteroidota represent the predominant taxa in the nasal microbiota of two groups. The Firmicutes/Bacteroidota ratio was significantly lower in the AR group compared to the control group (Figure 2A). Additionally, the AR group displayed a significantly decreased relative abundance of Actinobacteria and a markedly increased relative abundance of Bacteroidota compared to the control group (p<0.05) (Figure 2B and C). These alterations in bacterial flora at the phylum level indicate a shift in the ecological environment of the nasal cavity in AR patients, potentially influencing microbial growth and competition.
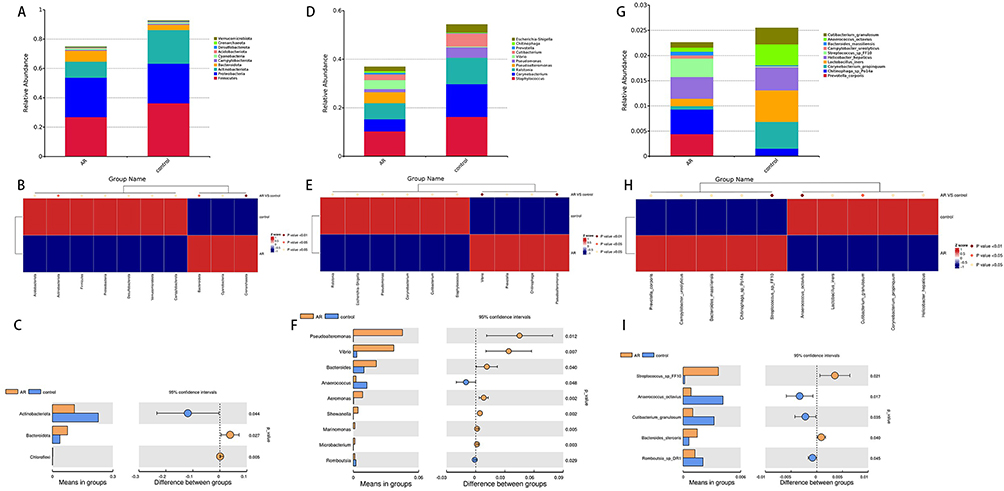 |
Figure 2 Distribution of taxa at the phylum, genus and species levels in the AR and control groups (A, D and G). Significantly different bacteria between the AR and control groups at the phylum, genus and species levels (B, C, E, F, H and I). |
At the genus level, Staphylococcus, Corynebacterium, and Ralstonia were the main taxa of the nasal microbial communities in both groups (Figure 2D). Vibrio and Aeromonas are significantly enriched in patients with AR compared to the control group, where their levels are lower (Figure 2E). Importantly, the variations in the relative abundance of Vibrio and Aeromonas show a positive correlation with the severity of AR symptoms (Figure 2F). These differences indicate that fluctuations in the abundance of specific bacterial genera may be closely associated with the occurrence and progression of AR.
At the species level, Streptococcus_sp_FF10 showed a significantly higher relative abundance in the AR group than in the control group (p<0.01) (Figure 2G and H). Furthermore, the relative abundance of Lactobacillus iners in the control group was significantly higher than in the AR group, indicating a potential protective role of this probiotic in maintaining nasal microbiota balance (Figure 2I).
In order to comprehensively identify the microbes that significantly contribute to inter-group differences, we performed LEfSe analysis (LDA multiple=3, P<0.05). The results showed that the AR group was significantly enriched in microbial groups such as Pseudoalteromonadaceae, Pseudoalteromonas, Vibrionaceae and Vibrio. In contrast, Actinobacteriota, Staphylococcus, Corynebacterium and Pseudomonas were significantly enriched in the control group (Figure 3A and B). Streptococcus_sp_FF10 showed significant enrichment in the AR group at the species level, while Lactobacillus_iners was notably enriched in the control group. These findings imply that distinct features are present in the nasal microbiome of individuals with AR, potentially playing a role in the pathogenesis of the condition.
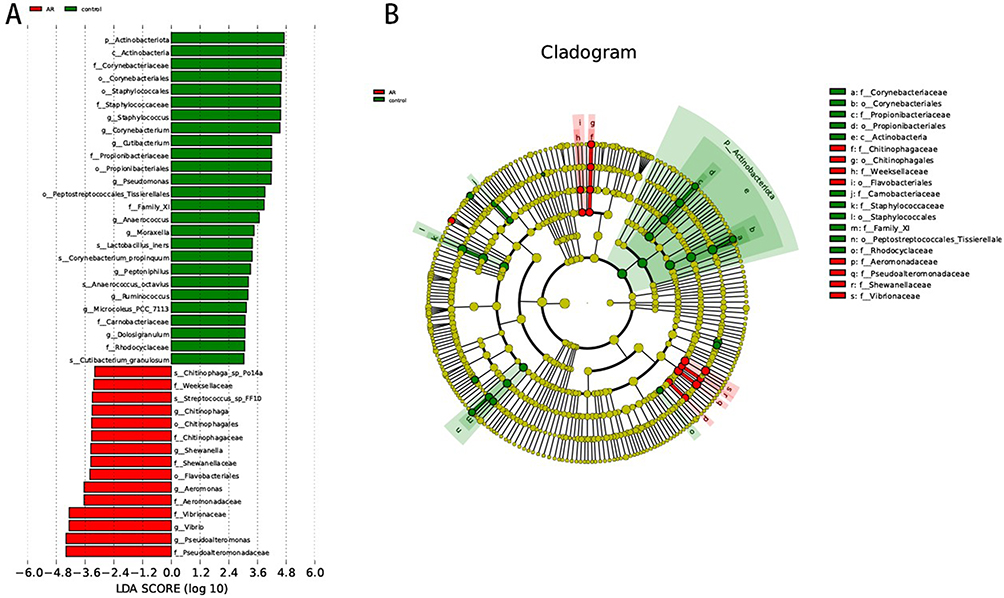 |
Figure 3 LDA score map and cladogram (LDA fold=3 and P <0.05). The red nodes in the LDA value distribution histogram represent the microbial groups that play important roles in the AR group, and the green nodes represent the microbial groups that play important roles in the Con group. Only species with an LDA score > 3.5 are shown in the figure. (A) LDA score map. The histogram’s length represents the LDA value’s size. (B) Cladogram. The circles represent the phylum, class, order, family, and genus from the inside to the outside. Each small circle at a different classification level represents a classification at that level. The diameter of the small circle is proportional to the relative abundance. |
Analysis of the Correlations Among Environmental Factors
We conducted Spearman correlation analysis to examine the association between the nasal microbiota’s relative abundance in patients with AR and environmental factors. The results indicate a close association between microbiota variations and the immune status and symptomatology of AR.
At the phylum level, Euryarchaeota and Methylomirabilota abundances exhibited a significant positive correlation with age, Proteobacteria and Fusobacteriota were significantly positively correlated with IgE level, and Firmicutes was significantly negatively correlated with Rhinoconjunctivitis Quality of Life Questionnaire (RQLQ, Figure 4A). It is indicated by these findings that fluctuations in certain microbial phyla’s abundance may correlate with the immune status and symptom severity in patients with AR.
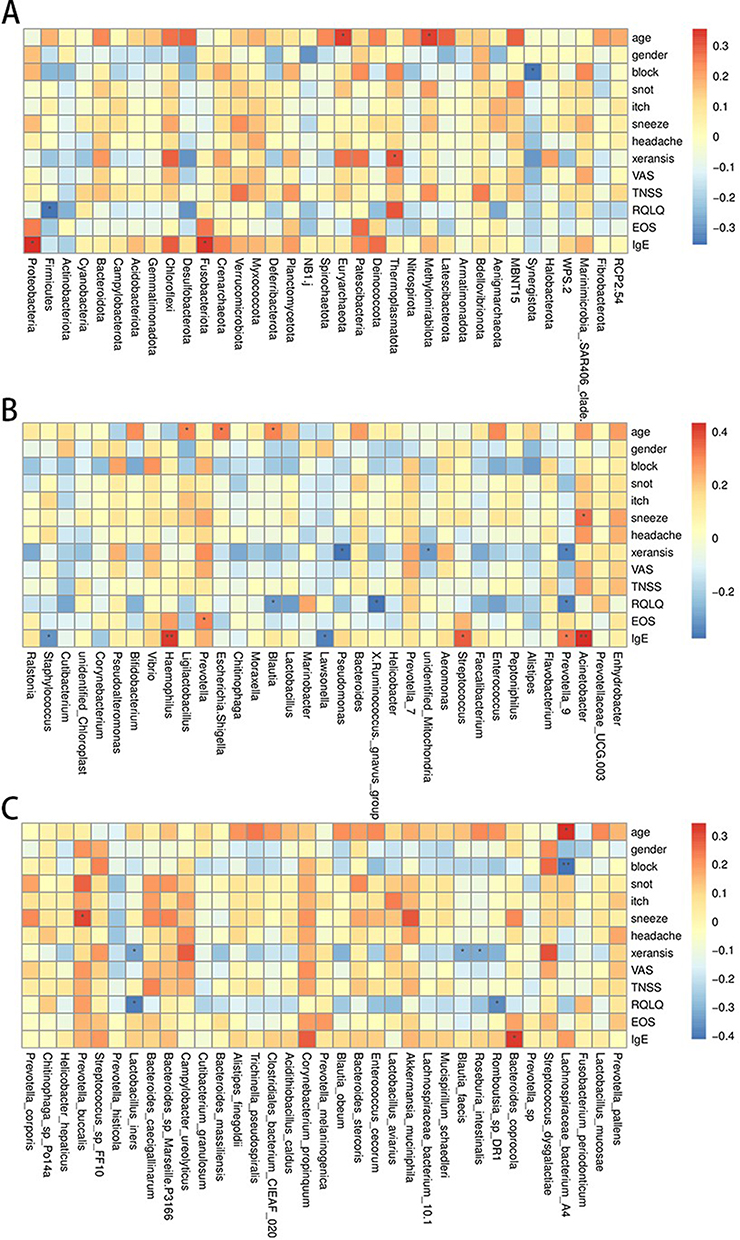 |
Figure 4 Correlation analysis between nasal microbiota and environmental factors in the AR and control groups (A–C). |
At the genus level, the abundance of Acinetobacter, Haemophilus, and Streptococcus was significantly positively correlated with IgE level, and the abundance of Prevotella_9 was significantly positively correlated with eosinophil (EOS) level. The abundance of Pseudomonas and Prevotella_9 was negatively correlated with xeransis. (Figure 4B). These correlations suggest that changes in the abundance of specific microbial genera may impact AR symptoms by modulating immune responses.
At the species level, Lachnospiraceae bacterium A4 showed a positive correlation with age and a negative correlation with block (nasal congestion). Bacteroides coprocola exhibited a positive correlation with IgE levels, and Prevotella buccalis was associated with sneezing. Romboutsia sp DR1 and Lactobacillus iners displayed negative correlations with xeransis and RQLQ (Figure 4C).
The nasal microbiota of AR patients shows significant correlations with environmental factors such as IgE levels and symptom scores. Variations in specific microbial taxa abundance can worsen AR symptoms by influencing immune responses and inflammatory factor release, shedding light on the interplay between microbial communities and environmental factors.
Differential Examination of Distinct Microbial Functions Within AR Groups
Analysis of microbial community functional differences between the AR patients and the control group was conducted via PICRUSt2. Based on the annotation results from the KEGG database, we identified significant differences in the abundance of multiple functional categories between the two groups. In the AR group, the abundance of LacI family transcriptional regulator (K02529), putative hydrolase of the HAD superfamily (K07025), and proteasome alpha subunit (K03424) was significantly higher compared to the control group, whereas the abundance of peptide/nickel transport system substrate-binding protein (K02035) and cardiolipin synthase A/B (K06131) was significantly lower than in the control group (Figure 5A and B). These findings reveal significant functional differences associated with the nasal microbiota in AR patients, correlating with the metabolic alterations observed in this disease state. This study links microbial functional abundance to AR associationally; causality and immune mechanisms remain unclear. Functional verification is required.
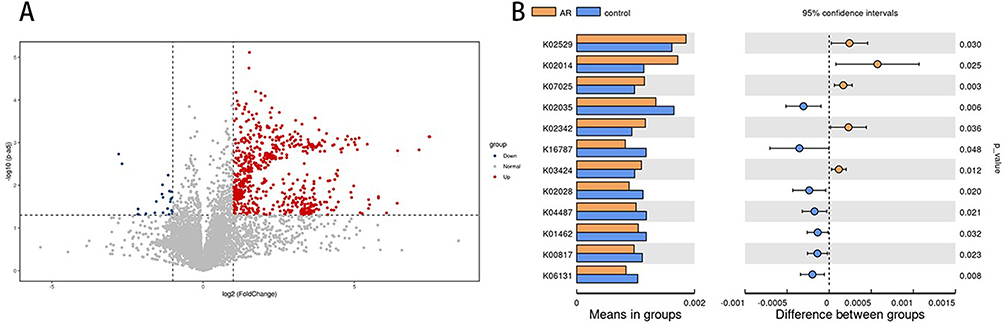 |
Figure 5 Statistically significant differences in nasal microbiota function between the AR and control groups (A and B). |
Metabolomic Analysis of the AR Group and Control Group
Multivariate Analysis of Metabolomic Data
To delve into the disparities in nasal secretion metabolites between AR patients and healthy controls, we conducted a non-targeted metabolomic analysis on samples using LC-MS/MS technology. Principal component analysis (PCA) and partial least squares discriminant analysis (PLS-DA) were employed to unveil the metabolic variances between the AR group and the control group.
In both ESI+ and ESI- modes, clear separation trends between the AR and control groups are evident in the PCA score plots (Figure 6A and B). The close clustering of QC samples indicates the robust stability of the metabolomics system. The PLS-DA further enhanced inter-group discriminative ability. The results showed a complete separation in metabolomic characteristics between the AR and control groups (Figure 6C and D). The reliability of the model was confirmed by permutation analysis, with R2 data exceeding Q2 data, and the Q2 regression intercept with the Y-axis being less than zero, indicating absence of overfitting (Figure 6E and F).
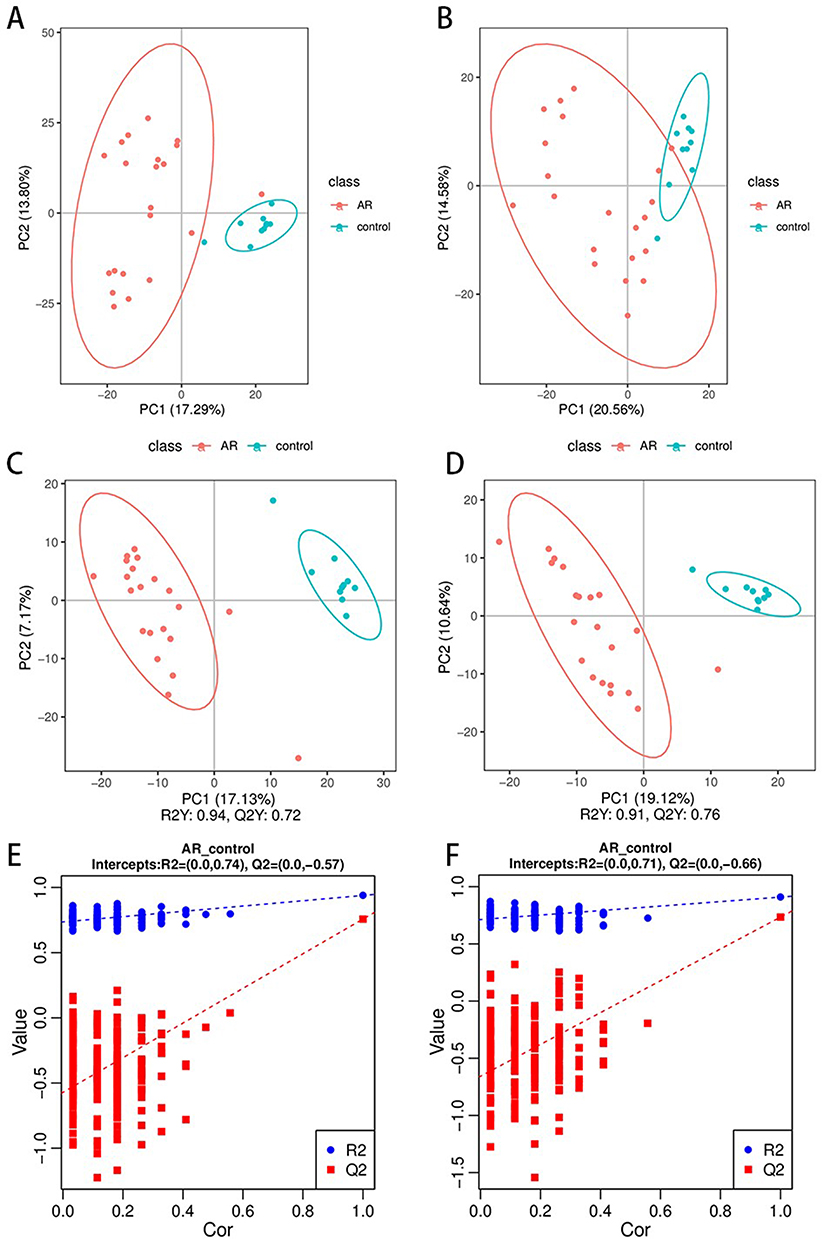 |
Figure 6 Nasal metabolomic profiles of the different groups. PCA score plots of the serum metabolic profiles of the allergic rhinitis and control groups (A and B). OPLS-DA score plots of the serum metabolic profiles of the AR and control groups (C and D). The permutation plots of the OPLS-DA models (E and F). |
Identification of Differentially Abundant Metabolites in the Nasal Cavity
AR disrupts the composition of the nasal secretion metabolome. We identified 528 recognizable features in the ESI+ mode, with 213 metabolites upregulated and 315 downregulated compared with those in the control group. In the ESI- mode, we identified 305 features, with 143 metabolites upregulated and 162 downregulated. After correcting for p-values, we listed the Log2FC, P-value, Q-value, and VIP values of the top differential metabolites in Supplemental Table 1 and supplementary Table 2.
Volcano and heatmap revealed that the expression of different differentially abundant metabolites was significantly up- or downregulated between the AR and control group (Figure 7A–D). The fold change values of the differentially abundant metabolites were log2 transformed and sorted to obtain the top 20 upregulated and downregulated metabolites for display in a volcano plot (Figure 7E and F). Compared with those in the control group, 20 differentially abundant metabolites, such as Lysopc 16:1,4-Methyl-2-Oxopentanoic Acid, S Tetrahydrocorticosterone, and Sanguinarine, were significantly decreased in the AR group. Additionally, 20 differentially abundant metabolites, such as methylbenzethonium chloride, melatonin, norbuprenorphine, and LPC 15:0, were significantly increased in the AR group. In the ESI mode, 20 differentially abundant metabolites in the AR group, such as cnidioside A, roxarin, S-glyglutathione, and the JWH 250 N-pentanoic acid metabolite, were significantly decreased. In contrast, another 20 differentially abundant metabolites, such as N1-(1-phenylethyl)-4-(2-chloro-6-nitrophenoxy)benzene-1-sulfonamide, prostaglandin F3α, prostaglandin D3, and LPC 20:2, were significantly increased in the AR group.
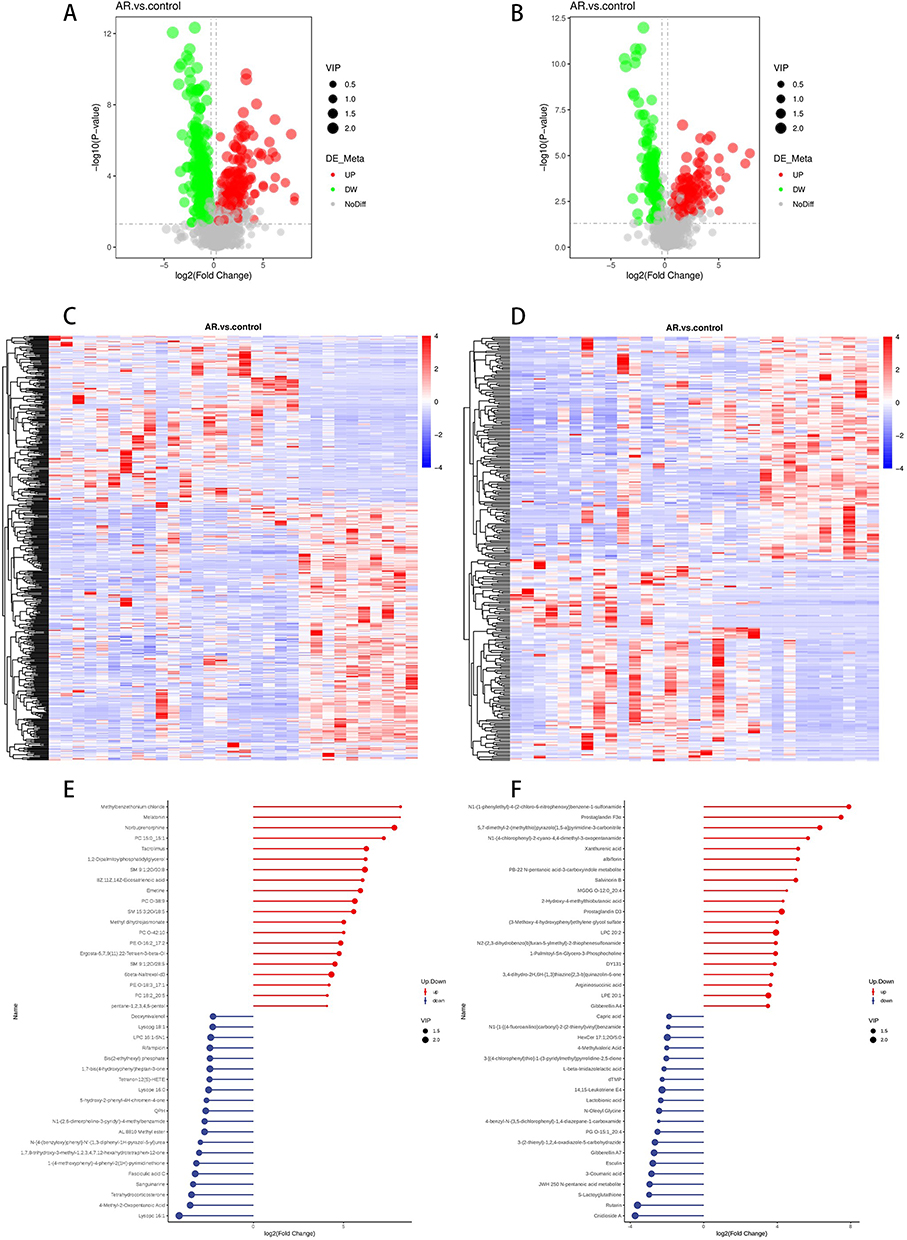 |
Figure 7 Volcano plot of differentially abundant metabolites between the AR and control groups in the ESI+ mode (A). Volcano plot of differentially abundant metabolites between the AR and control groups in ESI mode (B). Hierarchical clustering heatmap of differentially abundant metabolites between the AR and control groups in ESI+ mode (C). Hierarchical clustering heatmap of differentially abundant metabolites between the AR and control groups in ESI mode (D). Matchstick plot of the top 20 metabolites in terms of their up- and downranking in the ESI+ mode (E). Matchstick plot of the top 20 metabolites in terms of their up- and downranking in ESI mode (F). Red and blue shading represent high and low metabolite levels, respectively. |
Correlation Analysis of Differentially Abundant Metabolites
Different metabolites have synergistic or mutually exclusive relationships, and we investigated the connections between different metabolites. We observed that among the 20 significantly different metabolites screened in the ESI+ mode, LPC 20:1-SN1 LPE 16:0, which was negatively correlated with the other metabolites, was positively correlated with the remaining metabolites (Figure 8A). On the other hand, among the 20 significantly different metabolites screened in ESI- mode, D-glucarate was negatively correlated with the other metabolites, whereas the remaining metabolites were positively correlated (Figure 8B).
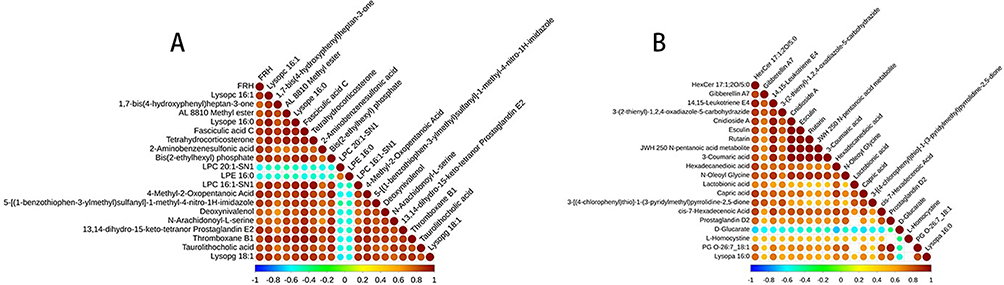 |
Figure 8 Correlation analyses of differentially abundant metabolites ((A) ESI+ mode; (B) ESI- mode). |
Identification of Differential Metabolic Pathways in the Nasal Cavity
Additionally, in addition to studying individual metabolites, pathway enrichment analysis is utilized to determine the metabolic pathways that are pivotal in the development and progression of AR. KEGG pathway enrichment analysis revealed differences in metabolites involved in the Fc epsilon RI signalling pathway, arachidonic acid metabolism, tryptophan metabolism, asthma, purine metabolism, and neuroactive ligand‒receptor interactions between the AR patients and the control group (Figure 9A and B). The associated differentially abundant metabolites included prostaglandin D2, leukotriene C4, arachidonic acid, linoleic acid, and xanthurenic acid, all of which were significantly different (Figure 9C–H). In conclusion, metabolomic analysis revealed that patients with AR have different metabolites and metabolic pathways than control patients.
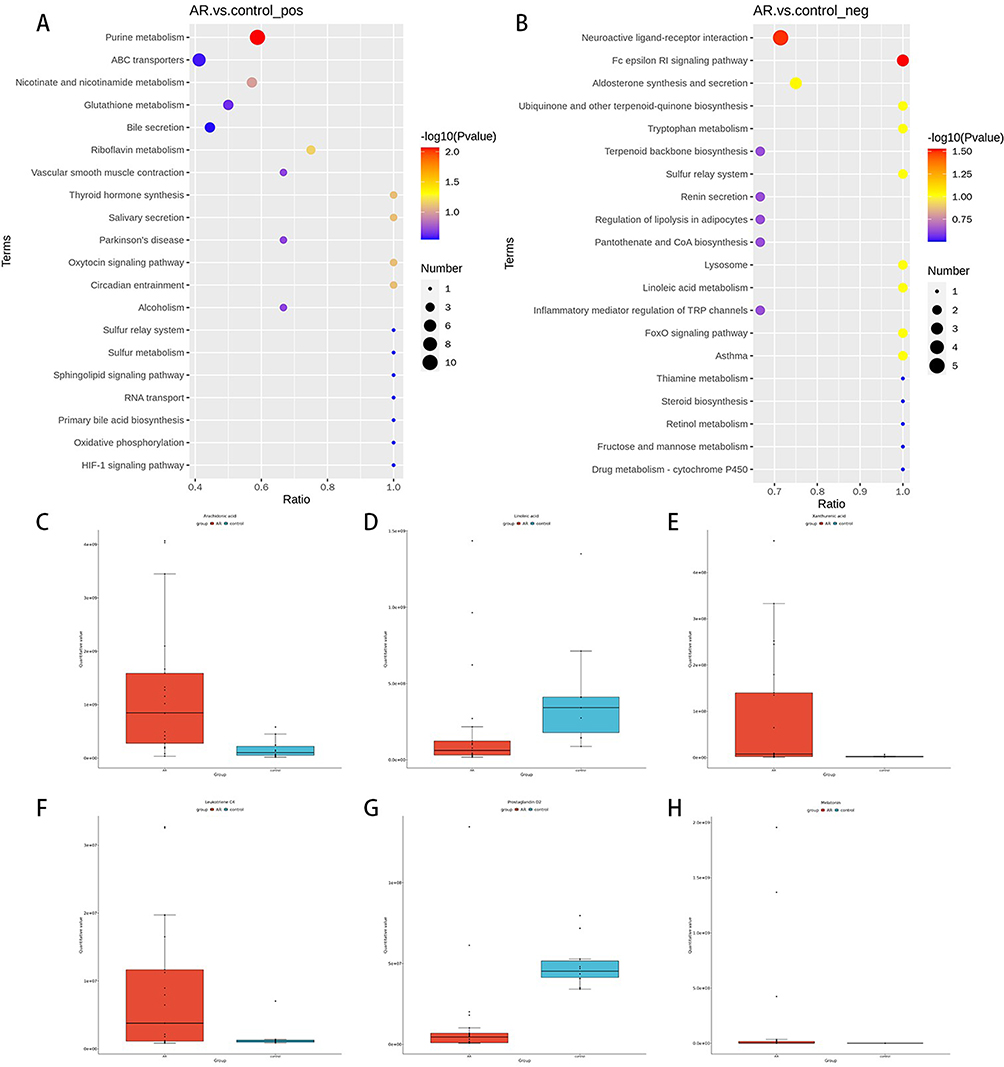 |
Figure 9 Differential metabolic pathways identified via KEGG metabolic pathway enrichment analysis ((A) ESI+ mode; (B) ESI- mode). Changes in differentially abundant metabolites related to metabolic pathways (C–H). |
Microbiome and Metabolome Association Analysis in AR
To unravel the functional interplay between nasal microbiota and host metabolism in AR, we performed a cross-omic correlation analysis using Pearson’s correlation coefficient at the genus level. This integrative approach identified significant associations between microbial taxa and metabolites, providing mechanistic insights into AR pathogenesis. In Figure 10, the correlations between the differentially abundant metabolites and the genera with differential levels are displayed. We found that Aeromonas, Curtobacterium, Microbacterium, and Shewanella had the most significant relationships with metabolites. The key differential genus Aeromonas, which increased in abundance in AR patients, was negatively correlated with metabolites such as Cnidioside A and Rutain, which were enriched in the control group, but positively correlated with differentially abundant metabolites such as LPC, which were enriched in AR patients. The decreased abundance of the genus Curtobacterium in AR patients was positively correlated with metabolites enriched in the control group (such as cnidioside A) but negatively correlated with LPC.
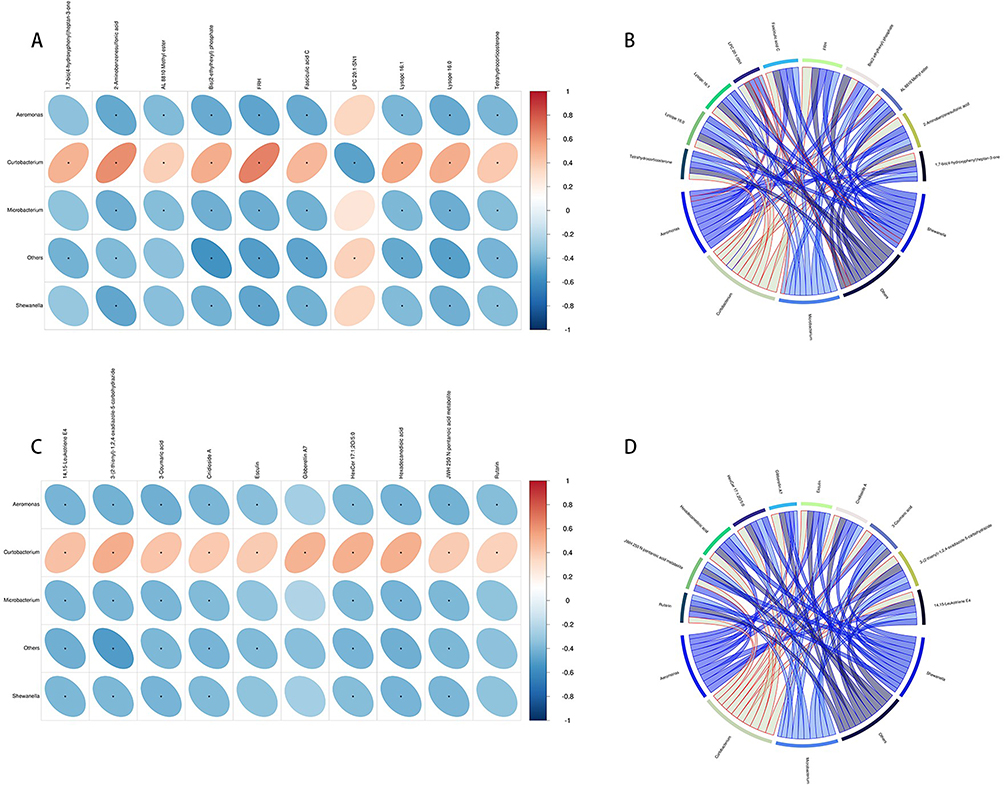 |
Figure 10 Correlation heatmap of differentially abundant metabolites and altered microbial species. Horizontal represents different bacteria, vertical represents different metabolites, the right side of the legend represents the correlation coefficient, red represents a positive correlation, and blue represents a negative correlation ((A) ESI+ mode; (C) ESI- mode). Correlation chord diagram. Nodes represent differential bacterial genera and differential metabolites. String width indicates the strength of correlation; The string border color indicates correlation, with red indicating positive correlation and blue indicating negative correlation ((B) ESI+ mode; (D) ESI- mode). |
Discussion
This study integrates 16S rRNA sequencing and untargeted metabolomics to delineate nasal microbiota-metabolite interactions in allergic rhinitis (AR). While our findings reveal significant associations between microbial dysbiosis, metabolic perturbations, and AR pathogenesis, we emphasize that the cross-sectional design precludes causal inferences. Below we contextualize key observations within existing evidence.
Microbial communities play crucial roles in regulating immune responses in atopic diseases. While nasal microbiota α-diversity did not differ between AR patients and controls, β-diversity analysis revealed distinct microbial community shifts. Actinobacteriota and Bacteroidota showed increased abundance in AR, with Actinobacteriota linked to oxidative metabolism enzymes that may influence disease progression.8 Changed abundance in AR patients aligns with its proposed protective role in respiratory diseases.9,10 Elevated Bacteroidota abundance and a reduced Firmicutes/Bacteroidota (F/B) ratio suggest altered mucosal ecology in AR. Bacteroidota’s capsular polysaccharides modulate CD4+ T-cell development and Th1/Th2 balance.11,12 Reduced F/B ratio in AR aligns with imbalances observed in obesity and inflammatory bowel diseases, suggesting a role in microbiota-driven pathology.13–15
Notably, Proteobacterial genera Aeromonas, Vibrio, and Pseudoalteromonas were significantly enriched in AR. Aeromonas activates NF-κB and MAPK pathways to induce pro-inflammatory cytokines (eg, IL-1β, TNF-α),16 while Vibrio promotes Th2 polarization via NF-κB-mediated IL-1β release,17,18 consistent with prior findings.5 Crucially, the observed enrichment of Aeromonas and Vibrio in AR patients may be associated with enhanced inflammatory signaling, though causal mechanisms require validation in mechanistic models.
Streptococcus_sp_FF10 enrichment in AR may exacerbate inflammation by enhancing epithelial IL-33/TSLP expression and eosinophil recruitment through CCL11 chemokine signaling.5,19 Conversely, the probiotic Lactobacillus iners was depleted in AR. Lactobacilli modulate macrophage polarization (M1 phenotype) and produce anti-inflammatory cytokines (IL-10, TGF-β) via TLR2 signaling.20,21 Reduced lactobionic acid (a lactobacilli-derived metabolite) in AR may disrupt bacterial biofilm control, worsening microbiota dysregulation.22,23 These findings support lactobacilli-based interventions to restore nasal mucosal balance.
PICRUSt2 analysis revealed altered nasal microbiome functions in AR, particularly in transcriptional regulation and carbohydrate metabolism. The LacI family transcriptional regulator (prevalent in Proteobacteria/Firmicutes) modulates carbohydrate metabolism by sensing sugar signals and regulating carbohydrate utilization genes.24 High LacI expression suggests microbial adaptation to metabolic changes, while reduced peptide transport systems may impair nutrient acquisition.24 Increased Bacteroides, Aeromonas, and Vibrio abundances likely drive these functional shifts, disrupting nasal microbiota microenvironment and contributing to AR pathogenesis.
AR patients exhibited metabolic changes, including altered melatonin levels. As a circadian regulator and immune modulator,25 melatonin influences allergic inflammation by inducing monocyte-derived cytokines (IL-1, IL-6, TNF-α) and enhancing airway smooth muscle tension, exacerbating respiratory symptoms.26,27
KEGG analysis identified three key dysregulated metabolic pathways in AR: Linoleic acid metabolism, Arachidonic acid metabolism, and Tryptophan metabolism. Linoleic acid metabolism was disrupted, with reduced α-linolenic acid (ALA)-an ω-6 PUFA that alleviates allergy symptoms by converting to DHA and inhibiting arachidonic acid-driven PGE synthesis.28,29 Linoleic acid supplementation mitigates Th1/Th2 imbalance and NF-κB-mediated inflammation in murine models, supporting its anti-inflammatory role.30,31 Dysregulated linoleic acid metabolism in AR may exacerbate inflammation via prostaglandin synthesis, complementing AR-specific ICMT enzyme mechanisms.5 Arachidonic acid was upregulated in AR, driving pro-inflammatory prostaglandin/leukotriene production - hallmarks of allergic asthma.32 While hematopoietic PGD synthase converts PGH2 to PGD2 (linked to IgE-mediated mast cell activation), AR patients showed reduced PGD2 levels, suggesting dysregulated arachidonic acid metabolism as a potential therapeutic target.33,34 Tryptophan metabolism was altered, with indole (a bacterial metabolite) inducing regulatory T cell (Treg) proliferation via FoxP3 upregulation and Th17-to-Treg conversion.35,36 Reduced kynurenine (a tryptophan derivative) correlated with impaired Treg function, linked to depleted Lactobacillus abundance.5,37 Tryptophan metabolites represent promising AR therapeutic targets, though mechanistic validation is needed.
Cross-omics correlation revealed that Aeromonas abundance positively correlated with pro-inflammatory lysophosphatidylcholine (LPC) and inversely with anti-inflammatory metabolites (eg, cnidioside A). LPC serves as a biomarker for inflammation severity. This lipid molecule regulates immune cell migration via G protein-coupled receptor activation and induces inflammatory factor release, oxidative stress, and apoptosis, exacerbating inflammation and driving disease progression.38 High concentrations LPC concentrations trigger host immune responses and disrupt cellular tight junctions.39 We propose a mechanistic hypothesis: Gram-negative bacteria like Aeromonas may activate the TLR4 signaling pathway via endotoxin release, promoting the production of LPC and NF-κB signaling to exacerbating nasal mucosal inflammation. This hypothesis aligns with prior evidence linking TLR4 activation to dysregulated lipid metabolism in allergic diseases.5 Causal relationships require validation in AR animal models.
This study has several limitations, including a relatively small sample size, cross-sectional design, and lack of mechanistic validation in animal models. The observed correlations between microbiota and metabolites do not establish causality, and further longitudinal studies with larger cohorts are needed to confirm these associations. Additionally, the study did not account for allergen-specific variations in microbiota-metabolite interactions, which may influence AR pathogenesis.
Conclusion
In summary, this multi-omics analysis reveals: Nasal microbiota dysbiosis in AR is characterized by enrichment of pro-inflammatory genera (Vibrio, Aeromonas) and depletion of immunomodulatory taxa (Lactobacillus, Actinobacteria). Metabolic disruptions in linoleic acid, arachidonic acid, and tryptophan pathways drive inflammatory mediator imbalances. Microbiota-metabolite correlations (eg, Aeromonas-LPC) suggest TLR4/NF-κB signaling as a potential mechanistic link between dysbiosis and inflammation.
These findings position nasal microbiota and associated metabolites as key players in AR pathophysiology. Future studies should prioritize mechanistic validation and translational applications, such as microbiota-directed therapies for allergic inflammation.
Data Sharing Statement
The datasets used and analyzed during the current study are available from the corresponding author upon reasonable request.
Ethics Approval and Consent to Participate
The studies that included human subjects were reviewed and approved by the Medical Ethics Committee of the Second Affiliated Hospital of Harbin Medical University and China Clinical Trial Registration Center, CHINA. The patients/participants provided their written informed consent to participate in this study. This study was conducted in accordance with the ethical principles of the Declaration of Helsinki.
Acknowledgments
Thanks are extended to our co-workers for their assistance and to all participants in the study for their support and active cooperation.
Author Contributions
All authors made a significant contribution to the work reported, whether that is in the conception, study design, execution, acquisition of data, analysis and interpretation, or in all these areas; took part in drafting, revising or critically reviewing the article; gave final approval of the version to be published; have agreed on the journal to which the article has been submitted; and agree to be accountable for all aspects of the work.
Funding
This work was supported by the Young and Innovative Science Research Foundation of the Second Affiliated Hospital of Harbin Medical University [grant numbers KYCX2019-04]; the Heilongjiang Postdoctoral Foundation [grant number LBH-Z16247]; the Heilongjiang Postdoctoral Startup Found [grant number LBH-Q21028]; and the Harbin Medical University 2023 Youth Fund [grant number 2023-KYYWF-0242].
Disclosure
The authors report no conflicts of interest in this work.
References
1. Agnihotri NT, McGrath KG. Allergic and nonallergic rhinitis. Allergy Asthma Proc. 2019;40(6):376–379. doi:10.2500/aap.2019.40.4251
2. Bousquet J, Anto JM, Bachert C, Baiardini I. Allergic rhinitis. Nat Rev Dis Primers. 2020;6(1):95. doi:10.1038/s41572-020-00227-0
3. Arrieta MC, Stiemsma LT, Dimitriu PA. Early infancy microbial and metabolic alterations affect risk of childhood asthma. Sci Transl Med. 2015;7(307):307ra152. doi:10.1126/scitranslmed.aab2271
4. Ver Heul A, Planer J, Kau AL. The human microbiota and asthma. Clin Rev Allergy Immunol. 2019;57(3):350–363. doi:10.1007/s12016-018-8719-7
5. Che Y, Wang N, Ma Q, et al. Microbial characterization of the nasal cavity in patients with allergic rhinitis and non-allergic rhinitis. Front Cell Infect Microbiol. 2023;13:1166389. doi:10.3389/fcimb.2023.1166389
6. Rinschen MM, Ivanisevic J, Giera M, Siuzdak G. Identification of bioactive metabolites using activity metabolomics. Nat Rev Mol Cell Biol. 2019;20(6):353–367. doi:10.1038/s41580-019-0108-4.
7. Koidl L, Untersmayr E. The clinical implications of the microbiome in the development of allergy diseases. Expert Rev Clin Immunol. 2021;17(2):115–126. doi:10.1080/1744666X.2021.1874353
8. Garrido-Sanz D, Redondo-Nieto M, Martín M, Rivilla R. Comparative genomics of the rhodococcus genus shows wide distribution of biodegradation traits. Microorganisms. 2020;8(5):774. doi:10.3390/microorganisms8050774.
9. Zhang Y, Ning H, Zheng W, Liu J, Li F, Chen J. Lung microbiome in children with hematological malignancies and lower respiratory tract infections. Front Oncol. 2022;12:932709. doi:10.3389/fonc.2022.932709
10. Zheng L, Liu C, Wang H, et al. Intact lung tissue and bronchoalveolar lavage fluid are both suitable for the evaluation of murine lung microbiome in acute lung injury. Microbiome. 2024;12(1):56. doi:10.1186/s40168-024-01772-6
11. Agus A, Denizot J, Thévenot J, et al. Western diet induces a shift in microbiota composition enhancing susceptibility to Adherent-Invasive E. coli infection and intestinal inflammation. Sci Rep. 2016;6(1):19032. doi:10.1038/srep19032
12. Hosang L, Canals RC, van der Flier FJ, et al. The lung microbiome regulates brain autoimmunity. Nature. 2022;603(7899):138–144. doi:10.1038/s41586-022-04427-4
13. Hou JJ, Wang X, Wang YM, Wang BM. Interplay between gut microbiota and bile acids in diarrhoea-predominant irritable bowel syndrome: a review. Crit Rev Microbiol. 2022;48(6):696–713. doi:10.1080/1040841X.2021.2018401
14. Grigor’eva IN. Gallstone disease, obesity and the Firmicutes/bacteroidetes ratio as a possible biomarker of gut dysbiosis. J Pers Med. 2020;11(1):13. doi:10.3390/jpm11010013.
15. Stojanov S, Berlec A, Štrukelj B. The influence of probiotics on the Firmicutes/bacteroidetes ratio in the treatment of obesity and inflammatory bowel disease. Microorganisms. 2020;8(11):1715. doi:10.3390/microorganisms8111715
16. Fernández-Bravo A, Figueras MJ. An update on the genus Aeromonas: taxonomy, epidemiology, and pathogenicity. Microorganisms. 2020;8(1):129. doi:10.3390/microorganisms8010129
17. Guerra RM, Figueras MJ, Pujol-Bajador I, Fernández-Bravo A. Repositioning of the antihyperlipidemic drug fenofibrate for the management of Aeromonas infections. Microorganisms. 2024;12(3):465. doi:10.3390/microorganisms12030465.
18. Xie DL, Zheng MM, Zheng Y, et al. Vibrio vulnificus induces mTOR activation and inflammatory responses in macrophages. PLoS One. 2017;12(7):e0181454. doi:10.1371/journal.pone.0181454.
19. Miao P, Jiang Y, Jian Y, et al. Exacerbation of allergic rhinitis by the commensal bacterium Streptococcus salivarius. Nat Microbiol. 2023;8(2):218–230. doi:10.1038/s41564-022-01301-x
20. Hu J, Deng F, Zhao B, et al. Lactobacillus murinus alleviate intestinal ischemia/reperfusion injury through promoting the release of interleukin-10 from M2 macrophages via Toll-like receptor 2 signalling. Microbiome. 2022;10(1):38. doi:10.1186/s40168-022-01227-w
21. Du T, Lei A, Zhang N, Zhu C. The beneficial role of probiotic lactobacillus in respiratory diseases. Front Immunol. 2022;13:908010. doi:10.3389/fimmu.2022.908010
22. Hou W, Kang S, Chang J, Tian X, Shi C. Correlation analysis between GlpQ-regulated degradation of wall teichoic acid and biofilm formation triggered by lactobionic acid in staphylococcus aureus. Foods. 2022;11(21):3438. doi:10.3390/foods11213438
23. Hwang JH, Jeong H, Lee N, et al. Ex vivo live full-thickness porcine skin model as a versatile in vitro testing method for skin barrier research. Int J Mol Sci. 2021;22(2):657. doi:10.3390/ijms22020657
24. Ravcheev DA, Khoroshkin MS, Laikova ON, et al. Comparative genomics and evolution of regulons of the LacI-family transcription factors. Front Microbiol. 2014;5:294. doi:10.3389/fmicb.2014.00294
25. Deprato A, Maidstone R, Cros AP, et al. Influence of light at night on allergic diseases: a systematic review and meta-analysis. BMC Med. 2024;22(1):67. doi:10.1186/s12916-024-03291-5.
26. Wu HM, Zhao CC, Xie QM, Xu J, Fei GH. TLR2-melatonin feedback loop regulates the activation of NLRP3 inflammasome in murine allergic airway inflammation. Front Immunol. 2020;11:172. doi:10.3389/fimmu.2020.00172
27. Tota M, Łacwik J, Laska J, Sędek Ł, Gomułka K. The role of eosinophil-derived neurotoxin and vascular endothelial growth factor in the pathogenesis of eosinophilic asthma. Cells. 2023;12(9):1326. doi:10.3390/cells12091326.
28. Liu J, Li X, Hou J, Sun J, Guo N, Wang Z. Dietary intake of N-3 and N-6 polyunsaturated fatty acids and risk of cancer: meta-analysis of data from 32 studies. Nutr Cancer. 2021;73(6):901–913. doi:10.1080/01635581.2020.1779321
29. Rodriguez-Coira J, Villaseñor A, Izquierdo E, et al. The importance of metabolism for immune homeostasis in allergic diseases. Front Immunol. 2021;12:692004. doi:10.3389/fimmu.2021.692004
30. Gutiérrez S, Svahn SL, Johansson ME. Effects of omega-3 fatty acids on immune cells. Int J Mol Sci. 2019;20(20):5028. doi:10.3390/ijms20205028
31. Fu Y, Wang Y, Gao H, et al. Associations among dietary omega-3 polyunsaturated fatty acids, the gut microbiota, and intestinal immunity. Mediators Inflamm. 2021;2021:8879227. doi:10.1155/2021/8879227
32. Talaei M, Sdona E, Calder PC, et al. Intake of n-3 polyunsaturated fatty acids in childhood, FADS genotype and incident asthma. Eur Respir J. 2021;58(3):2003633. doi:10.1183/13993003.03633-2020
33. Rittchen S, Heinemann A. Therapeutic potential of hematopoietic prostaglandin D2 synthase in allergic inflammation. Cells. 2019;8(6):619. doi:10.3390/cells8060619
34. Afghani J, Traidl-Hoffmann C, Schmitt-Kopplin P, Reiger M, Mueller C. An overview of the latest metabolomics studies on atopic eczema with new directions for study. Int J Mol Sci. 2022;23(15):8791. doi:10.3390/ijms23158791
35. Chen J, Cui L, Lu S, Xu S. Amino acid metabolism in tumor biology and therapy. Cell Death Dis. 2024;15(1):42. doi:10.1038/s41419-024-06435-w
36. Jia S, Setyawati MI, Liu M, et al. Association of nanoparticle exposure with serum metabolic disorders of healthy adults in printing centers. J Hazard Mater. 2022;432:128710. doi:10.1016/j.jhazmat.2022.128710
37. Li S, Cai Y, Guan T, et al. Quinic acid alleviates high-fat diet-induced neuroinflammation by inhibiting DR3/IKK/NF-κB signalling via gut microbial tryptophan metabolites. Gut Microbes. 2024;16(1):2374608. doi:10.1080/19490976.2024.2374608
38. Cao X, Van Putten JPM, Wösten MMSM. Biological functions of bacterial lysophospholipids. Adv Microb Physiolog. 2023;82:129–154. doi:10.1016/bs.ampbs.2022.10.001
39. Liu P, Zhou Y, Chen C, et al. Lysophosphatidylcholine facilitates the pathogenesis of psoriasis through activating keratinocytes and T cells differentiation via glycolysis. Acad Dermatol Venereol. 2023;37(7):1344–1360. doi:10.1111/jdv.19088
 © 2025 The Author(s). This work is published and licensed by Dove Medical Press Limited. The
full terms of this license are available at https://www.dovepress.com/terms
and incorporate the Creative Commons Attribution
- Non Commercial (unported, 4.0) License.
By accessing the work you hereby accept the Terms. Non-commercial uses of the work are permitted
without any further permission from Dove Medical Press Limited, provided the work is properly
attributed. For permission for commercial use of this work, please see paragraphs 4.2 and 5 of our Terms.
© 2025 The Author(s). This work is published and licensed by Dove Medical Press Limited. The
full terms of this license are available at https://www.dovepress.com/terms
and incorporate the Creative Commons Attribution
- Non Commercial (unported, 4.0) License.
By accessing the work you hereby accept the Terms. Non-commercial uses of the work are permitted
without any further permission from Dove Medical Press Limited, provided the work is properly
attributed. For permission for commercial use of this work, please see paragraphs 4.2 and 5 of our Terms.