Back to Journals » Neuropsychiatric Disease and Treatment » Volume 16
Altered Intrinsic Functional Connectivity of the Primary Visual Cortex in Patients with Neovascular Glaucoma: A Resting-State Functional Magnetic Resonance Imaging Study
Authors Wu YY, Wang SF, Zhu PW ![]() , Yuan Q
, Yuan Q ![]() , Shi WQ
, Shi WQ ![]() , Lin Q
, Lin Q ![]() , Li B, Min YL, Zhou Q, Shao Y
, Li B, Min YL, Zhou Q, Shao Y ![]()
Received 25 August 2019
Accepted for publication 25 November 2019
Published 7 January 2020 Volume 2020:16 Pages 25—33
DOI https://doi.org/10.2147/NDT.S228606
Checked for plagiarism Yes
Review by Single anonymous peer review
Peer reviewer comments 2
Editor who approved publication: Dr Yu-Ping Ning
Yuan-Yuan Wu,* Shui-Feng Wang,* Pei-Wen Zhu, Qing Yuan, Wen-Qing Shi, Qi Lin, Biao Li, You-Lan Min, Qiong Zhou, Yi Shao
Department of Ophthalmology, The First Affiliated Hospital of Nanchang University, Nanchang 330006, Jiangxi, People’s Republic of China
*These authors contributed equally to this work
Correspondence: Qiong Zhou; Yi Shao
Department of Ophthalmology, The First Affiliated Hospital of Nanchang University, 17 Yongwaizheng Street, Donghu, Nanchang, Jiangxi 330006, People’s Republic of China
Email [email protected]; [email protected]
Purpose: The purpose was to investigate the differences in spontaneous functional connectivity (FC) of the primary visual cortex (V1) between patients with neovascular glaucoma (NVG) and healthy controls (HCs) using resting-state functional magnetic resonance imaging data.
Methods: A total of 18 patients with NVG (nine males and nine females) and 18 HCs with similar age and sex background were enrolled in the study and inspected using resting-state functional magnetic resonance imaging. The differences in FC of the V1 between the two groups were compared using the independent samples t-test. We used the receiver operating characteristic (ROC) curve to compare the average FC values of NVG subjects with those of HCs.
Results: FC in the left V1 and right fusiform gyrus, bilateral cuneus, and left precuneus was significantly decreased in the NVG group compared with that reported in the HC group. Meanwhile, patients with NVG presented increased FC between the right V1 and bilateral middle frontal gyrus. However, they also exhibited declining FC between the right V1 and left precuneus, and bilateral cuneus. The ROC curve analysis of each brain region indicated that the accuracy of the area under the ROC curves regarding NVG was excellent.
Conclusion: NVG involves aberrant FC in the V1 in different brain areas, including the visual-related and cognitive-related regions. These findings may assist in unveiling the underlying neural mechanisms of impaired visual function in NVG.
Keywords: neovascular glaucoma, functional connectivity, spontaneous brain activity, primary visual cortex
Introduction
Neovascular glaucoma (NVG) refers to the distribution of a large number of neovascularization and fibrous vascular membranes on the surface of the iris and anterior chamber angle, resulting in the destruction of the trabecular net structure. The early anterior chamber angle does not adhere to form open-angle glaucoma, whereas late anterior chamber angle adhesion forms open-angle glaucoma (also termed refractory glaucoma).1 Studies have shown that the average incidence of NVG is 6.6/10,000 patients (0.66%). In the Asian population, NVG accounts for 0.7–5.1% of glaucoma cases.2 A study found that NVG accounts for 3.5% and 13.2% of all glaucoma and secondary glaucoma cases, respectively. It is the third secondary glaucoma after intraocular surgery and trauma.3 NVG is a common condition caused by ischemic retinal diseases, such as diabetic retinopathy and central retinal vein occlusion. According to the effect of angle neovascularization on angle and intraocular pressure (IOP), NVG is divided into three stages. Early Stage I glaucoma: neovascularization in the angle of the chamber does not impair the trabecular filtration function in the early stage, and the IOP is not high. Stage II open-angle glaucoma: as the disease progresses, neovascularization impairs the filtration function of the trabecular net, and a neovascularization membrane is formed, obstructing the outflow of aqueous fluid and increasing IOP. Stage III angle-closure glaucoma: later neovascularization causes partial anterior synechiae in the anterior horn of the anterior chamber, which leads to complete anterior synechiae around the periphery of the iris.4 NVG is one of the most greatest challenges in ophthalmology, the release of large amounts of vascular endothelial growth factor after retinal ischemia and hypoxia is one of the main pathogenesi-s.5,4 It further stimulates the iris and anterior chamber angle formation on the surface of a large number of new blood vessels and the blood vessel membrane, the anterior chamber angle trabecular tissue destruction, anterior chamber angle closure, and abnormal drainage of aqueous humor, leading to an increase in intraocular tension.6,5 The treatment of NVG mainly includes two aspects: (1) reduction of IOP by the administration of drugs or surgery; and (2) improve retinal ischemia and reduce the formation of new blood vessels. Although IOP can be effectively controlled with aggressive treatment, patients' vision can be severely impaired. The investigation of NVG-related brain processes through neuroimaging is a new aspect of visual neuroscience. This approach may assist in revealing the potential mechanisms involved in these processes.
Functional magnetic resonance imaging (fMRI) is based on the correlation effect of the levels of oxygen in blood. It detects changes in these levels and performs real-time functional imaging of brain tissue, which can reflect the functions of the living brain without harming the patient. Task-related fMRI can reflect the brain activation following stimulation, while resting-state fMRI research can reflect the pathophysiological changes in brain function in the basic state. It is the most extensively used technique on account of its sensitivity, simplicity, and easily interpretation to provide insights into neural interactions.7,6 Many recent studies have demonstrated that abnormal spontaneous functional connectivity (FC) as observed in patients with glaucoma,8,7 amblyopia,9,8 and strabismus,10,11,9,10 between the primary visual cortex (V1) and the other cortex. Based on these studies, we further studied patients with NVG to investigate the abnormal intrinsic FC of the V1.
To the best of our knowledge, this is the first study to explore changes in FC of the V1 in NVG. The results of this study may provide a more accurate and exhaustive view on the specific connectivity of the V1 in NVG, and assist in understanding the underlying neural mechanisms of impaired visual function in patients with NVG versus healthy controls (HCs).
Materials and Methods
Subjects
A total of 18 subjects with NVG (nine males, nine females) were enlisted according to the following inclusion criteria in the First Affiliated Hospital of Nanchang University (Nanchang, China): (1) an anterior photograph showing the presence of new blood vessels in the iris (Figure 1); and (2) Stage III NVG. The exclusion criteria were (1) patients with a history of intraocular or extraocular surgery; and (2) diagnosis of psychiatric disorders, cardiovascular diseases, and other systemic diseases.
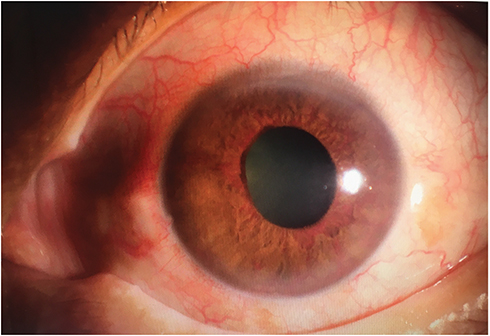 |
Figure 1 Example of NVG seen on photographic images of the anterior segment. Abbreviation: NVG, neovascular glaucoma. |
In addition, 18 HCs (nine males, nine females) comparably matched in terms of age and sex background with those classified in the NVG group were enrolled. Inclusion criteria were: (1) no history of ocular disease; (2) absence of deformities in the cerebral parenchyma; (3) absence of psychiatric diseases and cardiovascular diseases; and (4) capability for MRI examination.
The study was approved by the Medical Ethics Committee of the First Affiliated Hospital of Nanchang University, also conducted in accordance with the Declaration of Helsinki. All subjects provided written informed consent.
MRI Parameters
The MRI was performed using a Trio 3-Tesla MRI scanner (Siemens AG). The functional data were obtained using a three-dimensional metamorphic gradient recalled-echo pulse sequence. The entire process was performed within 8 min. Ultimately, 240 functional images were captured with the following settings: acquisition matrix, 64×64; field of view, 220×220 mm; thickness, 4.0 mm; gap, 1.2 mm; repetition time, 2000 ms; echo time, 30 ms; flip angle, 90°, 29 axial.
fMRI Data Processing
The data were preprocessed using the Data Processing Assistant for resting-state fMRI (rs-fMRI) (DPARSF 2.3, http://rfmri.org/DPARSF) run on MATLAB2014b (Mathworks, Natick, MA, USA). This was based on statistical parametric mapping (SPM; http://www.fil.ion.ucl.ac.uk/spm) and the rs-fMRI Data Analysis Toolkit (REST; http://www.restfmri.net). This approach has been previously described in detail.9–11
FC Analysis
The rs-fMRI data were analyzed using the statistical module of the dpabi (http://rfmri.org/dpabi). One-way analysis of covariance and the generalized linear model were applied to produce the FC maps. The two-sample t-test was used to examine differences in FC between the patients with NVG and HCs (at voxel level P<0.01 and cluster level P<0.05, Gaussian random field-corrected).
Clinical Data Analysis
The SPSS version 20.0 (IBM Corp., Armonk, NY, USA) software was used to compare the clinical data between patients with NVG and HCs through the independent samples t-test (age and weight) and chi-squared test (sex and handedness). A P<0.05 denoted statistical significance. The differences in FC values between the NVG and HC groups were determined, and receiver operating characteristic (ROC) curves were plotted and analyzed.
Results
Demographics and Behavioral results
There were no statistically significant differences in age (P=0.986) between the patients with NVG and HCs. In patients with NVG, the IOP in the left and right eyes was 28.16±11.24 mmHg and 27.16±12.37 mmHg, respectively (further details are shown in Tables 1 and 2).
 |
Table 1 Demographics and Clinical Measurements of NVG and HC Groups |
 |
Table 2 Demographics and IOP Characteristics in NVG Patients |
FC Differences
Brain regions demonstrating statistically significant differences between two groups in terms of FC in the left (Figure 2A and B, Table 3). The histogram shows that FC in the left V1 and right fusiform gyrus (FG), bilateral cuneus, and left precuneus was significantly decreased in the NVG group compared with that reported in the HC group (Figure 2C). Brain regions demonstrating statistically significant differences between two groups in terms of FC in the right (Figure 3A and B, Table 3). The histogram shows that patients with NVG presented increased FC between the right V1 and bilateral middle frontal gyrus. However, they exhibited declining FC between the right V1 and left precuneus, and bilateral cuneus (Figure 3C).
 |
Table 3 Brain Regions with Significant Differences in FC Between NVG Patients and HCs |
 |
Figure 2 Brain regions demonstrating statistically significant differences between two groups in terms of FC in the left (A and B). The blue areas denote lower FC values. The histogram shows that FC in right fusiform gyrus (FG), bilateral cuneus, and left precuneus was significantly decreased in the NVG group compared with that reported in the HC group (C). Abbreviations: NVG, neovascular glaucoma; HCs, healthy controls; FC, functional connectivity; RFG, right fusiform gyrus; BC, bilateral cuneus; LP, left precuneus. |
 |
Figure 3 Brain regions demonstrating statistically significant differences between two groups in terms of FC in the right (A and B). The red areas denote higher FC values, and the blue areas denote lower FC values. The histogram shows that patients with NVG presented increased FC in bilateral middle frontal gyrus, declining in left precuneus and bilateral cuneus compared with that reported in the HC group (C). Abbreviations: NVG, neovascular glaucoma; HCs, healthy controls; FC, functional connectivity; BMFG, bilateral middle frontal gyrus; LP, left precuneus; BC, bilateral cuneus. |
ROC Curve
The mean FC values of the two groups were analyzed using ROC curves, with a larger area under the curve (AUC) indicating a higher diagnostic rate. The following AUCs were determined for the average FC values (NVGs<HCs) in different brain regions: right FG (0.854, P<0.001), bilateral cuneus (0.839, P<0.001), left precuneus (0.822, P<0.001) (Figure 4A, left V1); left precuneus (0.873, P<0.001), bilateral cuneus (0.852, P<0.001) (Figure 4B, right V1). For the amplitude of low-frequency fluctuations values (retinal vein occlusions>HCs), the following AUC was determined: bilateral middle frontal gyrus (MFG) (0.864, P<0.001) (Figure 4B, right V1).
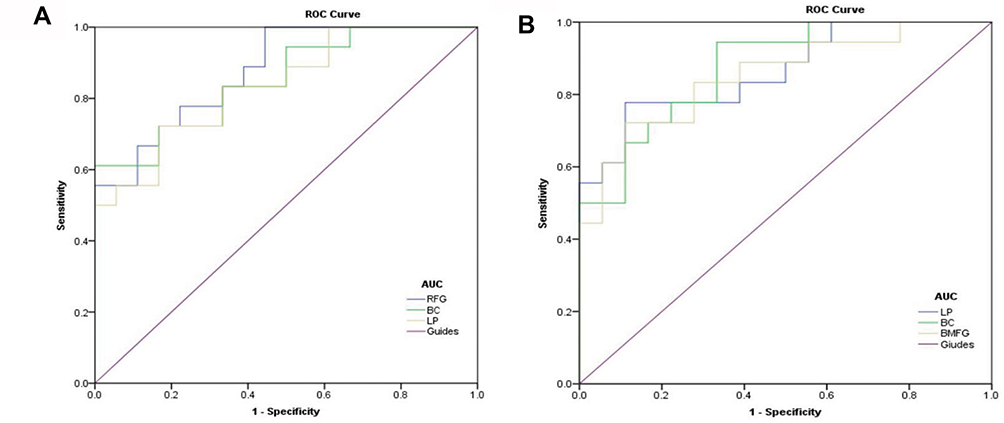 |
Figure 4 ROC curve analysis of the mean FC values for altered brain regions. Notes: (A) The AUCs of different brain regions were as follows: right fusiform gyrus (0.854, P<0.001), bilateral cuneus (0.839, P<0.001), left precuneus (0.822, P<0.001). (B) The AUCs of different brain regions were as follows: left precuneus (0.873, P<0.001), bilateral cuneus (0.852, P<0.001), bilateral middle frontal gyrus (0.864, P<0.001). Abbreviations: ROC, receiver operating characteristic; FC, functional connectivity; BMFG, bilateral middle frontal gyrus; LP, left precuneus; RFG, right fusiform gyrus; BC, bilateral cuneus. |
Discussion
Previous studies investigating ophthalmological diseases (Table 4) revealed abnormal spontaneous FC between the V1 and other regions in patients with anisometropic amblyopia,12 blindness,13–15 glaucoma,8,16,7,16 exotropia,10,9 acute open globe injury,17 and retinitis pigmentosa.18 The FC in the left V1 and right FG, bilateral cuneus, and left precuneus was significantly decreased in the NVG group compared with that reported in the HC group (Figure 5). Meanwhile, patients with NVG presented increased FC between the right V1 and bilateral middle frontal gyrus. However, they also exhibited declining FC between the right V1 and left precuneus, and bilateral cuneus (Figure 6).
 |
Table 4 FC Method Applied in Ophthalmological Diseases |
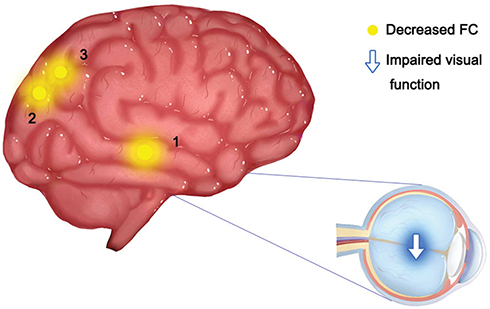 |
Figure 5 Significant differences in spontaneous brain activity between the NVG group and HCs in the left regions. Notes: The different brain regions were observed in the right fusiform gyrus (1), bilateral cuneus (2), left precuneus (3). The yellow areas denote lower FC brain regions. Abbreviations: LP, left precuneus; RFG, right fusiform gyrus; BC, bilateral cuneus. |
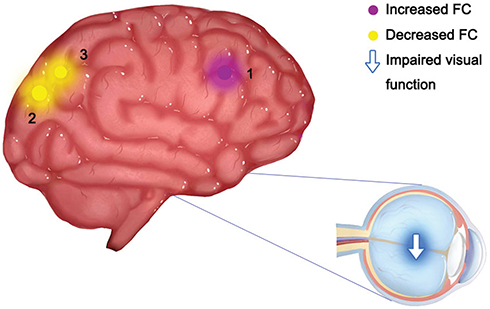 |
Figure 6 Significant differences in spontaneous brain activity between the NVG group and HCs in the right regions. Notes: The different brain regions were observed in the left precuneus (3), bilateral cuneus (2), bilateral middle frontal gyrus (1). The yellow areas denote lower FC brain regions, and the red areas denote higher FC brain regions.Abbreviations: LP, left precuneus; BC, bilateral cuneus; BMFG, bilateral middle frontal gyrus. |
The FG is located in the middle and bottom of the visual association cortex, also termed discontinuous occipitotemporal gyrus. The lateral and medial parts of the FG are separated by a shallow intermediate sulcus of the FG. Studies have shown that the part of the fusiform area responsible for face recognition is termed fusiform face area. The FG showed higher FC of V1 with familiar faces and lower with unfamiliar faces.19 Following disruption of the fusiform face area, the ability to recognize faces (even those of the closest family members) is lost. The eyes are responsible for perceiving visual information processed by the visual cortex, and subsequently by the FG to identify biological features that distinguish individuals. Individuals with autism exhibit a reduced ability to recognize faces, and the FG is not activated when looking at faces.20 A voxel-wise analysis demonstrated a decreased FC in the primary open-angle glaucoma group between the V1 and the FG.21 This is consistent with our findings showing that FC decreases in the FG of patients with NVG. This is attributed to the blindness of the patients included in the present study, suggesting reduced transmission of visual information from the primary to the higher cortex.
The MFG lies between the inferior and superior frontal sulci, in front of the precentral gyrus. It can be used as a clinical indicator of hemispheric dominance for language.22 The frontal eye field is located around the intersection of the MFG with the precentral gyrus, which is involved in eye movement and visual attention.23 A study revealed that the EEF is associated with saccade and movement generation.24 Japee et al25 compared the performance of patients undergoing right MFG resection with that of HCs. They found that the normal function of the MFG may play an important role in shifting attention from exogenous to endogenous attention control. The investigators speculated that this is attributed to a compensation mechanism activated after impairment of the normal function of the MFG. A previous study demonstrated that the FC value was increased in primary open-angle glaucoma between the V1 and bilateral MFG.1921 Moreover, studies investigating several eye diseases have observed increased activation in the frontal eye field, including retinal detachment,26 age-related macular degeneration,27 progressive retinitis pigmentosa,18 and macular hole.28 In line with these preceding results, the increased FC values between the right V1 and MFG shown in this study reflected an activation of the visual processing.
The precuneus is part of the parietal lobule, which is located in the medial hemisphere of the brain. It lies anteriorly in the wedge, bounded anteriorly by the marginal branches of the cingulate sulcus, posteriorly by the parietal occipital sulcus, and below by the parietal sulcus. Numerous studies confirmed that the precuneus/posterior cingulated cortex (pC/pCC) is a part of the default functional network, which participates in declarative memory function as an internal attention network.29 Studies have shown that the precuneus is responsible for constantly collecting information from ourselves and the environment, and automatically allocating this information.29 The posterior precuneus region is also associated with conscious short-term memory recall.30 In the resting state, pC/pCC is one of the brain regions with the largest metabolic activity, playing a crucial role in the integration of visual space.31 Abnormal function of pC/pCC node may lead to certain physiological diseases. For example, in attention-deficit/hyperactivity disorder,32 the FC of pC/pCC in the resting state of patients is weakened compared with that observed in HCs. The FC of the anterior wedge of patients with brain injury was weakened compared with that reported in HCs.33 A decrease in the FC value of the precuneus was also observed in patients with anisometropic amblyopia12 and comitant exotropia.10,9 A study showed that individual sensitivity to pain varies depending on precuneus reactivity.34 This is consistent with the results of the present study. The FC value of the precuneus decreased in patients with NVG, and this effect may be related to pain tolerance.
The cuneus is a wedge-shaped area between the posterior and parietal sulci involved in the processing of visual information. A study reported that the cuneus is activated almost simultaneously with the V1 in response to a visual stimulus, and may act to modulate signals travelling from the V1 to the extrastriate cortices.35 Studies of world-class gymnasts using voxel-based morphological measurements showed significant structural changes in the cuneus.36 Another study suggested that the cuneus is associated with panic disorder.37 The same changes in brain function have been observed in eye diseases. Investigators illustrated that the FC of the cuneus decreased in glaucoma,8,16,7,16 acute open globe injury,17 and monocular blindness.15 Consistent with these previous studies, in the present study, we detected a significant reduction in FC between the bilateral V1 and bilateral cuneus, indicating the severity of NVG and visual quality. Collectively, these findings imply a functional deficiency in patients with NVG, providing new evidence that the NVG may result in dysfunction of the cuneus.
In the present study, the mean FC values of specific regions of interest were determined and subjected to ROC curve analyses. An AUC >0.8 denoted excellent accuracy. In the present ROC curve analysis, excellent AUC values were obtained for all regions of interests. This indicates that the FC methodology may provide promising biological indicators for distinguishing patients with NVG from HCs.
Limitations
There were several limitations in our research. Firstly, the number of patients with NVG included in the study was relatively small. The small sample size may induce errors in the experimental results. Secondly, patients with NVG suffer from a sudden loss of vision and physical discomfort caused by high IOP, which is likely to cause psychological distress, irritable ratio, low mood, and other mental symptoms. The neuropsychological state of patients should be evaluated before fMRI examination to exclude the influence of the emotional state. Thirdly, the present study included patients with Stage III NVG. Thus, we did not evaluate whether patients with the other two stages of the disease exhibit the same changes in brain areas. In subsequent studies, we can further compare the changes in brain FC caused by NVG in different stages.
Conclusion
The present study was the first to report that brain activity disorders occur in patients with NVG. In the future, FC signals may provide guidance for the early detection of the neuropathological mechanisms of NVG, and provide a basis for clinical diagnosis.
Disclosure
This was not an industry-supported study; the authors report no conflicts of interest in this work.
References
1. J W K, Jee D, La TY. Neovascular glaucoma after vitrectomy in patients with proliferative diabetic retinopathy. Medicine. 2017;96(10):e6263. doi:10.1097/MD.0000000000006263
2. Kwon J, Sung KR. Effect of preoperative intravitreal bevacizumab on the surgical outcome of neovascular glaucoma at different stages. J Ophthalmol. 2017;2017(3):1–7. doi:10.1155/2017/7672485
3. Al-Bahlal A, Khandekar R, Rubaie KA, et al. Changing epidemiology of neovascular glaucoma from 2002 to 2012 at king khaled eye specialist hospital, Saudi Arabia. Indian J Ophthalmol. 2017;65(10):969–973. doi:10.4103/ijo.IJO_33_17
4. Rodrigues GB, Abe RY, Zangalli C, et al. Neovascular glaucoma: a review. Int J Retina Vitreous. 2016;2(1):26–35. doi:10.1186/s40942-016-0051-x
5. Jia X, Duan X. Application of anti-VEGF agents in treatment of neovascular glaucoma and anti-scarring in filtering surgery. Chin j Ophthalmol. 2015;51(4):314–318.
6. Jaulim A, Ahmed B, Khanam T, et al. Branch retinal vein occlusion epidemiology, pathogenesis, risk factors, clinical features, diagnosis, and complications. an update of the literature. Retina. 2013;33(5):901–910. doi:10.1097/IAE.0b013e3182870c15
7. Shenghong L, Ping L, Honghan G, et al. Intrinsic functional connectivity alterations of the primary visual cortex in primary angle-closure glaucoma patients before and after surgery: a resting-state fMRI study. PLoS One. 2017;12(1):e0170598. doi:10.1371/journal.pone.0170598
8. Kun D, Yong L, Xiaohe Y, et al. Altered functional connectivity of the primary visual cortex in subjects with amblyopia. Neural Plast. 2013;2013:1–8.
9. Zhu PW, Huang X, Ye L, et al. Altered intrinsic functional connectivity of the primary visual cortex in youth patients with comitant exotropia: a resting state fMRI study. Int J Ophthalmol. 2018;11(4):668–673. doi:10.18240/ijo.2018.04.22
10. Yan X, Wang Y, Xu L, et al. Altered functional connectivity of the primary visual cortex in adult comitant strabismus: a resting-state functional MRI study. Curr Eye Res. 2019;44(3):316–323. doi:10.1080/02713683.2018.1540642
11. Chao-Gan Y, Yu-Feng Z, et al. DPARSF: a MATLAB toolbox for “Pipeline” data analysis of resting-state fMRI. Front Syst Neurosci. 2010;4:13–19. doi:10.3389/fnsys.2010.00013
12. Ding K, Liu Y, Yan X, et al. Altered functional connectivity of the primary visual cortex in subjects with amblyopia. Neural Plast. 2013;2013:612086. doi:10.1155/2013/612086
13. Burton H, Snyder AZ, Raichle ME. Resting state functional connectivity in early blind humans. Front Syst Neurosci. 2014;8(1):51–66. doi:10.3389/fnsys.2014.00051
14. Wen Z, Zhou F-Q, Huang X, et al. Altered functional connectivity of primary visual cortex in late blindness. Neuropsychiatr Dis Treat. 2018;14:3317–3327. doi:10.2147/NDT.S183751
15. Shao Y, Bao J, Huang X, et al. Comparative study of interhemispheric functional connectivity in left eye monocular blindness versus right eye monocular blindness: a resting-state functional MRI study. Oncotarget. 2018;9(18):14285–14295. doi:10.18632/oncotarget.v9i18
16. Wang J, Li T, Zhou P, et al. Altered functional connectivity within and between the default model network and the visual network in primary open-angle glaucoma: a resting-state fMRI study. Brain Imaging Behav. 2016;11(4):1–10.
17. Ye L, Wei R, Huang X, et al. Reduction in interhemispheric functional connectivity in the dorsal visual pathway in unilateral acute open globe injury patients: a resting-state fMRI study. Int J Ophthalmol. 2018;11(6):1056–1060. doi:10.18240/ijo.2018.06.26
18. Dan HD, Zhou FQ, Huang X, Xing YQ, Shen Y. Altered intra- and inter-regional functional connectivity of the visual cortex in individuals with peripheral vision loss due to retinitis pigmentosa. Vision Res. 2019;159:68–75. doi:10.1016/j.visres.2019.02.013
19. Weibert K, Andrews TJ. Activity in the right fusiform face area predicts the behavioural advantage for the perception of familiar faces. Neuropsychologia. 2015;75:588–596. doi:10.1016/j.neuropsychologia.2015.07.015
20. Scherf KS, Elbich D, Minshew N, et al. Individual differences in symptom severity and behavior predict neural activation during face processing in adolescents with autism. Neuroimage Clin. 2015;7:53–67. doi:10.1016/j.nicl.2014.11.003
21. Dai H, Morelli JN, Ai F, et al. Resting-state functional MRI: functional connectivity analysis of the visual cortex in primary open-angle glaucoma patients. Hum Brain Mapp. 2013;34(10):2455–2463. doi:10.1002/hbm.v34.10
22. Dong JW, Brennan NMP, Izzo G, et al. fMRI activation in the middle frontal gyrus as an indicator of hemispheric dominance for language in brain tumor patients: a comparison with broca’s area. Neuroradiology. 2016;58(5):513–520. doi:10.1007/s00234-016-1655-4
23. Marine V, Romain Q, Lorena C, et al. Frontal eye field, where art thou? Anatomy, function, and non-invasive manipulation of frontal regions involved in eye movements and associated cognitive operations. Front Integr Neurosci. 2014;8:66–90. doi:10.3389/fnint.2014.00066
24. Fernandes HL, Stevenson IH, Phillips AN, et al. Saliency and saccade encoding in the frontal eye field during natural scene search. Cereb Cortex. 2014;24(12):3232–3245. doi:10.1093/cercor/bht179
25. Japee S, Holiday K, Satyshur MD, Mukai I, Ungerleider LG. A role of right middle frontal gyrus in reorienting of attention: a case study. Front Syst Neurosci. 2015;9:23–49. doi:10.3389/fnsys.2015.00023
26. Huang X, Li D, Li HJ, et al. Abnormal regional spontaneous neural activity in visual pathway in retinal detachment patients: a resting-state functional MRI study. Neuropsychiatr Dis Treat. 2017;13:2849–2854. doi:10.2147/NDT.S147645
27. Szlyk JP, Little DM. An FMRI study of word-level recognition and processing in patients with age-related macular degeneration. Invest Ophthalmol Vis Sci. 2009;50(9):4487–4495. doi:10.1167/iovs.08-2258
28. Hamamatsu T, Nakagawa Y, Tamai M, et al. Visual processing in patients with macular hole. Tohoku J Exp Med. 2000;190(4):249–260. doi:10.1620/tjem.190.249
29. Wirth M, Jann K, Dierks T, et al. Semantic memory involvement in the default mode network: a functional neuroimaging study using independent component analysis. Neuroimage. 2011;54(4):3057–3066. doi:10.1016/j.neuroimage.2010.10.039
30. Freton M, Lemogne C, Bergouignan L, et al. The eye of the self: precuneus volume and visual perspective during autobiographical memory retrieval. Brain Struct Funct. 2014;219(3):959–968. doi:10.1007/s00429-013-0546-2
31. Bruner E, Preuss TM, Chen X, et al. Evidence for expansion of the precuneus in human evolution. Brain Struct Funct. 2016;222(2):1–8. doi:10.1007/s00429-016-1218-9
32. Zhu Y, Gao B, Hua J, et al. Effects of methylphenidate on resting-state brain activity in normal adults: an fMRI study. Neurosci Bull. 2013;29(1):16–27. doi:10.1007/s12264-013-1306-2
33. Annen J, Heine L, Ziegler E, et al. Function-structure connectivity in patients with severe brain injury as measured by MRI-DWI and FDG-PET. Hum Brain Mapp. 2016;37(11):3707–3720. doi:10.1002/hbm.v37.11
34. Goffaux P, Lydia G-T, Marchand S, et al. Individual differences in pain sensitivity vary as a function of precuneus reactivity. Brain Topogr. 2014;27(3):366–374. doi:10.1007/s10548-013-0291-0
35. Vanni S, Tanskanen T, Seppa M, et al. Coinciding early activation of the human primary visual cortex and anteromedial cuneus. Proc Natl Acad Sci. 2001;98(5):2776–2780. doi:10.1073/pnas.041600898
36. Huang R, Lu M, Song Z, Wang J. Long-term intensive training induced brain structural changes in world class gymnasts. Brain Struct Funct. 2015;220(2):625–644. doi:10.1007/s00429-013-0677-5
37. Lai CH, Wu YT. Decreased regional homogeneity in lingual gyrus, increased regional homogeneity in cuneus and correlations with panic symptom severity of first-episode, medication-na?ve and late-onset panic disorder patients. Psychiatry Res. 2013;211(2):127–131. doi:10.1016/j.pscychresns.2012.11.006
 © 2020 The Author(s). This work is published and licensed by Dove Medical Press Limited. The
full terms of this license are available at https://www.dovepress.com/terms
and incorporate the Creative Commons Attribution
- Non Commercial (unported, 3.0) License.
By accessing the work you hereby accept the Terms. Non-commercial uses of the work are permitted
without any further permission from Dove Medical Press Limited, provided the work is properly
attributed. For permission for commercial use of this work, please see paragraphs 4.2 and 5 of our Terms.
© 2020 The Author(s). This work is published and licensed by Dove Medical Press Limited. The
full terms of this license are available at https://www.dovepress.com/terms
and incorporate the Creative Commons Attribution
- Non Commercial (unported, 3.0) License.
By accessing the work you hereby accept the Terms. Non-commercial uses of the work are permitted
without any further permission from Dove Medical Press Limited, provided the work is properly
attributed. For permission for commercial use of this work, please see paragraphs 4.2 and 5 of our Terms.