Back to Journals » Neuropsychiatric Disease and Treatment » Volume 15
Altered intrinsic brain activity in patients with toothaches using the amplitude of low-frequency fluctuations: a resting-state fMRI study
Authors Yang J, Li B, Yu QY, Ye L, Zhu PW ![]() , Shi WQ
, Shi WQ ![]() , Yuan Q
, Yuan Q ![]() , Min YL, He YL, Shao Y
, Min YL, He YL, Shao Y ![]()
Received 6 October 2018
Accepted for publication 11 December 2018
Published 18 January 2019 Volume 2019:15 Pages 283—291
DOI https://doi.org/10.2147/NDT.S189962
Checked for plagiarism Yes
Review by Single anonymous peer review
Peer reviewer comments 2
Editor who approved publication: Dr Yu-Ping Ning
Jun Yang,1 Bin Li,2 Qiu-Yue Yu,2 Lei Ye,3 Pei-Wen Zhu,3 Wen-Qing Shi,3 Qing Yuan,3 You-Lan Min,3 Yu-Lin He,2 Yi Shao3
1Department of Prosthodontics, The Affiliated Stomatological Hospital of Nanchang University, Nanchang, China; 2Department of Radiology, The First Affiliated Hospital of Nanchang University, Nanchang, China; 3Department of Ophthalmology, The First Affiliated Hospital of Nanchang University, Nanchang, China
Background: The results of previous studies have indicated that pain-associated diseases can result in marked functional and anatomical alterations in the brain. However, differences in spontaneous brain activity occurring in toothache (TA) patients remain unclear.
Objective: This study investigated intrinsic brain activity changes in TA subjects using the amplitude of low-frequency fluctuation (ALFF) technique.
Methods: A total of 18 patients with TA (eight males, and 10 females) and 18 healthy controls (HCs) who were matched for gender, age, and educational status were enrolled. Resting-state functional MRI was used to examine the participants. Spontaneous cerebral activity variations were investigated using the ALFF technique. The mean ALFF values of the TA patients and the HCs were classified using receiver operating characteristic (ROC) curves. The correlations between ALFF signals of distinct regions of the cerebrum and the clinical manifestations of the TA patients were evaluated using Pearson’s correlation analysis.
Results: Compared with HCs, TA patients showed notably higher ALFF in the left postcentral gyrus, right paracentral lobule, right lingual gyrus, right inferior occipital gyrus, left fusiform gyrus, and right superior occipital gyrus. ROC curve analysis of each brain region showed that the accuracy area under the curve was excellent. In the TA group, the visual analog scale of the left side was positively correlated with the ALFF signal values of the right paracentral lobule (r=0.639, P=0.025).
Conclusion: Multiple brain regions, including pain- and vision-related areas, exhibited aberrant intrinsic brain activity patterns, which may help to explain the underlying neural mechanisms in TA.
Keywords: toothache, functional MRI, ALFF, intrinsic brain activity, pain, resting-state
Background
Toothache (TA), also known as dentalgia, is pain in the dental pulp and/or periodontal tissues resulting from dental or non-dental diseases.1 Severe TA can affect sleep quality, eating and nutrition, speech, and other daily activities. Exploring the cerebral processes related to TA pain using neuroimaging is a comparatively new technique in dental neuroscience, and it may help to elucidate the underlying pathological alterations and physiological mechanisms.
Functional MRI (fMRI) can provide in vivo scans with accurate spatial resolution and has been increasingly utilized in recent years for noninvasive neuroimaging that allows for assessment of functional alterations in the human brain.2,3 Scientists can detect activation of specific brain regions, and these data allow them to investigate the dimensional organization of the brain based on detailed analytic evidence of cerebral blood flow and metabolic patterns. Previous reports have utilized fMRI to probe cerebral activity changes in patients with painful diseases, and diverse experimental nociceptive stimuli activate many brain regions, including the primary somatosensory cortex (S1), secondary somatosensory cortex (S2), thalamus, anterior cingulate cortex (ACC), and insula.4–10 Ettlin et al,8 and later Weigelt et al,9 reported that blood oxygen level-dependent (BOLD) signals increase in S1 during dental electrical stimulation. Moisset et al11 reported that patients with trigeminal neuralgia had BOLD activation in the regions of S1, S2, insula, ACC, and the thalamus. A recent study in patients with low back pain showed that BOLD signals declined in the precuneus and left S1, but increased in the medial prefrontal cortex, insula, and ACC.12 And patients with acute eye pain have higher regional homogeneity in the right inferior parietal lobule, right superior frontal gyrus, precuneus, and left superior frontal gyrus.13
However, most of the studies focused on the stimulation of TA, in other words, the subjects were under a tasking-state. The “amplitude of low-frequency fluctuation” (ALFF) is a resting-state fMRI (rs-fMRI) analysis technique that elucidates the regional intrinsic brain activity level occurring at rest by evaluating spontaneous fluctuations in BOLD signals. Thus, ALFF is an index in which the square root of the power spectrum is integrated in a low-frequency range, reflecting the intensity of the regional spontaneous brain activity. Previous studies have demonstrated that the ALFF has good-to-moderate test–retest reliability. The simple calculation and reliable characterization of the ALFF measurement makes it a useful tool for rs-fMRI data analysis to investigate a disease trait.
The present study used the ALFF technique to compare the spontaneous cerebral activity in TA patients to that in healthy controls (HCs) and correlate the results with the patients’ clinical features, to determine whether the S1, ACC, and insula would be activated during the resting state as indicated by previous tasking studies.
Materials and methods
Participants
The study enrolled 18 patients with TA (eight males and 10 females) from two hospitals – the Affiliated Stomatological Hospital and the First Affiliated Hospital of Nanchang University. Then, 18 HCs (eight males and 10 females) were recruited and matched to the TA group for age, gender, and educational status. The level of education was assessed according to the standard 9-year compulsory education provided in China plus higher education, including primary school, junior high school, high school, university, and so on. All of the participants conformed to the following criteria: 1) the MRI revealed no apparent deformities in the brain parenchyma; 2) they had no history of psychiatric disease, cerebral infarction, or cardiovascular disease; 3) none of the subjects had a history of drug addiction or alcoholism; and 4) none were claustrophobic, and thus, could tolerate the MRI examination.
Inclusion criteria for the TA patients were as follows: 1) dental pulp and/or periodontal tissue pain caused by dental or non-dental diseases was present; 2) acute and chronic TA was present; 3) they had no other comorbid pain diseases; 4) they could tolerate MRI examination; 5) conventional MRI T1WI, T2WI sequence examination revealed no obvious abnormal signals in the brain; and 6) they had TAs with no evident cause that could not be attributed to another disease. Exclusion criteria were as follows: 1) headache, temporomandibular joint disorders, fibromyalgia, back pain, or other non-dental pain; 2) a family history of headache or other pain syndromes in first degree relatives, 3) other somatic or psychiatric diseases, and 4) contraindications to magnetic resonance scanning.
Eighteen HCs (eight males, 10 females) with similar age range, gender ratio, and educational status compared with the TA group were enrolled. Inclusion criteria of HCs were as follows: 1) No TA symptoms, 2) no deformities in the brain parenchyma were identified on MRI; 3) no psychiatric disease, cardiovascular disease, or cerebral infarction disease was known; 4) history of drug or alcohol addiction was denied; and 5) they were capable of undergoing MRI examination.
This study complied with the Declaration of Helsinki and had formal approval by the Medical Ethics Committee of the Affiliated Stomatological Hospital and First Affiliated Hospital of Nanchang University. All volunteers signed informed consent forms after disclosure of the objectives, protocol, and inherent risks of the study.
Pain evaluation
The pain of patients with TA was quantified using the standard 10-point visual analog scale (VAS). The patients used a 10-cm ruler to rate their pain from 0 to 10. A higher score indicated greater pain intensity. The rating of “0” represented no pain, and a “10” meant severe and extremely intolerable pain.14
MRI parameters
A Trio 3-Tesla MR scanner (Siemens, Munich, Germany) was used to perform the MRI scans. All the subjects were instructed to keep their eyes closed and maintain natural shallow breathing until the scan was over. A 3D spoiled gradient recalled echo pulse sequence was applied to acquire the functional data: 176 structural images and 240 functional images. The parameters for obtaining structural images: acquisition matrix =256×256, feld of view =250×250 mm, echo time =2.26 ms, repetition time =1,900 ms, thickness =1.0 mm, gap =0.5 mm, and flip angle =9°. The parameters for obtaining functional images: acquisition matrix =64×64, feld of view =220×220 mm, thickness =4.0 mm, gap =1.2 mm, repetition time =2,000 ms, echo time =30 ms, flip angle =90°, and 29 axial. The examinations lasted for 15 minutes.
fMRI data processing
The method of functional data analysis was described in our previous report.15 We first applied MRIcro software to remove incomplete data. During magnetization equilibration, the first 15 time points were discarded. The Data Processing Assistant for rs-fMRI advanced edition (DPARSFA 4.0, http://rfmri.org/DPARSF) software was used for head motion correction, spatial normalization, slice timing, digital imaging communications in medicine form transformation, and full-width smoothing with a Gaussian kernel of 6×6×6 mm3 at half-maximum, based on the rs-fMRI data analysis toolkit (REST, http://www.restfmri.net) and Statistical Parametric Mapping software (SPM8, http://www.fil.ion.ucl.ac.uk/spm). Subjects were excluded if they had excessive angular motion or >1.5 mm maximum shift in the x, y, or z direction during the fMRI examination. Head motion artifacts were removed by the technique of Mechelli et al using six motion parameters, since the higher-order models were recently reported to be more effective.15 False variables with signals from a region centered in the brain white matter and a ventricular region of interest (ROI) were eliminated using linear regression. After correcting for head motion, the functional images were standardized to meet the Montreal Neurological Institute space criteria using a standard echo planar image template. The global effects of variability were reduced by dividing the ALFF of each voxel by the global mean ALFF of each subject.
Brain–behavior correlation analysis
REST software was used to classify brain regions with differences of the ALFF value between the two groups as ROI, after which the mean ALFF value was calculated for each by averaging over all voxels. The relationship between behavioral performance and the mean ALFF value in each ROI was analyzed using linear correlation analysis in TA group. Differences with a P<0.05 were considered statistically significant.
Statistical analysis
SPSS software version 20.0 (IBM Corporation, Armonk, NY, USA) was used to compare the demographic and clinical variables of the TA and HC groups via independent sample t-tests and chi-square tests. Differences of P<0.05 were considered statistically significant. Functional data were compared using the two-sample t-test in REST software. The statistical threshold of voxel level for multiple comparisons using Gaussian random field theory was set at P<0.05. The voxel-level AlphaSim was corrected at P<0.01 and cluster size >40 voxels.
Receiver operating characteristic (ROC) curves were used to classify the mean ALFF value regions of the cerebrum that were distinct between the TA subjects and HCs. The correlations between the obtained ALFF and the clinical features of TA patients were investigated using Pearson’s correlation analysis.
Results
Demographics and behavioral results
There were no statistically significant differences in age (P=0.679) between the TA patients and the HCs. The educational level of all patients matched with that of the HCs. The duration of the TA was 0.17±0.09 years (Tables 1 and 2).
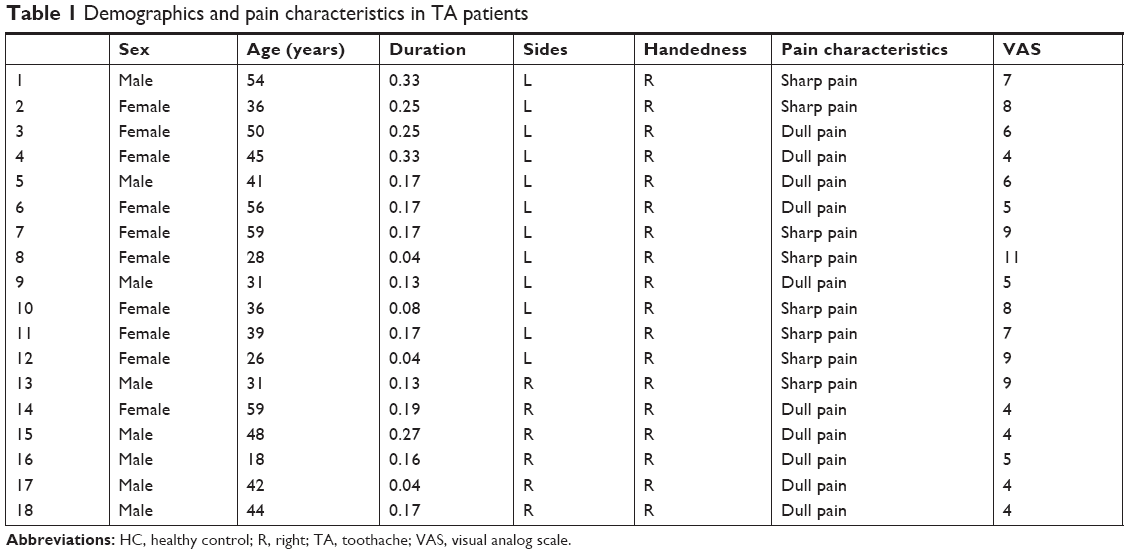 | Table 1 Demographics and pain characteristics in TA patients |
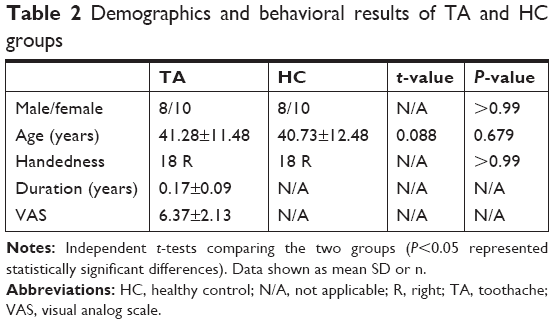 | Table 2 Demographics and behavioral results of TA and HC groups |
ALFF differences
The ALFF values of the TA group were significantly increased in brain regions, including the left fusiform gyrus, as well as the postcentral, right inferior and superior occipital gyri, the lingual gyrus, and the paracentral lobule (Figure 1A, B and Table 3). The mean ALFF between the two groups is shown in Figure 1C. However, there was no correlation between the ALFF values of the distinct cerebrum regions and the clinical manifestations in the TA group (P>0.05).
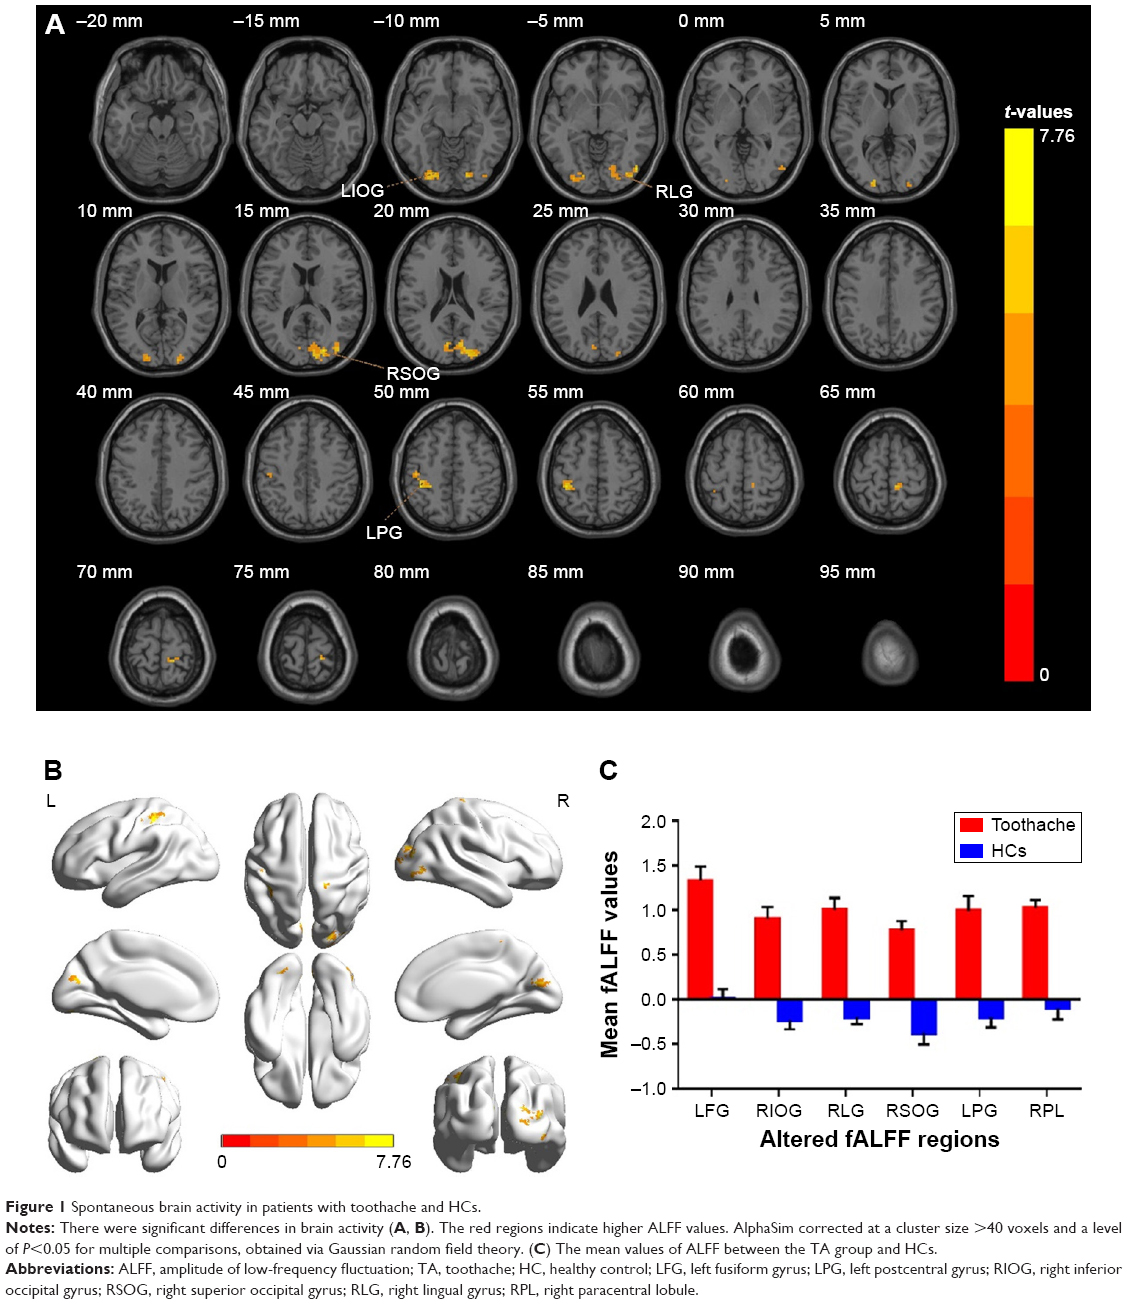 | Figure 1 Spontaneous brain activity in patients with toothache and HCs. |
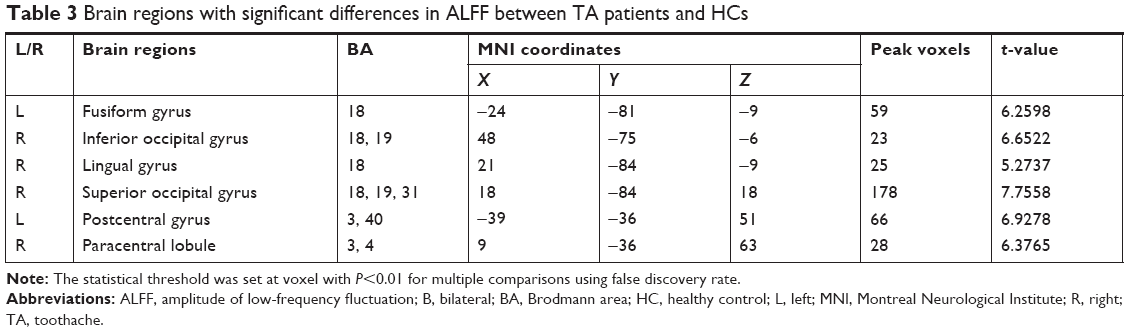 | Table 3 Brain regions with significant differences in ALFF between TA patients and HCs |
ROC curve
We hypothesized that the differences of ALFF values could be potentially useful diagnostic markers to distinguish the TA group from HCs. The ROC curve method was performed to verify this assumption. The mean ALFF values of distinct areas of the cerebrum were collected and analyzed. Accuracy is considered to be low if the area under the curve (AUC) is 0.5–0.7, but when the AUC is 0.7–0.9, it denotes high accuracy. The individual AUC values of the ALFF found in different regions were as follows: left fusiform gyrus (0.967, P<0.001), right inferior occipital gyrus and right superior occipital gyrus (0.992, P<0.001), right lingual gyrus (1.000, P<0.001), left postcentral gyrus (0.950, P<0.001), and right paracentral lobule (0.983, P<0.001) (Figure 2).
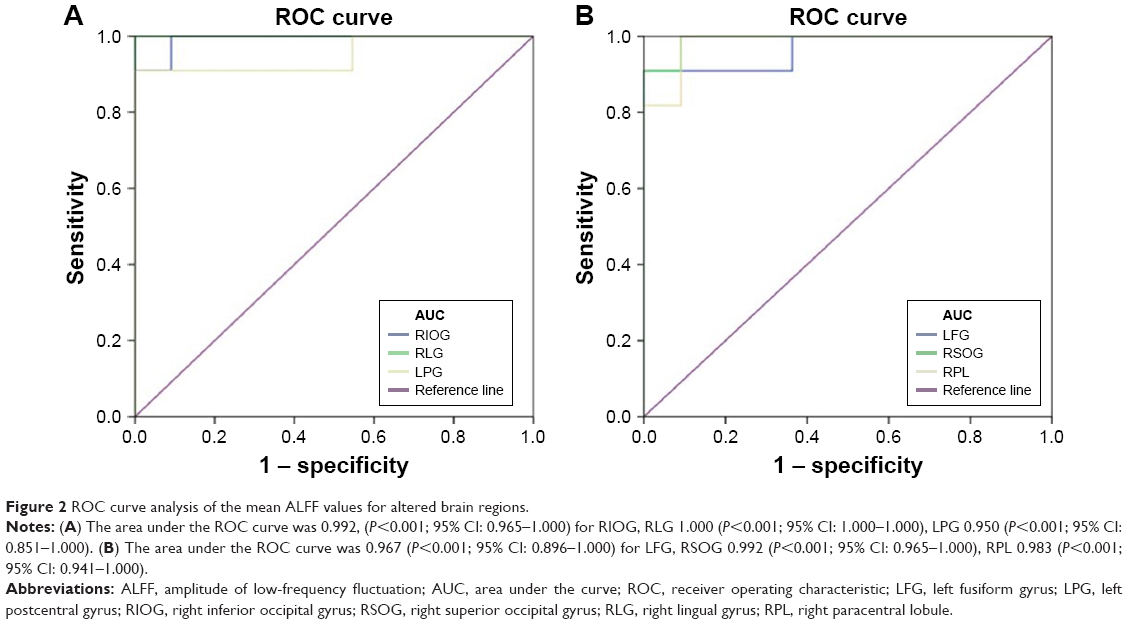 | Figure 2 ROC curve analysis of the mean ALFF values for altered brain regions. |
Correlation analysis
In the TA group, the VAS of the left side positively correlated with the ALFF signal values of the right paracentral lobule (r=0.639, P=0.025, Figure 3).
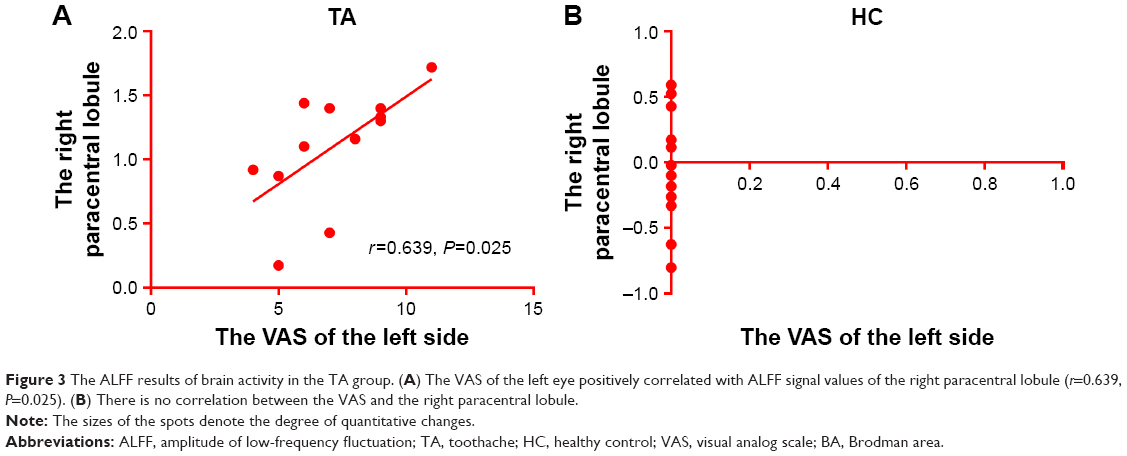 | Figure 3 The ALFF results of brain activity in the TA group. (A) The VAS of the left eye positively correlated with ALFF signal values of the right paracentral lobule (r=0.639, P=0.025). (B) There is no correlation between the VAS and the right paracentral lobule. |
Discussion
fMRI is a reliable functional brain imaging technique and the ALFF method has been successfully applied in several pain-related diseases and has been predicted to have huge prospects for development (Table 4). In this study, we demonstrated that the intrinsic patterns of brain activity in different regions of individuals with TA were altered compared with the findings from HCs. The ALFF signal values of TA patients were significantly increased in the left fusiform gyrus, postcentral and right inferior occipital gyri, superior occipital gyrus, lingual gyrus, and paracentral lobule when they reported increased dental pain (Figure 4). The VAS showed a positive correlation with the right paracentral lobule (Figure 3). We did not find any regions of the brain with decreased values associated with ALFF, compared with HCs, and, therefore, it was not discussed in this article.
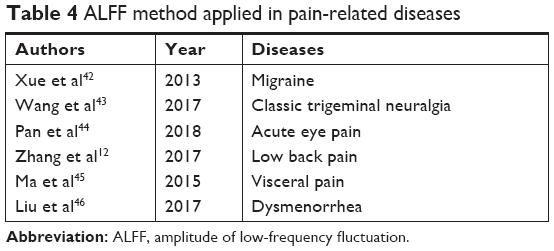 | Table 4 ALFF method applied in pain-related diseases |
 | Figure 4 Correlations between mean ALFF signal values and behavioral performance. |
The postcentral gyrus, known as the primary somatosensory cortex (S1), is located in the lateral parietal lobe of the human brain, and is believed to play a critical part in processing tactile sensations and nociception.16,17 Previous studies have demonstrated that S1 activity is involved in many pain-related diseases.5,18,19 Research of pain from heat stimuli showed that the S1 tissue was commonly activated when these stimuli were present.20–23 Binkofski et al24 and Strigo et al25 described painful esophageal distention that led to significant cerebral activation patterns in S1, and Baciu et al26 reported similar S1 activation in patients with rectal pain. Furthermore, recent chronic pain research involved increased brain connectivity to S1 in patients with rheumatoid arthritis.27 In support of the prior results, we also inspected that subjects with TA showed significant higher ALFF values in the left postcentral gyrus, indicating activation of brain activities in S1, which confirmed the association with sensory of pain.
The paracentral lobule is in the upper medial part of the precentral gyrus and plays a pivotal role in the motor and sensory innervation of the contralateral lower extremity. In previous studies, Li et al28 reported that brain areas, including bilateral paracentral lobule and the right thalamus were activated by acupuncture treatments. Erpelding et al29 found that cortical thickening in the paracentral lobule correlated with higher sensitivity to cool stimulation, and an analogous cortical thickening in the right paracentral lobule was observed in individuals with chronic low back pain.30 Studies using transcutaneous electrical nerve stimulation reported that significant pain-related activation occurred in the S1, S2 regions and paracentral lobule.31 In line with these reports, the increase in ALFF values in the right paracentral lobule shown in the present study may reflect the activation in this region, indicating a relation to painful sensations.
The fusiform gyrus is situated at the basal surface of the temporal and occipital lobes and is concerned with multisensory integration and cognitive processing.32 It has been reported that the experience of pain correlated not only with increasingly painful sensations but also with increasing fear or anxiety.33,34 Glass et al35 detected hyperactivation in the right fusiform gyrus and the inferior temporal gyrus in fibromyalgia patients. Several studies about migraineurs revealed stronger pain-induced activation in the fusiform gyrus and S1,36,37 and the gray matter volume was also increased in the left fusiform gyrus in the headache patients compared with the controls.38,39 Moreover, greater activation occurred in the parahippocampal gyrus and fusiform gyrus during pricking pain test conditions.40 Consistent with these results, the higher ALFF values in the left fusiform gyrus in the present study could represent activation of this cognition-related area during dental pain, reflecting the anxiety of the TA patients.
The occipital lobe is located at the rear of the skull, behind the parietal and temporal lobes, and contains the visual processing center. This center has different regions pertaining to visual communication. The lingual gyrus is part of the occipital lobe, which is situated between the posterior collateral sulcus and the calcarine sulcus, and is implicated in logical analysis and visual memory encoding.41 Previous studies have provided inconsistent findings for this region. Some studies reported that in patients with migraine, gray matter intensity was reduced in some regions of the occipital cortex,47 and cerebral blood flow and the volume of the occipital cortex were also decreased.48 A recent functional connectivity analysis also reported a negative correlation with diabetic neuropathic pain in the cortical network activity in the left lingual gyrus and the right inferior occipital gyrus but a positive correlation in the controls.49 However, Brügger et al50 claimed that tooth stimulation was associated with increased BOLD responses across a distributed brain network, including the S1, occipital areas, and supplementary motor areas. Flodin et al27 also detected an increase in brain connectivity between the ACC and occipital areas in rheumatoid arthritis patients. And another study of dental stimulation has shown that activity in the lingual gyrus significantly increased.8 In the current research, we observed that the TA patients exhibited higher ALFF in the right inferior occipital gyrus, the superior occipital gyrus, and the right lingual gyrus, suggesting that an activation of visual processing occurred. This may have been influenced by the dental pain, despite the fact that the subjects were asked to close their eyes during the scanning procedure.
We noticed that the areas with abnormal ALFF values were distributed in different brain regions of different hemispheres, but from three-dimensional images and BA partitions, these brain regions were basically symmetrical (Figure 1 and Table 3). In our patients, some lesions are on the left and some on the right, and the sensory neural pathways of TA intersect to the opposite side on the secondary neurons, so it is not difficult to understand that TA on one side can lead to abnormal ALFF values in the opposite hemisphere and the abnormal brain areas are distributed in different hemispheres and are basically symmetrical.51
Conclusion
In summary, this study showed that our patients with TA had abnormal spontaneous neural activity in specific cerebrum regions. This provided insight into the variation of central nervous system activity in TA patients and revealed potential pathological mechanisms for TA pain. The ALFF signals could be an effective marker to reflect pain severity.
However, several limitations existed in the current study, and they include the small sample size, which would have to be expanded in future studies to provide more precise results. And the clinical characteristics we were able to utilize in this study were not rigorous. For instance, we included patients with different kinds of dental pain, and these different categories of pain should be distinguished in future studies so as to be able to evaluate brain functional activity changes more accurately. In spite of these defects, however, the present study revealed that the pathogenesis of TA pain had relevant relationships to impairment in specific brain regions.
Acknowledgment
The study was funded by the National Natural Science Foundation of China (No: 81660158, 81400372); Natural Science Key Project of Jiangxi Province (No: 20161ACB21017); Key Research Foundation of Jiangxi Province (No: 20151BBG70223, 20181BBG70004); Youth Science Foundation of Jiangxi Province (No: 20151BAB215016, 20161BAB215198); Education Department Key Project of Jiangxi Province (No: GJJ160020); Teaching Reform of Degree and Graduate Education Research Project of Jiangxi Province (No: JXYJG-2018-013); Grassroots Health Appropriate Technology “Spark Promotion Plan” Project of Jiangxi Province (No: 20188003); and the Health Development Planning Commission Science Foundation of Jiangxi Province (No: 20175291).
Disclosure
The authors report no conflicts of interest in this work.
References
Raab WH. Acute and chronic toothache. Dtsch Zahnarztl Z. 1991;46(2):101–108. | ||
Brown HD, Woodall RL, Kitching RE, Baseler HA, Morland AB. Using magnetic resonance imaging to assess visual deficits: a review. Ophthalmic Physiol Opt. 2016;36(3):240–265. | ||
Goodyear BG, Menon RS. Brief visual stimulation allows mapping of ocular dominance in visual cortex using fMRI. Hum Brain Mapp. 2001;14(4):210–217. | ||
DaSilva AF, Becerra L, Makris N, et al. Somatotopic activation in the human trigeminal pain pathway. J Neurosci. 2002;22(18):8183–8192. | ||
Apkarian AV, Bushnell MC, Treede RD, Zubieta JK. Human brain mechanisms of pain perception and regulation in health and disease. Eur J Pain. 2005;9(4):463–484. | ||
Becerra L, Breiter HC, Wise R, Gonzalez RG, Borsook D. Reward circuitry activation by noxious thermal stimuli. Neuron. 2001;32(5):927–946. | ||
Coghill RC, Gilron I, Iadarola MJ. Hemispheric lateralization of somatosensory processing. J Neurophysiol. 2001;85(6):2602–2612. | ||
Ettlin DA, Brügger M, Keller T, et al. Interindividual differences in the perception of dental stimulation and related brain activity. Eur J Oral Sci. 2009;117(1):27–33. | ||
Weigelt A, Terekhin P, Kemppainen P, Dörfler A, Forster C. The representation of experimental tooth pain from upper and lower jaws in the human trigeminal pathway. Pain. 2010;149(3):529–538. | ||
Fomberstein K, Qadri S, Ramani R. Functional MRI and pain. Curr Opin Anaesthesiol. 2013;26(5):588–593. | ||
Moisset X, Villain N, Ducreux D, et al. Functional brain imaging of trigeminal neuralgia. Eur J Pain. 2011;15(2):124–131. | ||
Zhang SS, Wu W, Yang JM, Wang CH. Abnormal spontaneous brain activity in acute low-back pain revealed by resting-state functional MRI. Am J Phys Med Rehabil. 2017;96(4):253–259. | ||
Tang LY, Li HJ, Huang X, et al. Assessment of synchronous neural activities revealed by regional homogeneity in individuals with acute eye pain: a resting-state functional magnetic resonance imaging study. J Pain Res. 2018;11:843–850. | ||
Johnson EW. Visual analog scale (VAS). Am J Phys Med Rehabil. 2001;80(10):717. | ||
Mechelli A, Price CJ, Friston KJ, Ashburner J. Voxel-based morphometry of the human brain: methods and applications. Curr Med Imaging Rev. 2005;1(2):105–113. | ||
Pihko E, Nangini C, Jousmäki V, Hari R. Observing touch activates human primary somatosensory cortex. Eur J Neurosci. 2010;31(10):1836–1843. | ||
Ploner M, Schmitz F, Freund HJ, Schnitzler A. Differential organization of touch and pain in human primary somatosensory cortex. J Neurophysiol. 2000;83(3):1770–1776. | ||
Frot M, Magnin M, Mauguière F, Garcia-Larrea L. Cortical representation of pain in primary sensory-motor areas (S1/M1) – a study using intracortical recordings in humans. Hum Brain Mapp. 2013;34(10):2655–2668. | ||
Peyron R, Laurent B, García-Larrea L. Functional imaging of brain responses to pain. A review and meta-analysis (2000). Neurophysiol Clin. 2000;30(5):263–288. | ||
Chen JI, Ha B, Bushnell MC, Pike B, Duncan GH. Differentiating noxious- and innocuous-related activation of human somatosensory cortices using temporal analysis of fMRI. J Neurophysiol. 2002;88(1):464–474. | ||
Peyron R, García-Larrea L, Grégoire MC, et al. Haemodynamic brain responses to acute pain in humans: sensory and attentional networks. Brain. 1999;122(Pt 9):1765–1780. | ||
Bushnell MC, Duncan GH, Hofbauer RK, Ha B, Chen J-I, Carrier B. Pain perception: is there a role for primary somatosensory cortex? Proc Natl Acad Sci U S A. 1999;96(14):7705–7709. | ||
Bingel U, Quante M, Knab R, Bromm B, Weiller C, Büchel C. Single trial fMRI reveals significant contralateral bias in responses to laser pain within thalamus and somatosensory cortices. Neuroimage. 2003;18(3):740–748. | ||
Binkofski F, Schnitzler A, Enck P, et al. Somatic and limbic cortex activation in esophageal distention: a functional magnetic resonance imaging study. Ann Neurol. 1998;44(5):811–815. | ||
Strigo IA, Duncan GH, Boivin M, Bushnell MC. Differentiation of visceral and cutaneous pain in the human brain. J Neurophysiol. 2003;89(6):3294–3303. | ||
Baciu M, Bonaz BL, Papillon E. Central processing of rectal pain: a functional MR imaging study. Am J Neuroradiol. 1999;20(10):1920–1924. | ||
Flodin P, Martinsen S, Altawil R, et al. Intrinsic brain connectivity in chronic pain: a resting-state fMRI study in patients with rheumatoid arthritis. Front Hum Neurosci. 2016;10:107. | ||
Li C, Yang J, Park K, et al. Prolonged repeated acupuncture stimulation induces habituation effects in pain-related brain areas: an FMRI study. PLoS One. 2014;9(5):e97502. | ||
Erpelding N, Moayedi M, Davis KD. Cortical thickness correlates of pain and temperature sensitivity. Pain. 2012;153(8):1602–1609. | ||
Dolman AJ, Loggia ML, Edwards RR, et al. Phenotype matters: the absence of a positive association between cortical thinning and chronic low back pain when controlling for salient clinical variables. Clin J Pain. 2014;30(10):839–845. | ||
Seminowicz DA, Davis KD. Interactions of pain intensity and cognitive load: the brain stays on task. Cereb Cortex. 2007;17(6):1412–1422. | ||
Parise M, Kubo TT, Doring TM, Tukamoto G, Vincent M, Gasparetto EL. Cuneus and fusiform cortices thickness is reduced in trigeminal neuralgia. J Headache Pain. 2014;15(1):17. | ||
Jerjes W, Hopper C, Kumar M, et al. Psychological intervention in acute dental pain: review. Br Dent J. 2007;202(6):337–343. | ||
Lin CS, Niddam DM, Hsu ML. Meta-analysis on brain representation of experimental dental pain. J Dent Res. 2014;93(2):126–133. | ||
Glass JM, Williams DA, Fernandez-Sanchez ML, et al. Executive function in chronic pain patients and healthy controls: different cortical activation during response inhibition in fibromyalgia. J Pain. 2011;12(12):1219–1229. | ||
Schwedt TJ, Chong CD, Chiang CC, Baxter L, Schlaggar BL, Dodick DW. Enhanced pain-induced activity of pain-processing regions in a case-control study of episodic migraine. Cephalalgia. 2014;34(12):947–958. | ||
Ter Minassian A, Ricalens E, Humbert S, Duc F, Aubé C, Beydon L. Dissociating anticipation from perception: acute pain activates default mode network. Hum Brain Mapp. 2013;34(9):2228–2243. | ||
Rocca MA, Messina R, Colombo B, Falini A, Comi G, Filippi M. Structural brain MRI abnormalities in pediatric patients with migraine. J Neurol. 2014;261(2):350–357. | ||
Luchtmann M, Steinecke Y, Baecke S, et al. Structural brain alterations in patients with lumbar disc herniation: a preliminary study. PLoS One. 2014;9(3):e90816. | ||
Veldhuijzen DS, Nemenov MI, Keaser M, Zhuo J, Gullapalli RP, Greenspan JD. Differential brain activation associated with laser-evoked burning and pricking pain: an event-related fMRI study. Pain. 2009;141(1–2):104–113. | ||
Chen B, Fan GG, Liu H, Wang S. Changes in anatomical and functional connectivity of Parkinson’s disease patients according to cognitive status. Eur J Radiol. 2015;84(7):1318–1324. | ||
Xue T, Yuan K, Cheng P, Zhao L, Zhao L, Yu D, Dong T, von Deneen KM, Gong Q, Qin W, Tian J. Alterations of regional spontaneous neuronal activity and corresponding brain circuit changes during resting state in migraine without aura. NMR Biomed. 2013;26(9):1051–1058. | ||
Wang Y, Xu C, Zhai L, Lu X, Wu X, Yi Y, Liu Z, Guan Q, Zhang X. Spatial-temporal signature of resting-state BOLD signals in classic trigeminal neuralgia. J Pain Res. 2017;10:2741–2750. | ||
Pan ZM, Li HJ, Bao J, et al. Altered intrinsic brain activities in patients with acute eye pain using amplitude of low-frequency fluctuation: a resting-state fMRI study. Neuropsychiatr Dis Treat. 2018;14:251–257. | ||
Ma X, Li S, Tian J, Jiang G, Wen H, Wang T, Fang J, Zhan W, Xu Y. Altered brain spontaneous activity and connectivity network in irritable bowel syndrome patients: A resting-state fMRI study. Clin Neurophysiol. 2015;126(6):1190–1197. | ||
Liu P, Liu Y, Wang G, Yang X, Jin L, Sun J, Qin W. Aberrant default mode network in patients with primary dysmenorrhea: a fMRI study. Brain Imaging Behav. 2017;11(5):1479–1485. | ||
Cao Y, Welch KM, Aurora S, Vikingstad EM. Functional MRI-BOLD of visually triggered headache in patients with migraine. Arch Neurol. 1999;56(5):548–554. | ||
Cutrer FM, Sorensen AG, Weisskoff RM, et al. Perfusion-weighted imaging defects during spontaneous migrainous aura. Ann Neurol. 1998;43(1):25–31. | ||
Cauda F, Sacco K, Duca S, et al. Altered resting state in diabetic neuropathic pain. PLoS One. 2009;4(2):e4542. | ||
Brügger M, Lutz K, Brönnimann B, et al. Tracing toothache intensity in the brain. J Dent Res. 2012;91(2):156–160. | ||
Turner DF, Marfurt CF. Uptake and transneuronal transport of horseradish peroxidase-wheat germ agglutinin by tooth pulp primary afferent neurons. Brain Res. 1988;452(1–2):381–387. |
 © 2019 The Author(s). This work is published and licensed by Dove Medical Press Limited. The
full terms of this license are available at https://www.dovepress.com/terms
and incorporate the Creative Commons Attribution
- Non Commercial (unported, 3.0) License.
By accessing the work you hereby accept the Terms. Non-commercial uses of the work are permitted
without any further permission from Dove Medical Press Limited, provided the work is properly
attributed. For permission for commercial use of this work, please see paragraphs 4.2 and 5 of our Terms.
© 2019 The Author(s). This work is published and licensed by Dove Medical Press Limited. The
full terms of this license are available at https://www.dovepress.com/terms
and incorporate the Creative Commons Attribution
- Non Commercial (unported, 3.0) License.
By accessing the work you hereby accept the Terms. Non-commercial uses of the work are permitted
without any further permission from Dove Medical Press Limited, provided the work is properly
attributed. For permission for commercial use of this work, please see paragraphs 4.2 and 5 of our Terms.