Back to Journals » Diabetes, Metabolic Syndrome and Obesity » Volume 14
Altered Functional Connectivity Strength of Primary Visual Cortex in Subjects with Diabetic Retinopathy
Authors Qi CX, Huang X, Tong Y, Shen Y ![]()
Received 3 April 2021
Accepted for publication 18 June 2021
Published 13 July 2021 Volume 2021:14 Pages 3209—3219
DOI https://doi.org/10.2147/DMSO.S311009
Checked for plagiarism Yes
Review by Single anonymous peer review
Peer reviewer comments 2
Editor who approved publication: Professor Ming-Hui Zou
Chen-xing Qi,1,* Xin Huang,2,* Yan Tong,1 Yin Shen1,3
1Eye Center, Renmin Hospital of Wuhan University, Wuhan, 430060, Hubei, People’s Republic of China; 2Department of Ophthalmology, Jiangxi Provincial People’s Hospital, Nanchang 330006, People’s Republic of China; 3Medical Research Institute, Wuhan University, Wuhan, 430071, Hubei, People’s Republic of China
*These authors contributed equally to this work
Correspondence: Yin Shen
Eye Center, Renmin Hospital of Wuhan University, No. 238, Jie Fang Road, Wu Chang District, Wuhan, 430060, Hubei, People’s Republic of China
Tel +86 13871550513
Email [email protected]
Objective: The purpose of the study was to find the differences in intrinsic functional connectivity (FC) patterns of the primary visual area (V1) among diabetic retinopathy (DR), diabetes mellitus (DM), and healthy controls (HCs) applying resting-state functional magnetic resonance imaging (rs-fMRI).
Patients and Methods: Thirty-five subjects with DR (18 males and 17 females), 22 DM (10 males and 12 females) and 38 HCs (16 males and 22 females) matched for sex, age, and education underwent rs-fMRI scanning. Seed-based FC analysis was performed to find the alterations in the intrinsic FC patterns of V1 in DR compared with DM and HCs.
Results: The study found that DR patients had a significant lower FC between the bilateral calcarine (CAL)/left lingual gyrus (LING) (BA 17/18) and the left V1, and between the bilateral CAL/left LING (BA 17/18) and the right V1 compared with the HCs. Meanwhile, patients with DR exhibited higher FC strength between the left V1 and the bilateral Caudate/Olfactory/Orbital superior frontal gyrus (OSFG), and between the bilateral Caudate/Olfactory/OSFG (BA 3/4/6) and the right V1. Compared with DM group, patients with DR showed increased FC strength between the right CAL (BA 17/18) and the right V1. DM group exhibited lower FC strength between the left fusiform and the left V1, and between the bilateral CAL and the right V1 when compared with HCs. Moreover, DM group was observed to have higher FC strength between the left superior frontal gyrus and the left V1.
Conclusion: Our findings indicated that DR patients exhibited FC disruptions between V1 and higher visual regions at rest, which may reflect the aberrant information communication in the V1 area of DR individuals. The findings offer important insights into the neuromechanism of vision disorder in DR patients.
Keywords: intrinsic functional connectivity, diabetic retinopathy, primary visual area
Introduction
Diabetic retinopathy (DR), known as the main cause of adult acquired blindness, is the most common retinal microvascular complication of diabetes mellitus (DM). DR is a progressive disease and can be categorized as an early stage (i.e., nonproliferative DR) and a more advanced stage (i.e., proliferative DR). Multiple risk factors are associated with the progression of DR, such as DM duration, chronic hyperglycemia, hypertension, and dyslipidemia.1,2 With prolonged progression of DM, approximately 50% of affected patients develop DR within 10 years after diagnosis of DM, and this proportion can reach 90% after 25 years.3
Intra-retinal microvascular abnormalities are part of the cause of visual impairment in patients with DR. There is increasing evidence that the vision loss in DR patients is also associated with pathological changes in various parts of the visual pathway, particularly the primary visual area (V1).4,5 V1 (anatomically located in Brodmann’s area 17 [BA 17]), includes the calcarine sulcus of the occipital cortex; this region carries information from the ipsilateral lateral geniculate nucleus to the ventral and dorsal streams.6 A voxel-based morphometry analysis has shown that the gray matter density in the occipital lobe (including V1) was decreased in DR patients.7 Patients with DR caused by type 1 DM (T1DM) showed lower local clustering in the occipital lobe compared with T1DM without retinopathy.8 Moreover, a diffusion-weighted magnetic resonance imaging (MRI) study revealed significantly greater apparent diffusion coefficient values of the visual center, supporting an association between DR and visual functional impairment.9 Notably, DR patients also exhibit functional alterations in the V1. Wang et al. found that patients with DR showed significant alterations in spontaneous brain activity in the bilateral occipital lobe.10 Based on a brain network analysis, Dai and colleagues demonstrated brain functional networks of V1 and secondary visual cortices were altered; these alterations might represent the severity of vision loss in patients with DR.11 The above-mentioned neuroimaging studies confirmed that specific functional and morphological alterations occurred in the V1 in patients with DR. However, few studies focused on whether patients with DR have characteristic changes in functional connectivity (FC) patterns in the V1.
The human brain is a complex dynamic system, which displays signals on blood oxygenation level-dependent (BOLD) imaging during rest. Low-frequency fluctuations (0~0.01 Hz) in BOLD signals at rest reflect spontaneous neuronal activity, as demonstrated by resting state functional MRI (rs-fMRI) studies.6,12 FC algorithm based on rs-fMRI data is a method of the spatiotemporal correlations and synchrony of the BOLD signals among anatomically different regions. The patterns of FC at rest show significant alterations in many diseases, such as Alzheimer’s disease,13 schizophrenia,14 early blindness,15 and glaucoma.12 Patients with primary open angle glaucoma had altered FC within and beyond the visual cortex since the early disease stage, and the findings showed clinical relevance of brain changes by correlating FC values with classical ophthalmologic measures. Another similar study using the FC method found patients with late blindness showed an altered FC between V1 and higher visual areas, and somatosensory cortices during rest. These studies all prove that FC, based on fMRI data, is a useful method for evaluating information transfer between brain regions. To date, no studies have investigated whether patients with DR show FC changes in the V1. Therefore, when compared with HCs and DM patients without retinopathy, we hypothesized that patients with DR would show characteristic alterations in FC patterns in the V1.
Based on this hypothesis, the aim of this rs-fMRI study was to explore differences in the FC strength of V1 between DR patients and control groups. These findings may provide meaningful information to aid in understanding the neuropathologic mechanism in patients with DR.
Patients and Methods
Subjects
In total, 35 DR patients (18 males and 17 females; 53.37±7.56 years), 22 type 2 DM (T2DM, 10 males and 12 females; 55.23±7.73 years) and 38 healthy controls (HCs) (16 males and 22 females; 54.46±8.06 years) were recruited for the present research in the Renmin Hospital of Wuhan University. The study program was carried out in accordance with the Declaration of Helsinki and accepted by the ethical committee of the Renmin Hospital of Wuhan University (No:WDRY2019-K032). These subjects were informed of the research procedures and signed the informed consent agreement prior to the research.
All subjects had to meet these criteria: (1) able to meet the physical demands of the imaging procedure; (2) no cardiovascular diseases; and (3) no serious brain disease (diagnosed by routine brain MRI [including T1WI, and T2WI/FLAIR] assessed by two experienced radiologists).
DR individuals met the following criteria: (1) all patients with DR caused by T2DM according to criteria recommended by the American Diabetes Association;16 (2) proliferative DR with retinal detachment and vitreous hemorrhage were excluded; (3) no additional eye diseases; (4) no ocular surgical history; (5) nonproliferative DR patients without diabetic nephropathy.
All HCs and patients with T2DM in this research had to meet these criteria: (1) normal eye examination and no retinal lesions (visual acuity ≥ 1.0); (2) HCs had no type of DM with normal hemoglobin A1c and blood glucose level; (3) women who were breastfeeding or pregnant during the research were excluded; (4) right-handed.
MRI Methods
The MRI scanning, performed on the 3.0 Tesla MR system (Discovery MR750W system; GE Healthcare, Milwaukee, WI, USA), contained both routine brain MRI and BOLD sequence. The fMRI images were acquired by applying a gradient echo-planar imaging sequence, which was documented in detail in a previous fMRI study.6 The parameters of the above sequences are shown in Table 1.
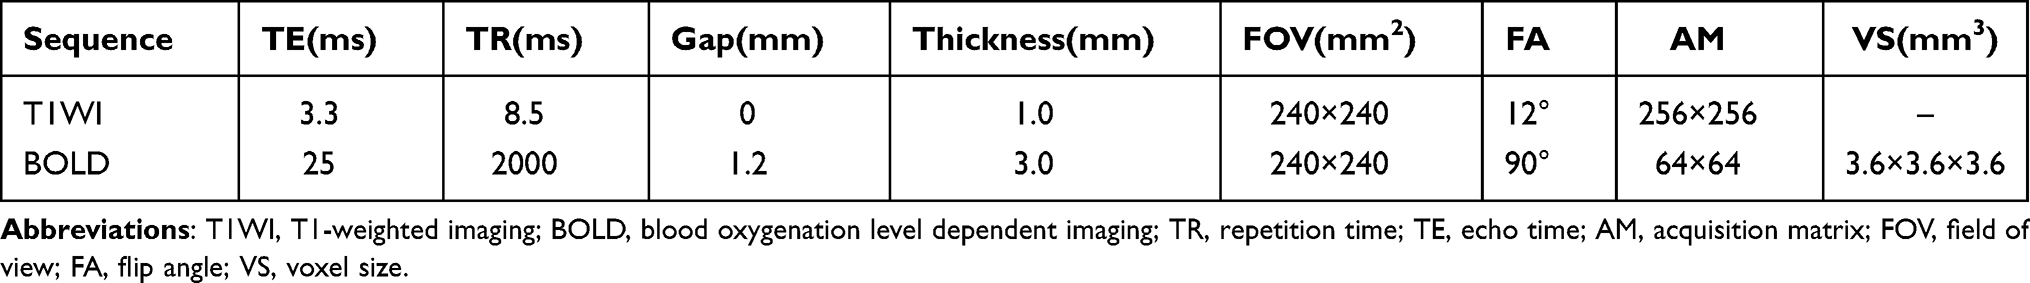 |
Table 1 Scanning Parameters of Structural T1-Weighted Images and BOLD Sequence |
Functional neuroimaging analysis software, Data Processing & Analysis of Brain Imaging (DPABI-Version 4.1, http://www.rfmri.org/dpabi), was applied to preprocess the fMRI images. After deleting the first ten images, the remaining 230 volumes for each participant need to be processed in the following steps, as referred to in a recent study:8 time calibration, corrected for head motion, spatial normalization and spatial smoothing.
The V1 area of brain (anatomically equivalent to BA 17) was selected as the region of interest (ROI) in the present study (Figure 1). We defined the center of V1 area as the seed point to calculate FC. The Montreal Neurological Institute coordinates of V1 area were (right V1: 7,-76, 10) and (left V1: −8,-76, 10). The radius of the ROI was set as 5 mm (shown as the red area in Figure 1). The Pearson correlation coefficient between the mean time course of ROI and all other regions’ time courses were calculated. In order to test the normality of the data, Fisher’s z transform analysis was carried out on the Pearson correlation coefficient to acquire an approximate normal distribution for the following statistical analysis.
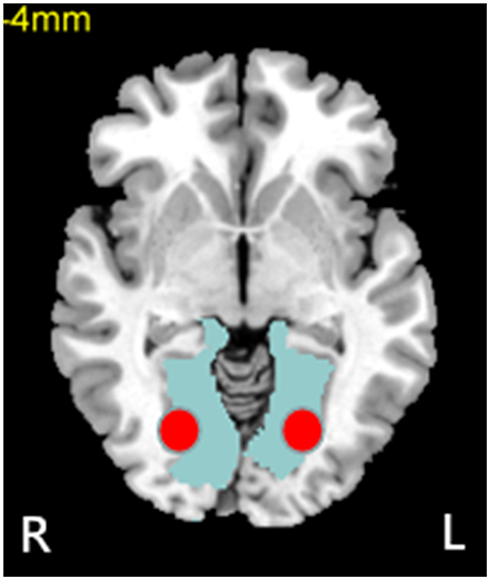 |
Figure 1 The center of V1 was chosen as the seed point to calculate FC (the red area). Abbreviations: FC, functional connectivity; L, left; R, right; V1, primary visual cortex. |
Ophthalmic Testing
All participants, assessed by two experienced ophthalmologists, received comprehensive eye examinations that included intraocular pressure measurement, best-corrected visual acuity (BCVA) test, slit lamp examination, and retinal examination by fundoscopy. The minimum criteria for the diagnosis of DR was the presence of at least one well-defined retinal microaneurysm in any field of the eye. All patients participating in the study had mild to severe non-proliferative DR and subjects in the DM group did not have retinopathy. Mild non-proliferative DR only shows microaneurysms, and moderate non-proliferative DR shows more than just microaneurysms but less than severe non-proliferative DR. Severe non-proliferative DR has any of the following signs: more than 20 intraretinal hemorrhages in each of 4 quadrants; definite venous beading in 2 quadrants; prominent intraretinal microvascular abnormalities in 1 quadrant and no signs of proliferative DR.
Statistical Analysis
Variables of clinical features of the three groups were analyzed by SPSS version 20.0 software (SPSS Inc, Chicago, Illinois, USA) using Chi-square test and independent-samples t-test. A p value less than 0.05 was considered statistically significant. The sample size was calculated by G-power version 3.1.9.2.
One-sample t-test was used to evaluate intragroup patterns of z-values functional connectivity (zFC) maps by applying SPM8 software (voxel-level: p<0.01). One-way ANOVA was performed to assess the significant zFC maps of V1 differences among three groups. Two-sample two-tailed t-test was conducted to investigate the group differences of the zFC maps and the pairs of zFC maps between V1 and vision-related regions applying the Gaussian random field (GRF) method, which was performed to correct for multiple comparisons and regressed covariates of sex and age applying the SPM 8 software (voxel-level: p<0.01, GRF correction, cluster-level: p<0.05).
Pearson correlation coefficient was conducted to evaluate the relationships between the zFC values of different brain regions and clinical features in DR applying SPSS version 20.0 software.
Results
Demographic and Clinical Characteristics
The demographic and clinical characteristics of DR group (18 males and 17 females, mean age: 53.37±7.56 years), T2DM group (10 males and 12 females; mean age: 55.23±7.73 years) and HC group (16 males and 22 females, mean age: 54.46±8.06 years) are summarized in Table 2. No statistically significant differences were found between the DR and other groups in education, intraocular pressure or age, but significant differences were found in BCVA of the left eye and right eye.
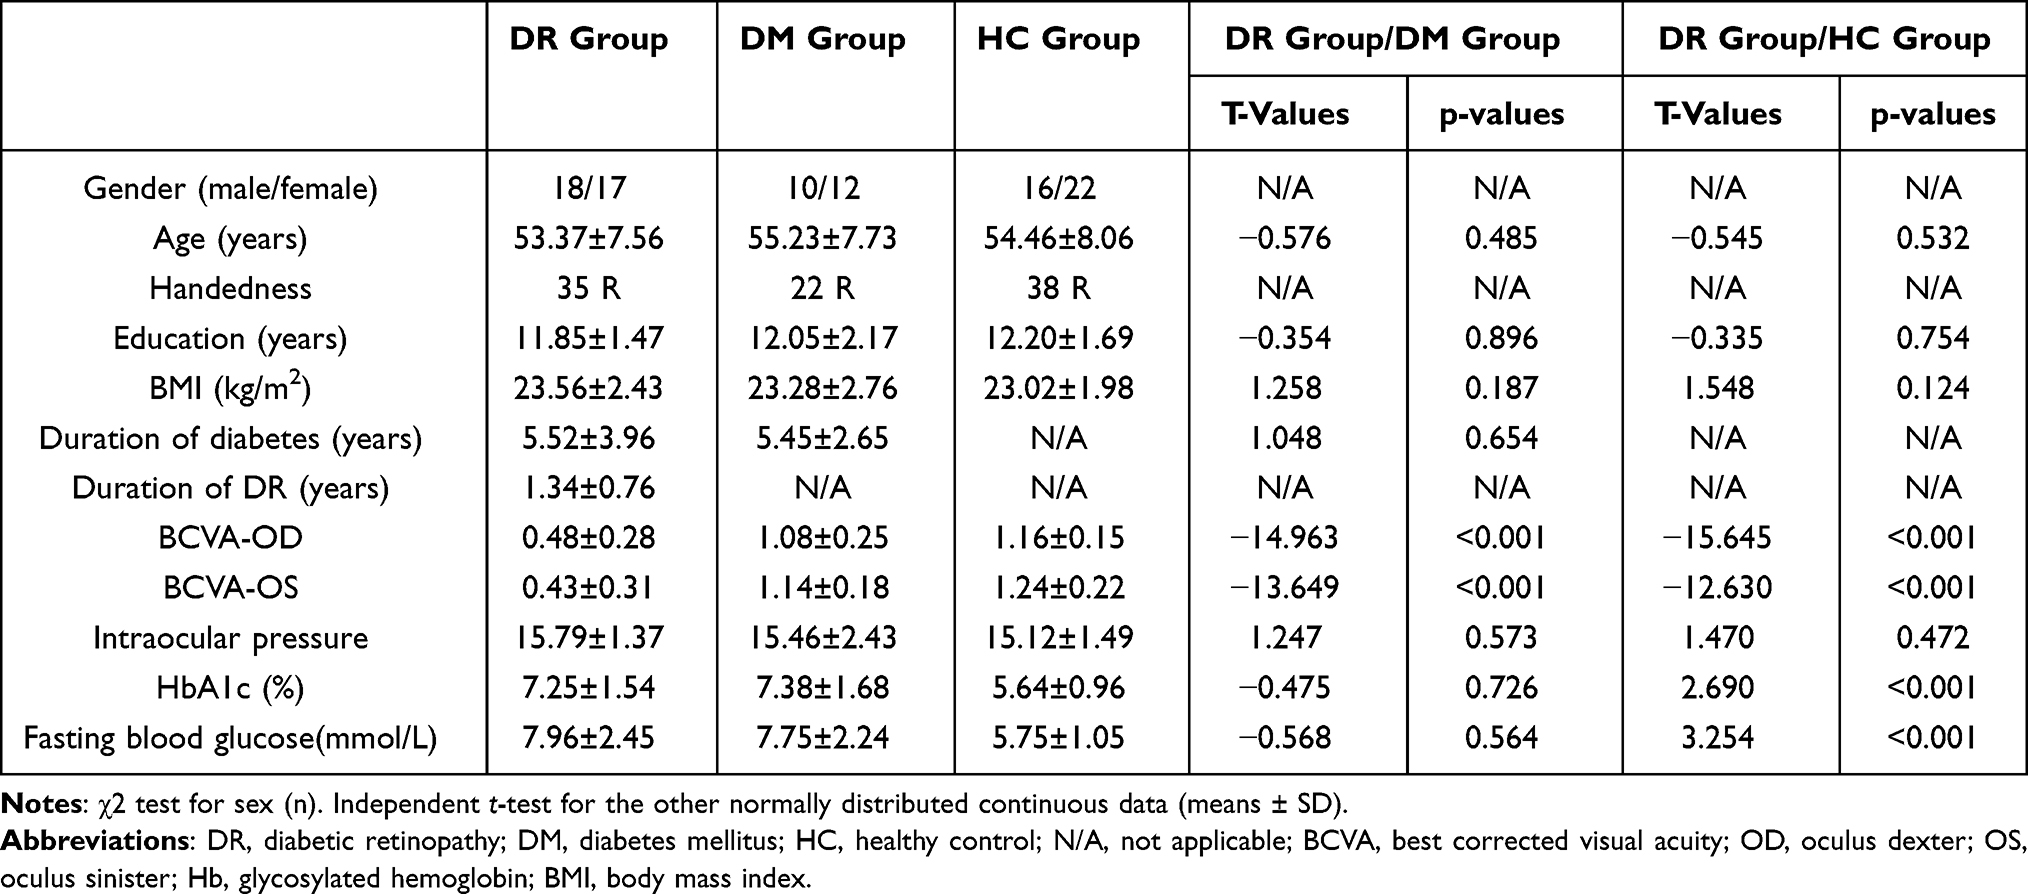 |
Table 2 Demographics and Visual Measurements Among Three Groups |
Imaging of the Retinal Fundus
Figure 2 is a typical fundus photography of a right eye and a left eye, presenting the following signs of DR: retinal punctate hemorrhage, microaneurysms formation, and hard exudation. The minimum criteria for the diagnosis of DR was the presence of at least one well-defined retinal microaneurysm in any field of the eye. All patients enrolled in the study were non-proliferative DR, assessed by two experienced ophthalmologists.
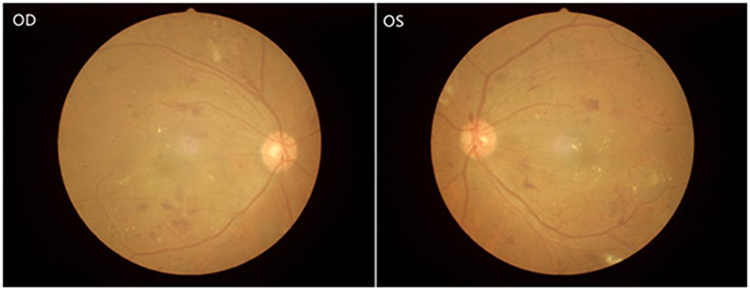 |
Figure 2 The fundus photos with the typical presentations of DR. Abbreviations: DR, diabetic retinopathy; OD, oculus dexter; OS, oculus sinister. |
FC Differences
Distribution mean zFC patterns of right V1 and left V1 in group-level of DR, DM and HC participants in the frequency band (0.01~0.08 Hz) are shown in Figure 3A and B. Intra-group patterns of zFC maps of left V1 and right V1 among the three groups are shown in Figures 4 and 5. The study found DR patients had a significantly lower FC between the bilateral calcarine (CAL)/left lingual gyrus (LING) (BA 17/18) and the left V1, and between the bilateral CAL/left LING (BA 17/18) and the right V1 compared with the HCs. Meanwhile, patients with DR exhibited higher FC strength between the left V1 and the bilateral Caudate/Olfactory/Orbital superior frontal gyrus (OSFG), and between the bilateral Caudate/Olfactory/OSFG (BA 3/4/6) and the right V1. Compared with DM group, patients with DR showed increased FC strength between the right CAL (BA 17/18) and the right V1. DM group exhibited lower FC strength between the left fusiform and the left V1, and between the bilateral CAL and the right V1 compared with HCs. Moreover, DM group was observed to have higher FC strength between the left superior frontal gyrus and the left V1 (voxel-level: p<0.01, GRF correction, cluster-level: p<0.05) (Tables 3 and 4).
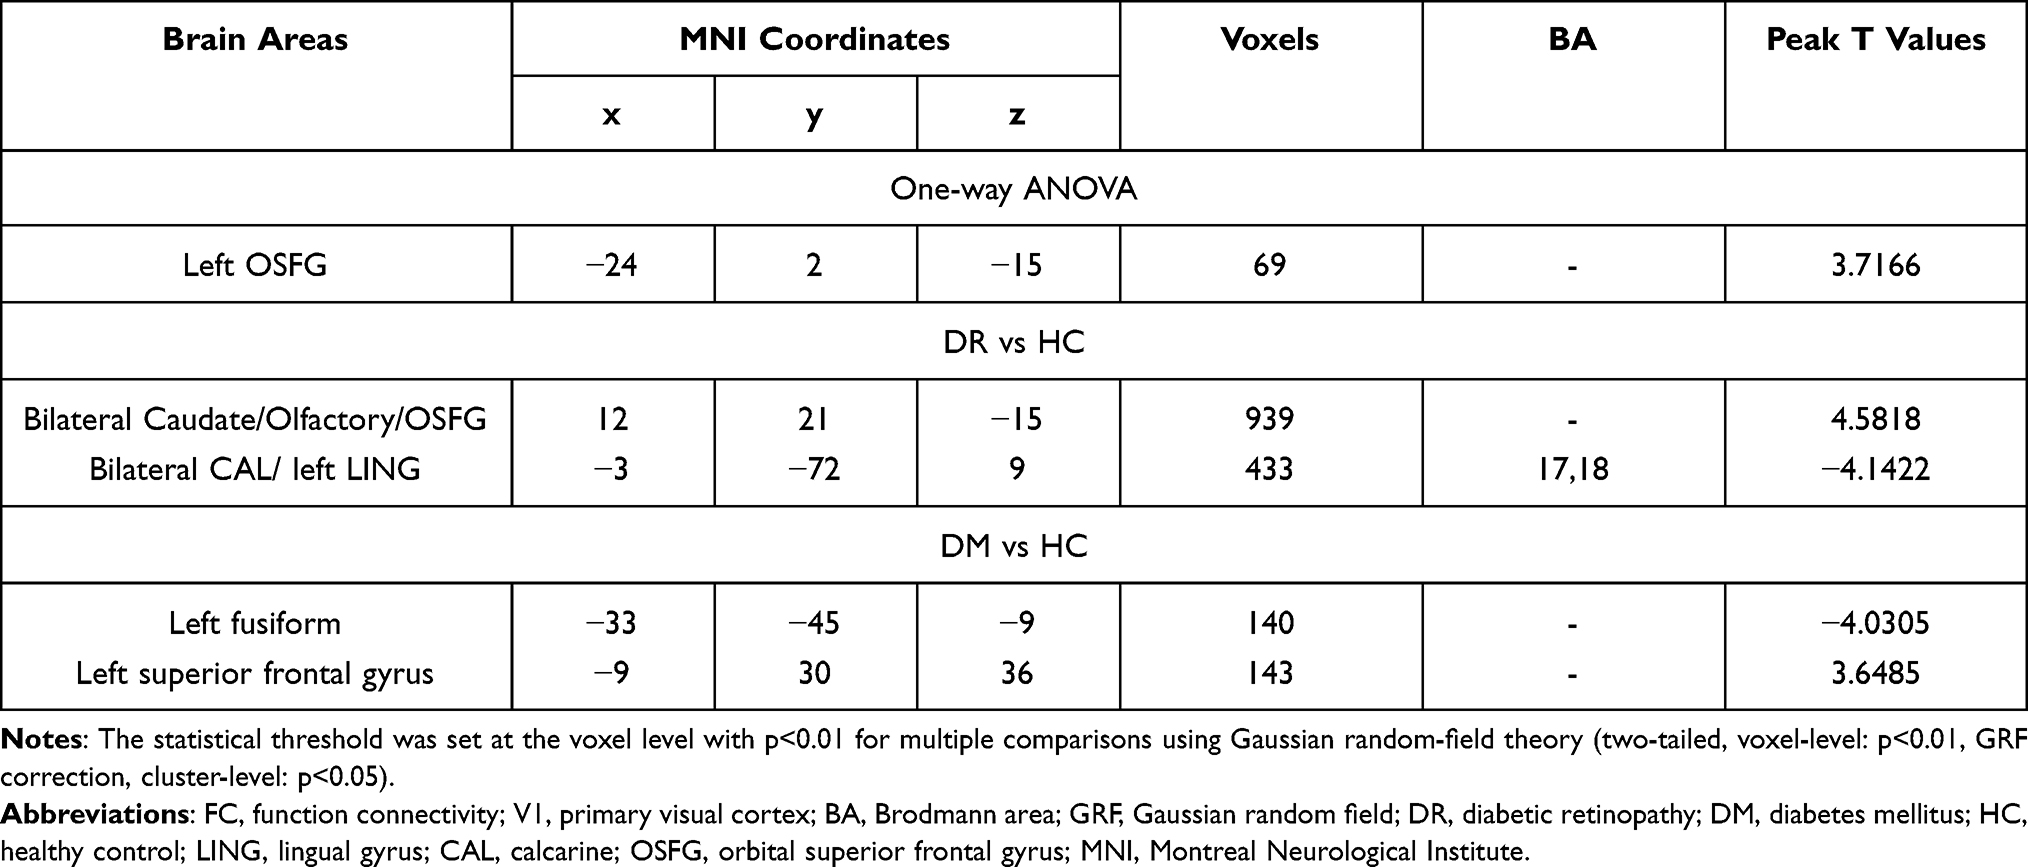 |
Table 3 Significant Differences in the FC of Left V1 Among Three Groups |
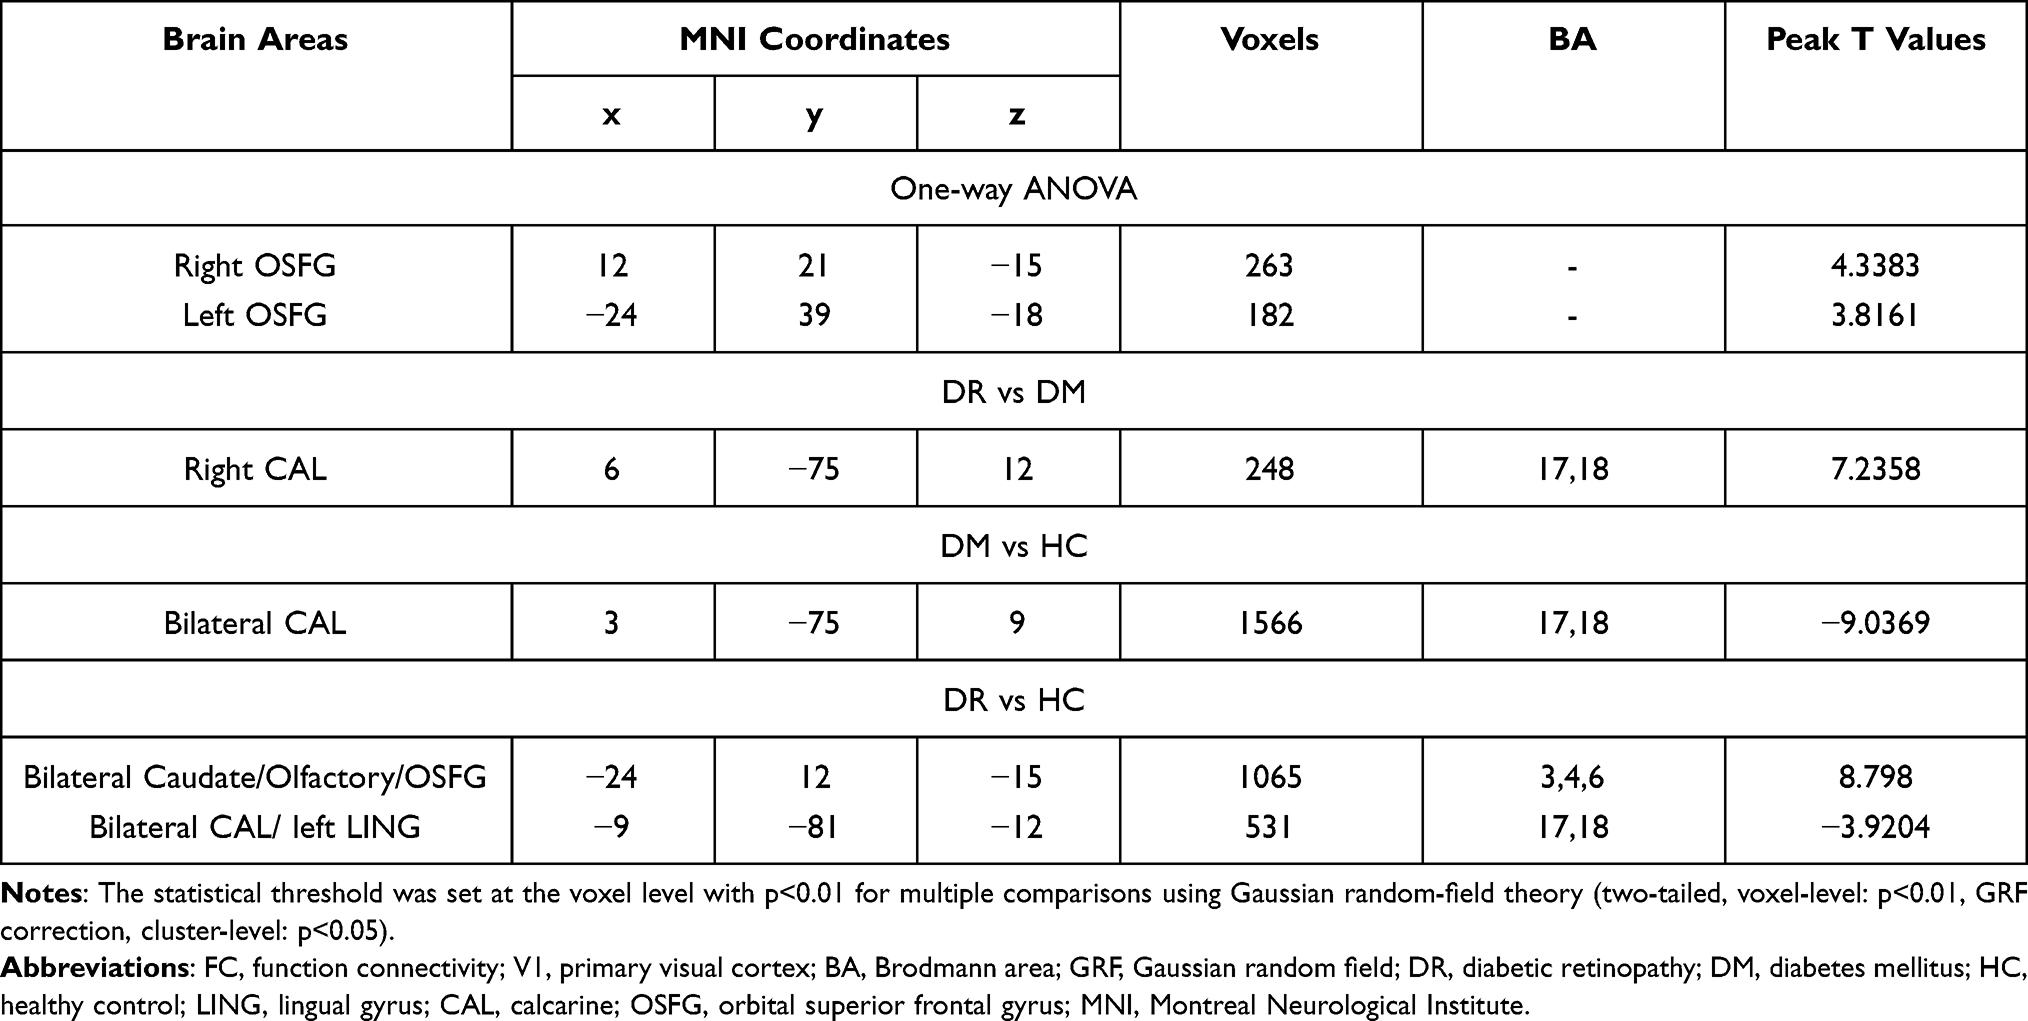 |
Table 4 Significant Differences in the FC of Right V1 Among Three Groups |
 |
Figure 3 Distribution group mean zFC among DR, DM and HC group. Abbreviations: FC, functional connectivity; DR, diabetic retinopathy; DM, diabetes mellitus; HC, healthy control; L, left; R, right; V1, primary visual cortex. Notes: (A) Distribution mean zFC pattern of left V1 in group-level of DR, DM and HC group in the typical frequency band (0.01–0.08 Hz). (B) Distribution mean zFC pattern of right V1 in group-level of DR, DM and HC group in the typical frequency band (0.01–0.08 Hz) (p<0.01). |
 |
Figure 4 Significant zFC maps of left V1 differences among three groups. Abbreviations: ROI, region of interest; V1, primary visual cortex; DR, diabetic retinopathy; DM, diabetes mellitus; HC, healthy control; FC, functional connectivity; L, left; R, right; GRF, Gaussian random field. Notes: ROI in the left V1. (A) Significant zFC maps of left V1 differences among three groups using one-way ANOVA. (B) Significant zFC maps of left V1 differences between DR and HC groups; (C) Significant zFC maps of left V1 differences between DM and HC groups; (D) Significant zFC maps of left V1 differences between DR and DM groups (voxel-level: p<0.01, GRF correction, cluster-level: p<0.05). |
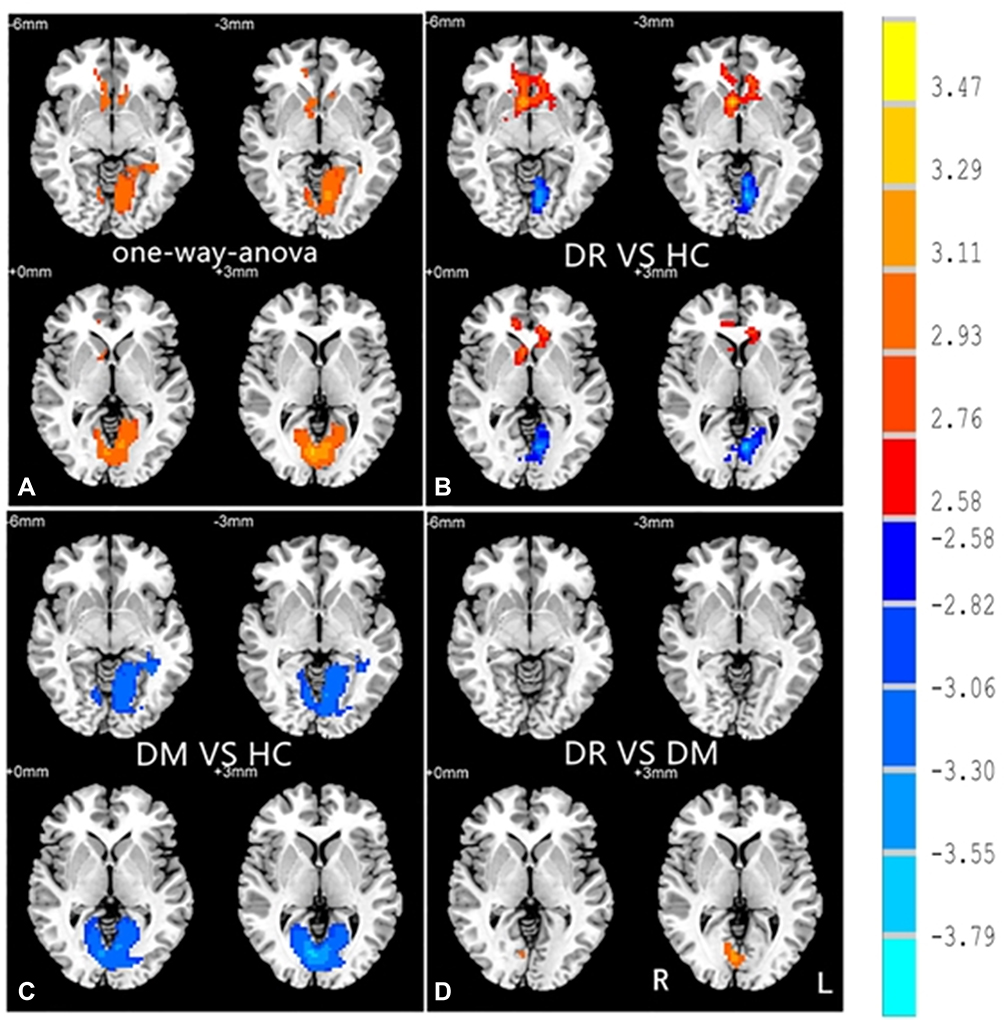 |
Figure 5 Significant zFC maps of right V1 differences among three groups. Abbreviations: ROI, region of interest; V1, primary visual cortex; DR, diabetic retinopathy; DM, diabetes mellitus; HC, healthy control; FC, functional connectivity; L, left; R, right; GRF, Gaussian random field. Notes: ROI in the right V1. (A) Significant zFC maps of right V1 differences among three groups using one-way ANOVA. (B) Significant zFC maps of right V1 differences between DR and HC groups; (C) Significant zFC maps of right V1 differences between DM and HC groups; (D) Significant zFC maps of right V1 differences between DR and DM groups (voxel-level: p<0.01, GRF correction, cluster-level: p<0.05). |
Correlation Analysis
We did not found obvious correlation between the mean FC values in different brain areas and the clinical characteristics in the DR patients (p>0.05).
Discussion
The FC method, based on rs-fMRI data, provides a novel tool to assess correlation coefficients of BOLD signal time courses among brain regions. To the best of our knowledge, this is the first study to investigate differences in the intrinsic FC patterns of V1 between patients with DR and HCs. We found that DR patients had a significant lower FC between the bilateral calcarine (CAL)/left lingual gyrus (LING) (BA 17/18) and the left V1, and between the bilateral CAL/left LING (BA 17/18) and the right V1 compared with the HCs. Meanwhile, patients with DR exhibited higher FC strength between the left V1 and the bilateral Caudate/Olfactory/Orbital superior frontal gyrus (OSFG), and between the bilateral Caudate/Olfactory/OSFG (BA 3/4/6) and the right V1. Compared with DM group, patients with DR showed increased FC strength between the right CAL (BA 17/18) and the right V1. DM group exhibited lower FC strength between the left fusiform and the left V1, and between the bilateral CAL and the right V1 compared with HCs. Moreover, DM group was observed to have higher FC strength between the left superior frontal gyrus and the left V1. These results may provide some useful information for understanding the neural mechanisms in DR.
The occipital lobe contains most of the anatomical areas of the visual cortex, including the three Brodmann areas (17, 18, and 19) related to vision.17 The CAL is the most reliable anatomic landmark of the medial part of the occipital lobe, which contains the V1 and visual area 2 (V2).18 Lesions of the CAL are reportedly associated with visual field defects and the perception of phosphenes.19 The LING (BA18), located in V2, receives strong feedforward connections from V1. Additionally, the LING is a crucial component of the dorsal visual pathway for visual processing and spatial memory.20 Visual signals received from the retina are transmitted in a stepwise manner along occipito-temporal and occipital-parietal pathways (i.e., ventral and dorsal visual streams). Furthermore, the CAL and LING are both crucial brain regions for the visual pathway.15 Patients with T2DM have a high risk of visual impairment; they have shown reduced FC density in the left CAL and left LING, compared with the HC group.21 Wang and colleagues reported that patients with DR showed abnormal brain activity in the occipital gyrus and LING, relative to HCs; these findings might be related to long-term reductions in stimulation of the visual center.10 Neuroimaging studies have demonstrated that dysfunction of the visual cortex (e.g., V1, CAL, and LING) is present in many patients with advanced visual deprivation, such as retinitis pigmentosa,15 high myopia,22 open globe injury,23 and retinal vein occlusion.24 From the perspective of pathophysiology, the difference between DR and DM is retinal microangiopathy. In our study, we observed reduced FC in the visual cortex between DR and HCs. DM group also showed reduced FC in the bilateral CAL when compared with HC group. These might reflect defects in visual processing in patients with DR. Thus, we speculate that long-term reduction in visual input in patients with DR may result in altered FC in the visual cortex. However, compared with DM group without retinopathy, patients with DR were observed to have an increased FC in the right CAL, which might be an enhanced compensatory connectivity induced by long-term reduction in visual input in patients with DR.
The caudate nucleus is a C-shaped structure in the basal ganglia striatum. On account of the extensive afferent and efferent connections, as well as cortico-striato-thalamic loops, the caudate nucleus is responsible for both motor and cognition function.25 There is an increasing number of reports that functional and structural abnormalities in the caudate nucleus are present in patients with hyperkinetic and hypokinetic movement disorders (e.g., Parkinson’s and Huntington’s diseases).26,27 The coordination of motor and visual cortices plays an important role in visuomotor function.28 Additionally, a recent analysis revealed that patients with DR had abnormal intranetwork FCs in the bilateral thalamus and right caudate nucleus of the basal ganglia network, suggesting that DR patients may exhibit movement control dysfunction.29 Dai et al. found that characteristic path length was enhanced and degree distribution was reduced (indicating greater connectivity) in the caudate nucleus and most frontal gyri of patients with DR, which may relate to compensatory recruitment.11 Consistent with the prior findings, our results showed that the DR group had enhanced FC between the bilateral V1 and bilateral caudate nucleus, which may reflect enhanced visuomotor function in patients with DR. We presume that the reorganization of the V1 and motor areas might contribute to the enhanced compensatory connectivity between the caudate and V1.
The olfactory region is present in the foremost part of the frontal lobe. This region performs an important role in olfactory function; thus, it exhibits high levels of functional and biological plasticity.30 There is increasing evidence that the olfactory region is closely linked to several key physiological functions, such as visual memory performance and olfactory modulation of vision.31,32 Olfactory dysfunction is also an early biomarker for neurodegenerative diseases, including Alzheimer’s disease.33 van Rijzingen et al. found that ablation of the olfactory bulb could impair visuospatial learning in rats.34 Some studies have investigated the olfactory modulation of visual perception; the results suggest that olfactory inputs can modulate visual information.32,35 Gouveri et al. reported that, in T2DM patients, the presence of olfactory dysfunction and retinopathy was significantly associated with lower olfactory scores.36 Additionally, evidence from a neuroimaging study suggests that patients with DR exhibit enhanced connectivity between the visual cortex and olfactory region.37 Accordingly, our results showed that patients with DR had enhanced FC between the bilateral olfactory region and bilateral V1, which might compensate for visual impairment in patients with DR. Therefore, we presume that reduction in visual input may promote the olfactory region to perform more robust visual modulation by enhanced connectivity with the V1.
Finally, DR individuals showed significantly enhanced FC between the bilateral V1 and bilateral OSFGs, relative to FC in the HC group. The OSFG, located in the prefrontal lobe, receives neural signals from the dorsolateral medial thalamus, temporal gyrus, olfactory system, and amygdala.4 Notably, the OSFG is responsible for regulation and modulation of mood and vision.8 The alteration of apparent diffusion coefficient values investigated applying the diffusion-weighted imaging in the brains of patients with DR was similar in both the visual area and orbitofrontal cortex.38 A previous fMRI study revealed enhancement of FC between the left orbitofrontal gyrus and the temporal gyrus in T1DM patients, which suggested a compensatory or adaptive response to impaired functional areas in those patients.8 Moreover, dysfunction in the OSFG has been observed in patients with DR.11,39 In our study, enhanced FC between the bilateral V1 and OSFG indicated improved functional reorganization, which may relate to OSFG compensatory regulation or recruitment of visual resources from other regions.
The main limitation of this research was its relatively small sample size. Moreover, the study did not include assessments of retinal neurodegeneration and cognitive impairment in DR patients. We will expand the sample size and collect more complete clinical data in our future study.
Conclusion
In conclusion, our results indicated that patients with DR exhibited FC disruptions between V1 and higher visual regions at rest, which may reflect the aberrant information communication in the brain of DR individuals, and imply the presence of impaired vision in these patients. The findings may be helpful for understanding the neuromechanism of vision disorder in patients with DR. Based on our findings, systemic use of drugs to improve microcirculation and neurotrophic drugs might be beneficial to patients with DR.
Acknowledgments
The study was supported by the National Key R&D Program of China (Grant Number: 2017YFE0103400) and the National Nature Science Foundation of China (Grant Number: 81470628). Chen-Xing Qi and Xin Huang are co-first authors for this study.
Disclosure
The authors report no conflicts of interest in the work.
References
1. Harris Nwanyanwu K, Talwar N, Gardner T, et al. Predicting development of proliferative diabetic retinopathy. Diabetes Care. 2013;36(6):1562–1568. doi:10.2337/dc12-0790
2. Chew E, Davis M, Danis R, et al. The effects of medical management on the progression of diabetic retinopathy in persons with type 2 diabetes: the Action to Control Cardiovascular Risk in Diabetes (ACCORD) Eye Study. Ophthalmology. 2014;121(12):2443–2451. doi:10.1016/j.ophtha.2014.07.019
3. Calderon G, Juarez O, Hernandez G, et al. Oxidative stress and diabetic retinopathy: development and treatment. Eye (London, England). 2017;31(8):1122–1130. doi:10.1038/eye.2017.64
4. Li Y, Zhou H, Xu X, et al. Research Progress in MRI of the Visual Pathway in Diabetic Retinopathy. Current Med Sci. 2018;38(6):968–975. doi:10.1007/s11596-018-1971-5
5. Kancherla S, Kohler W, van der Merwe Y, et al. In Vivo Evaluation of the Visual Pathway in Streptozotocin-Induced Diabetes by Diffusion Tensor MRI and Contrast Enhanced MRI. PLoS One. 2016;11(10):e0165169. doi:10.1371/journal.pone.0165169
6. Ding K, Liu Y, Yan X, et al. Altered functional connectivity of the primary visual cortex in subjects with amblyopia. Neural Plast. 2013;2013:612086. doi:10.1155/2013/612086
7. Wessels A, Simsek S, Remijnse P, et al. Voxel-based morphometry demonstrates reduced grey matter density on brain MRI in patients with diabetic retinopathy. Diabetologia. 2006;49(10):2474–2480. doi:10.1007/s00125-006-0283-7
8. Liu K, Song J, Jin J, et al. Abnormal Functional Connectivity Density in New-Onset Type 1 Diabetes Mellitus Children: a Resting-State Functional Magnetic Resonance Imaging Study. Front Psychiatry. 2020;11:284. doi:10.3389/fpsyt.2020.00284
9. Wang Z, Lu Z, Li J, et al. Evaluation of apparent diffusion coefficient measurements of brain injury in type 2 diabetics with retinopathy by diffusion-weighted MRI at 3.0 T. Neuroreport. 2017;28(2):69–74. doi:10.1097/WNR.0000000000000703
10. Wang Z, Zou L, Lu Z, et al. Abnormal spontaneous brain activity in type 2 diabetic retinopathy revealed by amplitude of low-frequency fluctuations: a resting-state fMRI study. Clin Radiol. 2017;72(4):
11. Dai H, Zhang Y, Lai L, et al. Brain functional networks: correlation analysis with clinical indexes in patients with diabetic retinopathy. Neuroradiology. 2017;59(11):1121–1131. doi:10.1007/s00234-017-1900-5
12. Frezzotti P, Giorgio A, Toto F, et al. Early changes of brain connectivity in primary open angle glaucoma. Hum Brain Mapp. 2016;37(12):4581–4596. doi:10.1002/hbm.23330
13. Greicius M, Srivastava G, Reiss A, et al. Default-mode network activity distinguishes Alzheimer’s disease from healthy aging: evidence from functional MRI. Proc Natl Acad Sci U S A. 2004;101(13):4637–4642. doi:10.1073/pnas.0308627101
14. Liang M, Zhou Y, Jiang T, et al. Widespread functional disconnectivity in schizophrenia with resting-state functional magnetic resonance imaging. Neuroreport. 2006;17(2):209–213. doi:10.1097/01.wnr.0000198434.06518.b8
15. Wen Z, Zhou F, Huang X, et al. Altered functional connectivity of primary visual cortex in late blindness. Neuropsychiatr Dis Treat. 2018;14:3317–3327. doi:10.2147/NDT.S183751
16. Wilkinson C, Ferris F, Klein R, et al. Proposed international clinical diabetic retinopathy and diabetic macular edema disease severity scales. Ophthalmology. 2003;110(9):1677–1682. doi:10.1016/S0161-6420(03)00475-5
17. Flores L. Occipital lobe morphological anatomy: anatomical and surgical aspects. Arq Neuropsiquiatr. 2002;60:566–571. doi:10.1590/S0004-282X2002000400010
18. Huang X, Dan H, Zhou F, et al. Abnormal intrinsic functional network hubs and connectivity following peripheral visual loss because of inherited retinal degeneration. Neuroreport. 2019;30(4):295–304. doi:10.1097/WNR.0000000000001200
19. Baier B, de Haan B, Mueller N, et al. Anatomical correlate of positive spontaneous visual phenomena: a voxelwise lesion study. Neurology. 2010;74(3):218–222. doi:10.1212/WNL.0b013e3181cb3e64
20. Sulpizio V, Committeri G, Lambrey S, et al. Selective role of lingual/parahippocampal gyrus and retrosplenial complex in spatial memory across viewpoint changes relative to the environmental reference frame. Behav Brain Res. 2013;242:62–75. doi:10.1016/j.bbr.2012.12.031
21. Liu D, Chen L, Duan S, et al. Disrupted Balance of Long- and Short-Range Functional Connectivity Density in Type 2 Diabetes Mellitus: a Resting-State fMRI Study. Front Neurosci. 2018;12:875. doi:10.3389/fnins.2018.00875
22. Huang X, Hu Y, Zhou F, et al. Altered whole-brain gray matter volume in high myopia patients: a voxel-based morphometry study. Neuroreport. 2018;29(9):760–767. doi:10.1097/WNR.0000000000001028
23. Ye L, Wei R, Huang X, et al. Reduction in interhemispheric functional connectivity in the dorsal visual pathway in unilateral acute open globe injury patients: a resting-state fMRI study. Int J Ophthalmol. 2018;11(6):1056–1060. doi:10.18240/ijo.2018.06.26
24. Gao Q, Peng B, Huang X, et al. Assessment of cerebral low-frequency oscillations in patients with retinal vein occlusion: a preliminary functional MRI study. Acta Radiologica (Stockholm, Sweden: 1987). 2020;61(6):813–820. doi:10.1177/0284185119879683
25. Persson K, Bohbot V, Bogdanovic N, et al. Finding of increased caudate nucleus in patients with Alzheimer’s disease. Acta Neurol Scand. 2018;137(2):224–232. doi:10.1111/ane.12800
26. Çırak M, Yağmurlu K, Kearns K, et al. The Caudate Nucleus: its Connections, Surgical Implications, and Related Complications. World Neurosurg. 2020;139:e428–e438. doi:10.1016/j.wneu.2020.04.027
27. Szewczyk-Krolikowski K, Menke R, Rolinski M, et al. Functional connectivity in the basal ganglia network differentiates PD patients from controls. Neurology. 2014;83(3):208–214. doi:10.1212/WNL.0000000000000592
28. Kruse W, Dannenberg S, Kleiser R, et al. Temporal relation of population activity in visual areas MT/MST and in primary motor cortex during visually guided tracking movements. Cerebral Cortex (New York, N Y: 1991). 2002;12(5):466–476. doi:10.1093/cercor/12.5.466
29. Huang X, Tong Y, Qi C, et al. Large-Scale Neuronal Network Dysfunction in Diabetic Retinopathy. Neural Plast. 2020;2020:6872508. doi:10.1155/2020/6872508
30. Sharma A, Kumar R, Aier I, et al. Sense of Smell: structural, Functional, Mechanistic Advancements and Challenges in Human Olfactory Research. Curr Neuropharmacol. 2019;17(9):891–911.
31. Zelcer I, Cohen H, Richter-Levin G, et al. A cellular correlate of learning-induced metaplasticity in the hippocampus. Cerebral Cortex (New York, N Y: 1991). 2006;16(4):460–468. doi:10.1093/cercor/bhi125
32. Tamura K, Hamakawa M, Okamoto T. Olfactory modulation of colour working memory: how does citrus-like smell influence the memory of orange colour? PLoS One. 2018;13(9):e0203876. doi:10.1371/journal.pone.0203876
33. Hsieh J, Keller A, Wong M, et al. SMELL-S and SMELL-R: olfactory tests not influenced by odor-specific insensitivity or prior olfactory experience. Proc Natl Acad Sci U S A. 2017;114(43):11275–11284. doi:10.1073/pnas.1711415114
34. van Rijzingen I, Gispen W, Spruijt B. Olfactory bulbectomy temporarily impairs Morris maze performance: an ACTH(4-9) analog accellerates return of function. Physiol Behav. 1995;58(1):147–152. doi:10.1016/0031-9384(95)00032-E
35. Arao M, Suzuki M, Katayama J, et al. An odorant congruent with a colour cue is selectively perceived in an odour mixture. Perception. 2012;41(4):474–482. doi:10.1068/p7152
36. Gouveri E, Katotomichelakis M, Gouveris H, et al. Olfactory dysfunction in type 2 diabetes mellitus: an additional manifestation of microvascular disease? Angiology. 2014;65(10):869–876. doi:10.1177/0003319714520956
37. Huang X, Tong Y, Qi C, et al. Disrupted topological organization of human brain connectome in diabetic retinopathy patients. Neuropsychiatr Dis Treat. 2019;15:2487–2502. doi:10.2147/NDT.S214325
38. Dogan M, Ozsoy E, Doganay S, et al. Brain diffusion-weighted imaging in diabetic patients with retinopathy. Eur Rev Med Pharmacol Sci. 2012;16(1):126–131.
39. Liang M, Chen X, Xue F, et al. Diffusion-weighted imaging of injuries to the visual centers of the brain in patients with type 2 diabetes and retinopathy. Exp Ther Med. 2017;14(2):1153–1156. doi:10.3892/etm.2017.4582
 © 2021 The Author(s). This work is published and licensed by Dove Medical Press Limited. The
full terms of this license are available at https://www.dovepress.com/terms
and incorporate the Creative Commons Attribution
- Non Commercial (unported, 3.0) License.
By accessing the work you hereby accept the Terms. Non-commercial uses of the work are permitted
without any further permission from Dove Medical Press Limited, provided the work is properly
attributed. For permission for commercial use of this work, please see paragraphs 4.2 and 5 of our Terms.
© 2021 The Author(s). This work is published and licensed by Dove Medical Press Limited. The
full terms of this license are available at https://www.dovepress.com/terms
and incorporate the Creative Commons Attribution
- Non Commercial (unported, 3.0) License.
By accessing the work you hereby accept the Terms. Non-commercial uses of the work are permitted
without any further permission from Dove Medical Press Limited, provided the work is properly
attributed. For permission for commercial use of this work, please see paragraphs 4.2 and 5 of our Terms.