Back to Journals » Journal of Pain Research » Volume 13
Altered Brainstem Pain-Modulation Circuitry Connectivity During Spontaneous Pain Intensity Fluctuations
Authors Mills EP, Alshelh Z ![]() , Kosanovic D, Di Pietro F
, Kosanovic D, Di Pietro F ![]() , Vickers ER, Macey PM
, Vickers ER, Macey PM ![]() , Henderson LA
, Henderson LA
Received 5 March 2020
Accepted for publication 7 July 2020
Published 4 September 2020 Volume 2020:13 Pages 2223—2235
DOI https://doi.org/10.2147/JPR.S252594
Checked for plagiarism Yes
Review by Single anonymous peer review
Peer reviewer comments 3
Editor who approved publication: Dr Michael Schatman
Emily P Mills,1 Zeynab Alshelh,1 Danny Kosanovic,1 Flavia Di Pietro,1 E Russell Vickers,1 Paul M Macey,2 Luke A Henderson1
1Department of Anatomy and Histology, University of Sydney, Sydney, NSW 2006, Australia; 2School of Nursing and Brain Research Institute, David Geffen School of Medicine, University of California at Los Angeles, Los Angeles, CA, USA
Correspondence: Luke A Henderson
Department of Anatomy and Histology, F13, University of Sydney, Sydney, NSW, Australia
Tel +612 9351 7063
Fax +612 9351 6556
Email [email protected]
Background: Chronic pain, particularly that following nerve injury, can occur in the absence of external stimuli. Although the ongoing pain is sometimes continuous, in many individuals the intensity of their pain fluctuates. Experimental animal studies have shown that the brainstem contains circuits that modulate nociceptive information at the primary afferent synapse and these circuits are involved in maintaining ongoing continuous neuropathic pain. However, it remains unknown if these circuits are involved in regulating fluctuations of ongoing neuropathic pain in humans.
Methods: We used functional magnetic resonance imaging to determine whether in 19 subjects with painful trigeminal neuropathy, brainstem pain-modulation circuitry function changes according to moment-to-moment fluctuations in spontaneous pain intensity as rated online over a 12-minute period.
Results: We found that when pain intensity was spontaneously high, connectivity strengths between regions of the brainstem endogenous pain-modulating circuitry—the midbrain periaqueductal gray, rostral ventromedial medulla (RVM), and the spinal trigeminal nucleus (SpV)—were high, and vice-versa (when pain was low, connectivity was low). Additionally, sliding-window connectivity analysis using 50-second windows revealed a significant positive relationship between ongoing pain intensity and RVM-SpV connectivity over the duration of the 12-minute scan.
Conclusion: These data reveal that moment-to-moment changes in brainstem pain-modulation circuitry functioning likely contribute to fluctuations in spontaneous pain intensity in individuals with chronic neuropathic pain.
Keywords: midbrain periaqueductal gray matter, rostral ventromedial medulla, spinal trigeminal nucleus, dynamic connectivity, functional connectivity, spontaneous pain
Significance Statement
Preclinical studies have shown that brainstem circuits can modulate incoming nociceptive information. It remains unknown if these circuits regulate ongoing pain intensity fluctuations in humans with chronic neuropathic pain. Using functional magnetic resonance imaging, we found that changes in brainstem pain-modulation circuitry are associated with fluctuations in spontaneous pain intensity in individuals with chronic neuropathic pain. Modulation of these circuits may provide a way to reduce ongoing chronic pain.
Introduction
Whilst pain often resolves as the initial injury heals, in some individuals, it can persist and develop into a chronic pain condition.1 Chronic pain, particularly that following nerve injury, i.e. neuropathic pain, can occur in the absence of external stimuli and although the pain can be continuous, in many individuals the intensity of their pain fluctuates throughout the day and from moment-to-moment.2,3 Whilst the underlying mechanisms responsible for pain intensity fluctuations in individuals with neuropathic pain are unclear, there is evidence in non-neuropathic chronic back pain that central neural processes contribute to spontaneous fluctuations in chronic pain intensity.4,5
Preclinical studies have shown that the brainstem contains multiple circuits that can modulate nociceptive information at the primary afferent synapse. For example, the midbrain periaqueductal gray (PAG) can either inhibit or facilitate activity at the dorsal horn and spinal trigeminal nucleus (SpV) via a relay in the rostral ventromedial medulla (RVM).6–8 Furthermore, it is likely that these circuits are involved in maintaining ongoing chronic neuropathic pain, as experimental animal studies suggest that there is a pro-nociceptive shift in the function of this system that is important for the initiation and/or maintenance of spontaneous and evoked pain following nerve injury.9–13 Consistent with this preclinical evidence, we recently revealed that individuals with painful trigeminal neuropathy display stronger resting functional magnetic resonance imaging (fMRI) signal coupling between the RVM and other brainstem areas involved in pain modulation compared with pain-free controls.14 In addition to maintaining spontaneous pain, it is possible that moment-to-moment alterations in these brainstem circuits alter nociceptive processing at the primary afferent synapse, resulting in variations in spontaneous pain intensity. Determining the nature of these connections and whether they underlie spontaneous changes in ongoing pain intensity will provide additional evidence for a role of the brainstem modulation system in maintaining and modulating the intensity of spontaneous pain in individuals with chronic neuropathic pain.
The aim of this investigation was to use fMRI to determine whether in subjects with painful trigeminal neuropathy, the function of brainstem pain-modulation circuits changes according to fluctuations in spontaneous pain intensity. More specifically, in subjects who report fluctuating pain, we aimed to determine the strength of RVM signal coupling (functional connectivity) with other brainstem regions during periods of low versus high pain. Additionally, we aimed to determine whether RVM dynamic functional connectivity tracks changes in spontaneous pain intensity over the course of the fMRI scan. We hypothesize that patients will show stronger RVM functional connectivity with other pain-modulation regions, including the PAG and SpV, during the period of highest pain and that dynamic RVM connectivity with pain-modulation areas will positively correlate with spontaneous changes in pain intensity.
Materials and Methods
Subjects and Pain Measures
Nineteen subjects with painful trigeminal neuropathy (PTN; 6 males, mean [±SEM] age: 47±3 years; range 28–78 years) were recruited for the study. PTN subjects were recruited and diagnosed in accordance with the Liverpool criteria15 by a clinician (E.R.V) in the research group. Inclusion criteria included a primary pain complaint of PTN and pain intensity on the day of scanning >0. Informed written consent was obtained for all procedures, which were conducted under the approval by the University of Sydney Human Research Ethics Committee and consistent with the Declaration of Helsinki. Other data from the subjects recruited for this investigation have been used in a previous study (Alshelh et al, 2019).16
The PTN subjects recorded the intensity of their ongoing pain using a visual analogue scale (VAS) (0=no pain to 10=worst pain imaginable) three times per day for seven consecutive days during the week of the scanning session. The average of these pain ratings was taken as a measure of “diary pain intensity”. Subjects also described their pain distribution by outlining the area of their chronic pain on a standard drawing of the face and described the quality of their ongoing pain by completing a McGill Pain Questionnaire.
MRI Scans
Each subject was positioned supine onto the MRI scanner bed and placed into a 3 Tesla MRI scanner (Achieva, Philips Medical Systems, The Netherlands), with their head in a 32-channel head coil to which padding was added to prevent head movement. With the subject relaxed, a high-resolution T1-weighted anatomical image of the entire brain was collected (288 axial slices, repetition time = 5600ms, raw voxel size = 0.87×0.87×0.87mm thick). Following this, a series of 360 gradient-echo echo-planar brain volumes with blood oxygen level dependent (BOLD) contrast (37 axial slices, repetition time=2000ms, echo time=30ms, raw voxel size=3.0x3.0x4.0mm thick) was collected. During this scan, each subject rated the intensity of their ongoing pain using a Computerized Visual Analogue Scale device (CoVAS, Medoc, Israel). The CoVAS is a 10cm subject-controlled horizontal slider which allows pain intensity to be continuously recorded throughout the experiment. Throughout the entire fMRI scan, the participants used the CoVAS to record their pain intensity (0 = no pain, 10 = worst imaginable pain).
MRI and Statistical Analysis
Image Preprocessing
Using SPM1217 and custom software, fMRI images were realigned and movement parameters examined to ensure no subject displayed >1mm volume-to-volume movement in the X, Y and Z planes and 0.05 radians in the pitch, roll and yaw directions. Movement parameters were modelled and removed from the fMRI signal by removing any signal correlated with the movement parameters, similar to the LMGS detrending method.18 Cardiac (frequency band of 60–120 beats per minute +1 harmonic) and respiratory (frequency band of 8–25 breaths per minute +1 harmonic) noise was modelled and removed using the Dynamic Retrospective Filtering (DRIFTER) toolbox.19 The fMRI images were then linear detrended to remove global signal intensity changes and co-registered to each subject’s T1-weighted anatomical image. The T1-weighted image was spatially normalized to the Montreal Neurological Institute (MNI) template and the normalization parameters applied to the fMRI images. This process resulted in the fMRI images being resliced into 2x2x2mm voxels.
To improve brainstem normalization accuracy, the brainstems of the fMRI image sets were isolated using the SUIT toolbox in native space.20 Binary masks of the brainstem were created and used to spatially normalize each image set to the SUIT brainstem template in MNI space. The resulting normalized fMRI images remained unsmoothed in order to maintain spatial accuracy of small brainstem structures. Finally, for the functional connectivity analyses, we applied a temporal high-pass filter with a cut-off frequency of 0.02 Hz to the unsmoothed fMRI images to remove the low-frequency signals that cannot be resolved using 50-second windows.21
Pain Ratings
Inspection of the pain intensity rating traces over the fMRI scan revealed a group of subjects in which pain fluctuated greatly and a group where pain was stable. In 7 subjects, pain remained stable, with these subjects reporting an average difference between minimum and maximum pain of 0.30 out of 10 on the VAS (stable group). In the remaining 12 subjects, pain varied considerably, with these subjects reporting an average difference between minimum and maximum pain of 2.6 on the VAS over the 12-minute recording period (fluctuating group). For the fMRI analysis, in order to match pain intensity changes with changes in BOLD signal intensity and coupling, ongoing pain intensity ratings for each subject were shifted by 6 seconds (3 brain volumes). This accounted for the approximate haemodynamic delay since fMRI measures the demand for oxygen that follows 5–6 seconds after the neuronal response.
RVM Functional Connectivity
To study the function of the brainstem pain-modulation system, we performed functional connectivity analyses using a “seed” region in the rostral ventromedial medulla (RVM). The RVM is in the center of several pain-modulation circuits (Figure 1A) and a previous investigation has shown that PTN patients display altered RVM functional connectivity with other pain-modulation regions compared to healthy control subjects.14 In the current study, the RVM seed comprised six contiguous voxels, two voxels at three rostrocaudal levels from z co-ordinate −53 to −49 in MNI space. The fMRI signal from each voxel within the seed was averaged to represent the RVM seed fMRI signal.
To study functional connections with the RVM, we performed separate functional connectivity analyses. We first calculated the RVM connectivity within pre-defined time periods (blocks) corresponding to low and high pain intensities (Figure 1B). Secondly, we achieved additional temporal information about these connections by using a sliding-window dynamic connectivity analysis to assess the relationship between RVM connectivity and pain intensity throughout the 12-minute scan period (Figure 1C).
 |
Figure 1 (A) Diagram of endogenous pain-modulation pathways that regulate nociceptive transmission at the spinal trigeminal nucleus. Orange, nociceptor afferent projection; blue, efferent projection from the periaqueductal gray matter; green, efferent projection from the rostral ventromedial medulla (RVM). (B) A single-subject, single-voxel representation of a block analysis used to assess brainstem connectivity during fluctuations in spontaneous pain. In this analysis, connectivity between the RVM and every other voxel in the brainstem was determined during two 50-second periods, one during an individual subject’s lowest pain (blue shading) and a second during their highest pain (pink shading). Pain intensity was assessed on a visual analogue scale (VAS) from 0 = no pain to 10 = highest imaginable pain. (C) In addition to the block analysis, a sliding-window analysis was performed in which RVM connectivity was assessed during a 50-second period (window 1 grey box) which was then moved forward by 2 seconds (window 2 black box) and another connectivity strength value calculated. These RVM connectivity values were compared to corresponding sliding-window pain ratings by linear regression. |
RVM High versus Low Pain Block Functional Connectivity
Firstly, we wished to determine whether RVM functional connectivity with other brainstem areas changes according to when patients experienced highest versus lowest spontaneous pain. For each of the 12 fluctuating pain subjects, we calculated RVM connectivity in two separate 50-second (25-volume) time periods (blocks) – one representing the period during which the patient experienced their lowest pain during the scan, and the other representing the period of highest pain (Figure 1B). Importantly, to minimize effects of movement, we calculated connectivity during blocks of relatively stable pain in each individual and avoided periods during which subjects reported sharp changes in pain that would result in large (>1cm) volume-to-volume movements along the CoVAS. For each block, using the subject’s brainstem images, we used the Data Processing Assistant for Resting-State fMRI (DPARSF) toolbox22 to calculate the Pearson’s correlation coefficient between the RVM fMRI signal and that of every other voxel in the brainstem. The resulting RVM connectivity maps were smoothed using a 2mm full-width-at-half-maximum Gaussian filter and significant differences between highest and lowest pain were determined in a paired random-effects analysis for 12 fluctuating pain subjects. We set a threshold of p<0.05 family-wise error (FWE) corrected after small volume correction (svc).
Several areas were specified as independent regions of interest (ROI) for svc based on areas involved in orofacial pain modulation. Previous investigations into acute and chronic orofacial pain have identified structural and functional changes along the SpV which runs along the dorsolateral medulla and caudal part of the dorsal pons. As such, we set svc based on peak coordinates of clusters encompassing the SpV at different rostrocaudal levels from previous investigations, including the SpV caudalis (±4, −40, −59)23 and SpV interpolaris (±6, −42, −53).14 Additional regions for svc included other brainstem pain-modulation areas that have previously shown enhanced RVM connectivity in PTN patients compared to controls – specifically, the ventrolateral PAG (±4, −32, −9), locus coeruleus (±4, −38, −23) and rostral SRD (±6, −44, −41).14,24 Given the small cross-sectional size of the brainstem nuclei, all spheres for svc had a radius of 3mm. For other brainstem regions excluding the ROIs, we set a threshold of p<0.05 FWE corrected. For showing a partial equivalent of effect size and for visualization purposes, we present statistical maps of the brainstem at a threshold of p<0.001 uncorrected.
Within each significant cluster, we extracted connectivity strength values for both lowest- and highest-pain blocks in each fluctuating pain subject and plotted mean (±SEM) functional connectivity strengths to provide a measure of connectivity direction (i.e. positive or negative). In each of the regions identified in the highest versus lowest pain analysis as well as for the RVM, we also extracted the percentage change (relative to the entire 12-minute scan) in fMRI signal intensity for each significant cluster to determine whether signal intensity changed significantly between lowest and highest pain blocks (p<0.05, paired t-tests Bonferonni corrected for multiple tests).
In addition, where possible we assessed pain intensity and connectivity in a “dose-response” manner. In fluctuating pain subjects who reported multiple pain intensity changes throughout the scan, we calculated RVM connectivity in an additional one or two blocks during increasingly intense pain. The number of additional blocks depended upon the number of pain intensity changes reported by each individual subject. After smoothing these additional functional connectivity maps using a 2mm Gaussian filter, we extracted and plotted mean functional connectivity values from significant clusters identified in the highest versus lowest pain analysis. This resulted in maximum of four RVM functional connectivity blocks for each cluster that represented fluctuating pain during lowest (Block 1) to highest (Block 4) pain in each subject.
Since equal numbers of fluctuating pain patients experienced unilateral left- and right-sided pain, we used post-hoc analyses to explore whether RVM connectivity in the four blocks of increasing pain depended upon the side of pain. We calculated mean (±SEM) functional connectivity strengths in each region identified in the highest versus lowest pain analysis in the groups of left- and right-sided fluctuating pain patients (no further statistical comparison due to small group size). Furthermore, the highest versus lowest pain analysis revealed significant pain-related changes in the region of the SpV. Since this region receives ipsilateral nociceptor afferents from the site of orofacial pain, we wished to determine whether a similar pattern of RVM connectivity changes occurred bilaterally. We created an additional ROI in which we mirrored the SpV cluster in the X plane, and extracted RVM connectivity strengths with the contralateral SpV in the four blocks of increasingly intense pain in all fluctuating pain patients. We determined whether this region also showed significantly different RVM connectivity strengths during highest versus lowest pain (p<0.05, paired t-test). Finally, to explore the effect of pain side, we calculated mean (±SEM) functional connectivity strengths in the contralateral SpV in the fluctuating pain patients separated into subgroups of left- and right-sided pain.
To assess RVM connectivity change over time in the 7 subjects who displayed stable pain over the 12-minute scanning period, we calculated RVM connectivity in four equally spaced 25-volume blocks (Figure 2). For each significant cluster revealed by the high versus low pain analysis in the fluctuating pain subjects, we extracted and plotted the mean RVM connectivity values for all four blocks in the stable subjects.
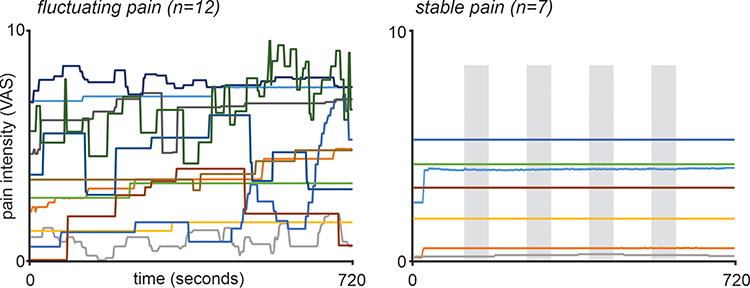 |
Figure 2 Ongoing pain intensity ratings during the 12-minute functional magnetic resonance imaging scan in 19 subjects with painful trigeminal neuropathy. Pain intensity was assessed on a visual analogue scale (VAS) from 0 = no pain to 10 = highest imaginable pain. The 12 subjects in which pain fluctuated throughout the scan are shown on the left and it is clear that they all display pain intensity changes throughout the entire scanning period. In contrast, plotted on the right are the 7 stable pain subjects. Apart from an initial change in 2 subjects, pain intensity remains relatively stable in all subjects throughout the 12-minute scanning period. The grey shading represents the evenly-spaced periods during which RVM functional connectivity was calculated for the stable pain subjects. |
RVM Sliding-Window Functional Connectivity
In addition to exploring blocks of connectivity during different pain intensities, we also determined if there was a continuous relationship between fluctuating spontaneous pain intensity and RVM connectivity strength. Ten of the 12 fluctuating pain subjects displayed multiple pain intensity changes throughout the 12-minute scanning period. Using the Dynamic BC toolbox,25 in each of these 10 fluctuating pain subjects, their brainstem fMRI image sets were divided into 50-second (25-volume) windows with a TR of 2 seconds, resulting in 336 sliding windows (Figure 1C). For each window, a Pearson’s correlation coefficient was calculated between the RVM seed and each brainstem voxel, yielding 336 dynamic RVM connectivity maps per subject. The resultant connectivity maps were spatially smoothed using a 2mm full-width-at-half-maximum Gaussian filter. These dynamic RVM functional connectivity maps were then entered into a first-level linear regression analysis in which RVM dynamic functional connectivity was compared with 336 corresponding sliding-window ongoing pain intensity ratings.
The resulting Pearson correlation maps were entered into a group-level one sample t-test to determine brainstem regions in which dynamic RVM functional connectivity significantly correlated with pain (p<0.05 FWE following svc in a priori regions of interest). For brainstem regions excluding the ROIs, we set a threshold of p<0.05 FWE corrected. For visualization purposes, we present statistical maps of the brainstem at a threshold of p<0.001 uncorrected. In clusters that showed a significant correlation between pain and RVM dynamic functional connectivity, we extracted dynamic connectivity strength values from a 2mm sphere surrounding the peak voxel using each subject’s 336 dynamic functional connectivity maps. We temporally smoothed each subject’s dynamic connectivity values by applying a 12 second moving average and plotted individual sliding-window pain versus RVM connectivity for each significant cluster.
Results
Pain Characteristics
Individual PTN subject characteristics are shown in Table 1. Their mean (±SEM) diary pain intensity (n=18) was 4.0±0.5 out of 10 and mean pain duration 5.4±1.5 years. All PTN subjects reported pain on the day of the scan and most frequently described their pain as throbbing (47%), sharp (32%) and exhausting (42%). Behavioural data showed that 12 patients reported fluctuations in their spontaneous pain intensity, whereas 7 subjects reported stable pain intensity throughout the fMRI scan (Figure 2). Of the 12 fluctuating pain patients, 6 reported unilateral left pain and 6 reported unilateral right pain (Table 1), and of the 7 stable pain patients, 6 reported unilateral pain (left: n=4; right: n=2) and 1 reported bilateral pain. In the 12 fluctuating pain subjects, mean (±SEM) pain intensity during the 4 pain blocks used for the connectivity analysis were: Block 1 (lowest pain; n=12) 2.8±0.7; Block 2 (n=9) 3.9±0.7; Block 3 (n=10) 4.8±0.7; Block 4 (highest pain; n=12) 5.1±0.7. In the 7 stable pain subjects, mean pain intensity throughout the entire scan was 2.6±0.7. There was no significant difference in the mean diary (7 days) pain intensities between the fluctuating pain and stable pain groups (fluctuating pain: 4.3±0.7; stable pain: 3.5±0.5; p>0.05 two-sample t-test), nor was there a significant difference in the variability of diary pain ratings between the fluctuating pain and stable pain groups (mean variability: fluctuating pain, n=11: 1.3±0.3; stable pain, n=7: 0.7±0.1, p>0.05, two-sample t-test).
 |
Table 1 Painful Trigeminal Neuropathy Subject Characteristics |
RVM High versus Low Pain Block Functional Connectivity
Fluctuating Pain – Highest versus Lowest
The RVM voxel-by-voxel functional connectivity analysis between highest and lowest pain in fluctuating pain subjects revealed two brainstem regions that displayed pain-related changes (Figure 3, Table 2). Significantly greater RVM connectivity strengths during highest versus lowest pain occurred in the region of the midbrain PAG (mean±SEM Pearson’s correlation co-efficient: lowest pain: −0.12±0.07, highest pain: 0.16±0.06), and in a region encompassing the left caudalis division of SpV (SpVc: lowest pain: −0.10±0.08, highest pain: 0.22±0.08). Plots of individual subject RVM-PAG and RVM-SpVc connectivity strengths show that these changes are consistent across subjects, with connectivity strengths increasing from low to high pain in 11 of the 12 fluctuating pain subjects for the RVM-PAG connection, and 9 subjects for the RVM-SpVc connection. For the PAG and SpVc clusters, percentage changes in signal intensity were also calculated for the lowest and highest pain periods. Despite significant changes in RVM-PAG and RVM-SpVc connectivity there were no significant changes in the magnitude of fMRI signal intensity in these regions during lowest compared with the highest pain periods (mean±SEM % signal intensity: PAG: lowest pain: −0.23±0.17, highest pain: 0.15±0.16; RVM: lowest pain: 0.03±0.15, highest pain: −0.31±0.16; SpVc: lowest pain: 0.21±0.16, highest pain: −0.04±0.12).
 |
Table 2 Montreal Neurological Institute (MNI) Coordinates, Cluster Sizes and t-Values for Regions of Significant Increases in RVM Block Functional Connectivity (FC) During Highest Pain Compared to Lowest Pain in Fluctuating Pain Subjects (n=12) |
 |
Figure 3 Significant differences in rostral ventromedial medulla (RVM) functional connectivity (FC) strength between periods of high versus low pain in 12 fluctuating pain subjects. The overlay on the left shows the RVM seed in blue and shows regions in which RVM FC strength was greater during high compared with low pain (hot color scale) overlaid onto axial slices of the SUIT template in the 12 fluctuating pain subjects. The slice locations in Montreal Neurological Institute space are shown at the top left of each slice. Note that RVM FC was greater during high pain in the region of the midbrain periaqueductal gray matter and the spinal trigeminal nucleus. The plots to the left show mean±SEM RVM FC strengths during lowest pain (block 1) and highest pain (block 4). The center plots show the 12 individual subject RVM FC values during lowest and highest pain blocks. Note that as pain increases, 11 of the 12 subjects display an increase in RVM FC strength with the periaqueductal gray and 9 subjects show similar increases in RVM FC strength with the spinal trigeminal nucleus. The dose-response plots to the right show mean±SEM RVM FC strengths during four blocks of increasing pain from lowest pain to highest pain. Note that as pain increases so does RVM FC strength. *Significant difference determined in the voxel-by-voxel analysis. |
For the PAG and SpVc clusters, RVM connectivity strengths were also extracted from additional blocks of increasing pain. The mean RVM connectivity strength in the PAG for Block 2 was −0.06±0.08 and for Block 3 was −0.02±0.07. A similar pattern of increasing strength emerged in the SpVc cluster, where the mean connectivity strength in Block 2 was 0.08±0.07 and in Block 3 was 0.09±0.08. That is, as pain intensity increased from low to high, so did RVM-PAG and RVM-SpVc connectivity strengths. In contrast, RVM connectivity was not greater during periods of lowest pain compared to highest pain in any brainstem region.
Fluctuating pain subjects experiencing unilateral left- and right-sided pain appeared to show a similar pattern of pain-related RVM connectivity changes with the SpVc (Left: Block 1: −0.07±0.11, Block 2: 0.07±0.12, Block 3: 0.08±0.07, Block 4: 0.29±0.07; Right: Block 1: −0.14±0.13, Block 2: 0.09±0.11, Block 3: 0.11±0.11, Block 4: 0.16±0.17) and with the PAG (Left: Block 1: −0.25±0.09, Block 2: −0.10±0.08, Block 3: −0.02±0.09, Block 4: 0.13±0.09; Right: Block 1: 0.00±0.09, Block 2: −0.04±0.18, Block 3: 0.05±0.14, Block 4: 0.18±0.06).
We explored whether a similar pattern of pain-related RVM connectivity strength increases occurred in the contralateral SpVc. Extraction of RVM connectivity strengths from the right SpVc indicated that there was no significant difference between lowest versus highest pain periods in RVM connectivity with this region (lowest pain: 0.11±0.09, highest pain: 0.08±0.08, p>0.05 paired t-test). Furthermore, there was no pattern of altered RVM connectivity with the right SpVc as pain intensity increased (Block 2: 0.26±0.08, Block 3: 0.05±0.07). This is not related to the side of pain, since the pattern of RVM connectivity strengths with the right SpVc appeared similar between individuals with left- and right-sided pain (Left: Block 1: 0.14±0.08, Block 2: 0.22±0.11, Block 3: 0.12±0.10, Block 4: 0.15±0.04; Right: Block 1: 0.08±0.19, Block 2: 0.28±0.13, Block 3: 0.05±0.20, Block 4: 0.13±0.15).
Stable Pain – Functional Connectivity Over Time
In the PAG and SpVc clusters revealed in the fluctuating pain analysis, we determined the nature of RVM connectivity over time the 7 stable pain subjects (Figure 4). RVM-PAG connectivity strength was stable (mean±SEM Block 1 [early]: 0.07±0.11; Block 2: −0.02±0.08; Block 3: −0.05±0.10; Block 4 [late]: −0.09±0.034), whilst RVM-SpV connectivity varied slightly (Block 1: 0.14±0.09; Block 2: −0.04±0.10; Block 3: 0.10±0.11; Block 4: 0.01±0.11). There were no significant differences between early versus late RVM-PAG or RVM-SpVc connectivity strengths (p>0.05, paired t-tests).
 |
Figure 4 Plots of mean±SEM rostral ventromedial medulla (RVM) functional connectivity (FC) strength during four blocks evenly spaced during the 12-minute scan in the 7 stable pain subjects. The region of the midbrain periaqueductal gray matter and spinal trigeminal nucleus that were examined are indicated by the black shading and arrow on the overlays to the left. |
RVM Sliding-Window Functional Connectivity
The dynamic functional connectivity linear regression analysis revealed that in the group of 10 fluctuating pain subjects, RVM dynamic functional connectivity was positively correlated with sliding-window pain intensity over the entire scan in the region of the left SpVc (Figure 5, Table 2). We extracted and temporally smoothed the RVM dynamic connectivity values within a 2mm sphere around the SpVc cluster and found that 9 of the 10 fluctuating pain subjects showed a significant (p<0.05) positive correlation between pain intensity and RVM-SpVc connectivity. Three individual subject plots of pain versus RVM-SpVc connectivity are shown in Figure 5. In no brainstem region did RVM dynamic connectivity show a negative relationship with pain intensity.
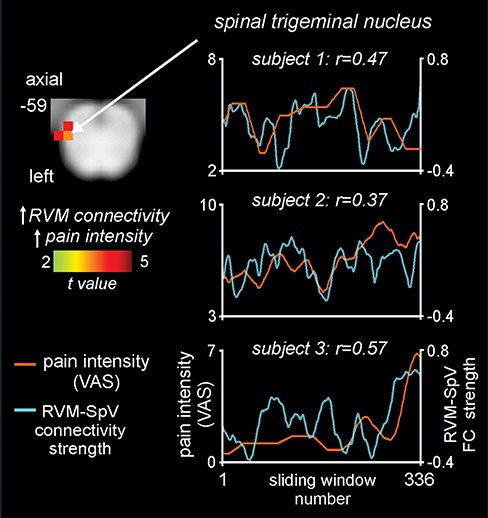 |
Figure 5 Brainstem region in which rostral ventromedial medulla (RVM) dynamic functional connectivity (FC) strength covaries significantly with ongoing pain in 10 fluctuating pain subjects. The overlay on the left shows the region of the spinal trigeminal nucleus (SpV) where RVM dynamic connectivity covaries positively (hot color scale) with pain measured on a visual analogue scale (VAS) from 0 = no pain to 10 = highest imaginable pain. Slice location in Montreal Neurological Institute space is shown at the top left of the axial slice. To the right are plots of pain intensity (orange line) and RVM-SpV connectivity strength (blue line) in three subjects. Note the ongoing relationship between changes in pain intensity and RVM-SpV connectivity strength. |
Discussion
The results of this study demonstrate that in individuals with chronic neuropathic pain, fluctuations in spontaneous pain are associated with fluctuations in brainstem pain-modulation circuitry connectivity. That is, when pain intensity was spontaneously high, RVM-PAG and RVM-SpVc functional connectivity strengths were high and vice versa. Additionally, the sliding window connectivity analysis revealed that individuals with relatively rapidly fluctuating pain showed a positive correlation between ongoing pain intensity and RVM-SpVc connectivity over the duration of the 12-minute scan. These connectivity changes were not associated with changes in overall activity levels. These data show that there are moment-to-moment changes in brainstem pain-modulation circuit coupling and these likely contribute to fluctuations in spontaneous pain intensity in individuals with chronic neuropathic pain.
It is well established from experimental animal models that the ventrolateral PAG can modulate ascending nociceptive transmission at the dorsal horn and SpV via a projection with the RVM.6,26 Within the RVM, distinct populations of neurons termed “off” and “on” cells can profoundly inhibit and facilitate neurotransmission at the primary nociceptive synapse, respectively.7,27,28 In pain-free individuals, it is thought that this descending system is finely balanced and that subtle variations in spontaneous RVM on- and off-cell firing leads to fluctuations in the nociceptive threshold.28 In contrast, in individuals with chronic neuropathic pain, it has been suggested that there is a shift in pain-modulation system functioning, such that it favors pro-nociception and thus contributes to the maintenance of ongoing pain.12,29 Indeed, experimental animal models of neuropathic pain show that the deactivation of either the PAG or RVM eliminates evoked and spontaneous pain following spinal nerve ligation.10,12,30 Additionally, RVM neuronal populations display altered firing properties in several experimental animal models of pain; for instance, on- and off-cells develop enhanced responses to evoked stimuli following nerve injury31 and demonstrate altered spontaneous firing patterns in inflammatory pain conditions.32
Consistent with experimental animal literature, recent clinical studies suggest that the brainstem pain-modulation network is disrupted in chronic pain states. Human psychophysical studies indicate that patients with painful peripheral neuropathies and atypical trigeminal neuralgia show reduced conditioned pain modulation analgesia,33–35 a process that relies on effective descending inhibition from the brainstem.36 Furthermore, previous findings from our laboratory indicate that compared to pain-free individuals, individuals with PTN show enhanced positive RVM functional connectivity with several brainstem regions involved in pain modulation, including the PAG and SpV interpolaris.14
Enhanced RVM-PAG and RVM-SpV connectivity during periods of spontaneous high compared to low pain in PTN subjects are consistent with these previous findings and suggests that the PAG, via the RVM, facilitates transient increases in nociceptive transmission at the SpV. More specifically, in fluctuating pain subjects, we identified pain-related changes in RVM connectivity with SpV caudalis near the caudalis/interpolaris transition zone. This region was marginally caudal to the RVM-SpV interpolaris connectivity strength changes observed previously between PTN patients and pain-free individuals,14 although both SpV regions receive orofacial nociceptor afferents as well as descending input from the RVM.37,38 Interestingly, we found that the lowest-pain period was associated with negative RVM-SpV and RVM-PAG functional connectivity which may reflect periods of descending inhibition or reduced facilitation, although there is ongoing debate surrounding the origins of negative functional connectivity.39 Given that RVM inhibitory and facilitating neurons show altered firing properties in experimental animal models of chronic pain,31,32 it is conceivable that transient changes in descending modulation output influences the perceived intensity of spontaneous pain in various chronic pain conditions. Whilst we cannot study such pain intensity fluctuations in experimental animal models, the sliding-window analysis in this study suggests that there are indeed transient changes in the coupling of descending modulatory circuits, which may contribute to spontaneous fluctuations in perceived pain intensity. Interestingly, we found no change in absolute levels of activity in these brainstem regions indicating that spontaneous changes in pain are associated with changes in brainstem coupling and not overall activity levels. Furthermore, we found that the fluctuations in RVM-SpV caudalis connectivity occurred only on the left side, despite equal numbers of fluctuating pain patients reporting left- and right-sided pain. It is unclear why these changes occur contralaterally for patients with right-sided pain, since experimental studies suggest that changes in the RVM following nerve injury affect nociceptive processing in the dorsal horn exclusively ipsilateral to the injury site.31 However, in the trigeminal system, tract-tracing studies show that some nerve fibers possess terminals in the bilateral SpV caudalis,40 and RVM lesions reduce mechanical sensitivity in orofacial areas bilaterally following unilateral inflammation.41 However, given the low sample size of patients in each subgroup of individuals with left- and right-sided pain in the present study, this requires further exploration.
Although this is the first study to investigate spontaneous pain fluctuations in individuals with orofacial neuropathic pain, several previous studies have reported on the temporal properties of pain in patients with post-herpetic neuralgia2,3 and chronic low back pain.3–5,42–44 Unlike our study, these investigations do not report on patients whose pain remains stable throughout the test period and also did not explore coupling between the RVM and the region of the primary afferent synapse. Several investigations exploring spontaneous pain fluctuations have used fMRI or EEG to study the neural representation of ongoing chronic pain intensity, and these studies suggest that spontaneous pain fluctuations are related to activity levels in the cingulate cortex and prefrontal cortex.4,5 Some have suggested that the intensity of ongoing back pain is represented in regions coding the cognitive/emotional aspects of pain rather than sensory processes,4,44 whereas a post-herpetic neuralgia investigation found activity within affective and somatosensory processing regions are important for coding spontaneous neuropathic pain.2 Whilst it is known that brain regions such as the prefrontal and cingulate cortices can modulate PAG activity, it is possible that changes in somatosensory regions also contribute to fluctuations in various forms of ongoing pain, since neuropathic pain conditions are associated with functional and structural changes along the somatosensory pathways45–47.
There are several limitations worth noting. Firstly, in several previous studies that explored brain activity and pain intensity simultaneously, a visual control method was applied to ensure that the rating task itself did not account for brain activity changes during pain recordings. We did not employ a visual control in the present study and argue that the evaluation of within-subjects differences in connectivity between the period of highest and lowest pain is a controlled experiment since the task is identical in both conditions. Secondly, small movements along the CoVAS slider would produce motor activation which may alter our interpretation; however, we avoided analyzing connectivity during periods in which subjects reported a sharp change in pain. Furthermore, potential movement-related changes in connectivity are unlikely to be revealed during the dynamic connectivity analysis since the sliding-window takes the average connectivity over the 50-second period, and so transient effects are likely reduced. A further potential limitation is the relatively small sample size of both fluctuating and stable pain groups. However, this sample size is similar to previous studies into ongoing pain fluctuations.2,3,5,44 Finally, it remains unclear whether functional connectivity in shorter (e.g. 50 second) periods represents the same underlying mechanism as functional connectivity taken over the entire scan (termed “static” connectivity). Despite this, several investigations have linked sliding-window connectivity with a physiological or behavioural variable.48,49 This is considered a useful approach as it provides a link between dynamic connectivity and function,50 and here we have used a similar linear regression approach to Chang et al to study whether RVM connectivity tracks fluctuating pain over time.
Conclusions
Overall, our findings show that functional connectivity within the brainstem pain-modulation system changes according to pain intensity fluctuations in the order of seconds in individuals with chronic orofacial neuropathic pain. These findings support experimental animal data showing that descending circuits can both inhibit and facilitate nociceptive transmission at the dorsal horn and SpV. Specifically, the enhanced positive connectivity between the RVM and both the PAG and SpV during the period of highest compared with lowest pain provides support for the pro-nociceptive function of brainstem pain-modulation circuits following nerve injury.10,12,30 The change in connectivity direction between the period of highest- to lowest-pain may also reflect transient fluctuations in descending modulation output at the SpV, a process that likely contributes to spontaneous pain fluctuations by regulating ascending nociceptive transmission to the thalamus and cortical areas such as the prefrontal cortex.5 Therefore, the functional state of the brainstem circuitry may contribute to the pathology underlying chronic neuropathic pain in humans.
Disclosure
The authors report no conflicts of interest in this work.
References
1. Elliott AM, Smith BH, Penny KI, Smith WC, Chambers WA. The epidemiology of chronic pain in the community. Lancet. 1999;354(9186):1248–1252. doi:10.1016/S0140-6736(99)03057-3
2. Geha PY, Baliki MN, Chialvo DR, Harden RN, Paice JA, Apkarian AV. Brain activity for spontaneous pain of postherpetic neuralgia and its modulation by lidocaine patch therapy. Pain. 2007;128(1–2):88–100. doi:10.1016/j.pain.2006.09.014
3. Foss JM, Apkarian AV, Chialvo DR. Dynamics of pain: fractal dimension of temporal variability of spontaneous pain differentiates between pain states. J Neurophysiol. 2006;95(2):730–736. doi:10.1152/jn.00768.2005
4. May ES, Nickel MM, Ta Dinh S, et al. Prefrontal gamma oscillations reflect ongoing pain intensity in chronic back pain patients. Hum Brain Mapp. 2019;40(1):293–305. doi:10.1002/hbm.24373
5. Baliki MN, Baria AT, Apkarian AV. The cortical rhythms of chronic back pain. J Neurosci. 2011;31(39):13981–13990. doi:10.1523/JNEUROSCI.1984-11.2011
6. Basbaum AI, Fields HL. Endogenous pain control systems: brainstem spinal pathways and endorphin circuitry. Annu Rev Neurosci. 1984;7:309–338. doi:10.1146/annurev.ne.07.030184.001521
7. Heinricher MM, Tavares I, Leith JL, Lumb BM. Descending control of nociception: specificity, recruitment and plasticity. Brain Res Rev. 2009;60(1):214–225. doi:10.1016/j.brainresrev.2008.12.009
8. Ossipov MH, Dussor GO, Porreca F. Central modulation of pain. J Clin Invest. 2010;120(11):3779–3787. doi:10.1172/JCI43766
9. Vera–Portocarrero LP, Yie JX, Kowal J, Ossipov MH, King T, Porreca F. Descending facilitation from the rostral ventromedial medulla maintains visceral pain in rats with experimental pancreatitis. Gastroenterology. 2006;130(7):2155–2164. doi:10.1053/j.gastro.2006.03.025
10. Wang R, King T, De Felice M, Guo W, Ossipov MH, Porreca F. Descending facilitation maintains long-term spontaneous neuropathic pain. J Pain. 2013;14(8):845–853. doi:10.1016/j.jpain.2013.02.011
11. De Felice M, Sanoja R, Wang R, et al. Engagement of descending inhibition from the rostral ventromedial medulla protects against chronic neuropathic pain. Pain. 2011;152(12):2701–2709. doi:10.1016/j.pain.2011.06.008
12. Burgess SE, Gardell LR, Ossipov MH, et al. Time-dependent descending facilitation from the rostral ventromedial medulla maintains, but does not initiate, neuropathic pain. J Neurosci. 2002;22(12):5129–5136. doi:10.1523/JNEUROSCI.22-12-05129.2002
13. Cleary DR, Heinricher MM. Adaptations in responsiveness of brainstem pain-modulating neurons in acute compared with chronic inflammation. Pain. 2013;154(6):845–855. doi:10.1016/j.pain.2013.02.019
14. Mills EP, Di Pietro F, Alshelh Z, et al. Brainstem pain-control circuitry connectivity in chronic neuropathic pain. J Neurosci. 2018;38(2):465–473. doi:10.1523/JNEUROSCI.1647-17.2017
15. Nurmikko TJ, Eldridge PR. Trigeminal neuralgia–pathophysiology, diagnosis and current treatment. Br J Anaesth. 2001;87(1):117–132. doi:10.1093/bja/87.1.117
16. Alshelh Z, Mills EP, Kosanovic D, et al. Effects of the glial modulator palmitoylethanolamide on chronic pain intensity and brain function. J Pain Res. 2019;12:2427.
17. Friston KJ, Holmes AP, Worsley KP, Proline JB, Frith CD, Frackowiak RSJ. Statistical parametric maps in functional imaging: a general imaging approach. J Hum Brain Mapp. 1995;2:189–210. doi:10.1002/hbm.460020402
18. Macey PM, Macey KE, Kumar R, Harper RM. A method for removal of global effects from fMRI time series. Neuroimage. 2004;22(1):360–366. doi:10.1016/j.neuroimage.2003.12.042
19. Särkkä S, Solin A, Nummenmaa A, et al. Dynamic retrospective filtering of physiological noise in BOLD fMRI: DRIFTER. NeuroImage. 2012;60(2):1517–1527. doi:10.1016/j.neuroimage.2012.01.067
20. Diedrichsen J. A spatially unbiased atlas template of the human cerebellum. Neuroimage. 2006;33(1):127–138. doi:10.1016/j.neuroimage.2006.05.056
21. Leonardi N, Van De Ville D. On spurious and real fluctuations of dynamic functional connectivity during rest. Neuroimage. 2015;104:430–436. doi:10.1016/j.neuroimage.2014.09.007
22. Yan C, Zang Y. DPARSF: a MATLAB toolbox for “pipeline” data analysis of resting-state fMRI. Front Syst Neurosci. 2010;4:13.
23. Youssef AM, Gustin SM, Nash PG, et al. Differential brain activity in subjects with painful trigeminal neuropathy and painful temporomandibular disorder. Pain. 2014;155(3):467–475. doi:10.1016/j.pain.2013.11.008
24. Youssef AM, Macefield VG, Henderson LA. Pain inhibits pain; human brainstem mechanisms. Neuroimage. 2016;124(Pt A):54–62. doi:10.1016/j.neuroimage.2015.08.060
25. Liao W, Wu GR, Xu Q, et al. DynamicBC: a MATLAB toolbox for dynamic brain connectome analysis. Brain Connect. 2014;4(10):780–790. doi:10.1089/brain.2014.0253
26. Bandler R, Shipley MT. Columnar organization in the midbrain periaqueductal gray: modules for emotional expression? Trends Neurosci. 1994;17(9):379–389. doi:10.1016/0166-2236(94)90047-7
27. Fields HL, Heinricher MM. Anatomy and physiology of a nociceptive modulatory system. Philos Trans R Soc Lond B Biol Sci. 1985;308(1136):361–374.
28. Heinricher MM, Barbaro NM, Fields HL. Putative nociceptive modulating neurons in the rostral ventromedial medulla of the rat: firing of on- and off-cells is related to nociceptive responsiveness. Somatosens Mot Res. 1989;6(4):427–439. doi:10.3109/08990228909144685
29. Ossipov MH, Morimura K, Porreca F. Descending pain modulation and chronification of pain. Curr Opin Support Palliat Care. 2014;8(2):143–151.
30. Pertovaara A, Wei H, Hämäläinen MM. Lidocaine in the rostroventromedial medulla and the periaqueductal gray attenuates allodynia in neuropathic rats. Neurosci Lett. 1996;218(2):127–130. doi:10.1016/S0304-3940(96)13136-0
31. Carlson JD, Maire JJ, Martenson ME, Heinricher MM. Sensitization of pain-modulating neurons in the rostral ventromedial medulla after peripheral nerve injury. J Neurosci. 2007;27(48):13222–13231. doi:10.1523/JNEUROSCI.3715-07.2007
32. Pinto-Ribeiro F, Ansah OB, Almeida A, Pertovaara A. Influence of arthritis on descending modulation of nociception from the paraventricular nucleus of the hypothalamus. Brain Res. 2008;1197:63–75. doi:10.1016/j.brainres.2007.12.038
33. Nahman-Averbuch H, Yarnitsky D, Granovsky Y, et al. Pronociceptive pain modulation in patients with painful chemotherapy-induced polyneuropathy. J Pain Symptom Manage. 2011;42(2):229–238. doi:10.1016/j.jpainsymman.2010.10.268
34. Leonard G, Goffaux P, Mathieu D, Blanchard J, Kenny B, Marchand S. Evidence of descending inhibition deficits in atypical but not classical trigeminal neuralgia. Pain. 2009;147(1–3):217–223. doi:10.1016/j.pain.2009.09.009
35. Granovsky Y. Conditioned pain modulation: a predictor for development and treatment of neuropathic pain. Curr Pain Headache Rep. 2013;17(9):361. doi:10.1007/s11916-013-0361-8
36. Le Bars D, Villanueva L, Bouhassira D, Willer JC. Diffuse noxious inhibitory controls (DNIC) in animals and in man. Patol Fiziol Eksp Ter. 1992;4:55–65.
37. Sessle BJ. Acute and chronic craniofacial pain: brainstem mechanisms of nociceptive transmission and neuroplasticity, and their clinical correlates. Crit Rev Oral Biol Med. 2000;11(1):57–91. doi:10.1177/10454411000110010401
38. Ren K, Dubner R. The role of trigeminal interpolaris-caudalis transition zone in persistent orofacial pain. In: Masayuki Kobayashi NKKI, John LW, editors. International Review of Neurobiology. Vol. 97. Academic Press; 2011:207–225.
39. Chen G, Chen G, Xie C, Li S-J. Negative functional connectivity and its dependence on the shortest path length of positive network in the resting-state human brain. Brain Connect. 2011;1(3):195–206. doi:10.1089/brain.2011.0025
40. Segade LA, Suarez Quintanilla J, Cobos AR. Contralateral projections of trigeminal mandibular primary afferents in the guinea pig as seen by transganglionic transport of horseradish peroxidase. Brain Res. 1990;506(2):267–280. doi:10.1016/0006-8993(90)91261-E
41. Sugiyo S, Takemura M, Dubner R, Ren K. Trigeminal transition zone/rostral ventromedial medulla connections and facilitation of orofacial hyperalgesia after masseter inflammation in rats. J Comp Neurol. 2005;493(4):510–523. doi:10.1002/cne.20797
42. Hashmi JA, Baliki MN, Huang L, et al. Shape shifting pain: chronification of back pain shifts brain representation from nociceptive to emotional circuits. Brain. 2013;136(Pt 9):2751–2768. doi:10.1093/brain/awt211
43. Apkarian AV, Krauss BR, Fredrickson BE, Szeverenyi NM. Imaging the pain of low back pain: functional magnetic resonance imaging in combination with monitoring subjective pain perception allows the study of clinical pain states. Neurosci Lett. 2001;299(1):57–60. doi:10.1016/S0304-3940(01)01504-X
44. Baliki MN, Chialvo DR, Geha PY, et al. Chronic pain and the emotional brain: specific brain activity associated with spontaneous fluctuations of intensity of chronic back pain. J Neurosci. 2006;26(47):12165. doi:10.1523/JNEUROSCI.3576-06.2006
45. Alshelh Z, Di Pietro F, Youssef AM, et al. Chronic neuropathic pain: it’s about the rhythm. J Neurosci. 2016;36(3):1008–1018. doi:10.1523/JNEUROSCI.2768-15.2016
46. Gustin SM, Peck CC, Wilcox SL, Nash PG, Murray GM, Henderson LA. Different pain, different brain: thalamic anatomy in neuropathic and non-neuropathic chronic pain syndromes. J Neurosci. 2011;31(16):5956. doi:10.1523/JNEUROSCI.5980-10.2011
47. Henderson LA, Peck CC, Petersen ET, et al. Chronic pain: lost inhibition? J Neurosci. 2013;33(17):7574. doi:10.1523/JNEUROSCI.0174-13.2013
48. Chang C, Metzger CD, Glover GH, Duyn JH, Heinze HJ, Walter M. Association between heart rate variability and fluctuations in resting-state functional connectivity. Neuroimage. 2013;68:93–104. doi:10.1016/j.neuroimage.2012.11.038
49. Thompson GJ, Magnuson ME, Merritt MD, et al. Short-time windows of correlation between large-scale functional brain networks predict vigilance intraindividually and interindividually. Hum Brain Mapp. 2013;34(12):3280–3298. doi:10.1002/hbm.22140
50. Hutchison RM, Womelsdorf T, Allen EA, et al. Dynamic functional connectivity: promise, issues, and interpretations. NeuroImage. 2013;80:360–378. doi:10.1016/j.neuroimage.2013.05.079
 © 2020 The Author(s). This work is published and licensed by Dove Medical Press Limited. The
full terms of this license are available at https://www.dovepress.com/terms
and incorporate the Creative Commons Attribution
- Non Commercial (unported, 3.0) License.
By accessing the work you hereby accept the Terms. Non-commercial uses of the work are permitted
without any further permission from Dove Medical Press Limited, provided the work is properly
attributed. For permission for commercial use of this work, please see paragraphs 4.2 and 5 of our Terms.
© 2020 The Author(s). This work is published and licensed by Dove Medical Press Limited. The
full terms of this license are available at https://www.dovepress.com/terms
and incorporate the Creative Commons Attribution
- Non Commercial (unported, 3.0) License.
By accessing the work you hereby accept the Terms. Non-commercial uses of the work are permitted
without any further permission from Dove Medical Press Limited, provided the work is properly
attributed. For permission for commercial use of this work, please see paragraphs 4.2 and 5 of our Terms.