Back to Journals » Nature and Science of Sleep » Volume 14
Alterations of Ocular Surface and Tear Film in Patients with Obstructive Sleep Apnea/Hypopnea Syndrome
Authors Lin PW, Lin HC ![]() , Chang CT, Friedman M, Salapatas AM, Lin MC
, Chang CT, Friedman M, Salapatas AM, Lin MC ![]() , Lin CY
, Lin CY
Received 19 September 2021
Accepted for publication 24 January 2022
Published 23 February 2022 Volume 2022:14 Pages 277—290
DOI https://doi.org/10.2147/NSS.S340105
Checked for plagiarism Yes
Review by Single anonymous peer review
Peer reviewer comments 2
Editor who approved publication: Prof. Dr. Ahmed BaHammam
Pei-Wen Lin,1,2 Hsin-Ching Lin,2– 5 Chun-Tuan Chang,5 Michael Friedman,6,7 Anna M Salapatas,7 Meng-Chih Lin,2,8 Chih-Yun Lin9
1Division of Glaucoma, Department of Ophthalmology, Kaohsiung Chang Gung Memorial Hospital, Kaohsiung City; Chang Gung University College of Medicine, Taoyuan City, Taiwan; 2Sleep Center, Kaohsiung Chang Gung Memorial Hospital, Kaohsiung City, Taiwan; 3Department of Otolaryngology, Kaohsiung Chang Gung Memorial Hospital, Kaohsiung City; Chang Gung University College of Medicine, Taoyuan City, Taiwan; 4Robotic Surgery Center and Center for Quality Management, Kaohsiung Chang Gung Memorial Hospital, Kaohsiung City, Taiwan; 5Department of Business Management, Institute of Healthcare Management, National Sun Yat-sen University, Kaohsiung City, Taiwan; 6Department of Otolaryngology, Division of Sleep Surgery, Rush University Medical Center, Chicago City, IL, USA; 7Department of Otolaryngology, Advanced Center for Specialty Care, Advocate Illinois Masonic Medical Center, Chicago City, IL, USA; 8Division of Pulmonary and Critical Care Medicine, Department of Internal Medicine, Kaohsiung Chang Gung Memorial Hospital, Kaohsiung City; Chang Gung University College of Medicine, Taoyuan City, Taiwan; 9Biostatistics Center, Kaohsiung Chang Gung Memorial Hospital, Kaohsiung City, Taiwan
Correspondence: Hsin-Ching Lin, Department of Otolaryngology, Kaohsiung Chang Gung Memorial Hospital, 123, Ta-Pei Road, Niao-Sung District, Kaohsiung City, 833, Taiwan, Tel +886-7-7317123 ext.2533, Fax +886-7-7313855, Email [email protected]; [email protected]
Purpose: Obstructive sleep apnea/hypopnea syndrome (OSA) results in repeated oxygen desaturation, repeated arousals, and episodic nocturnal activation of sympathetic nervous system during sleep. Untreated OSA is strongly associated with an increase of cardio- and cerebrovascular disorders, as well as the damages of ophthalmological microstructures. However, previous literature only simply studied the association between the ophthalmic disorders and OSA. In the present study, we first investigated the alterations of ocular surface and tear film non-invasively with the innovated corneal topographer in untreated OSA patients and normal control subjects. Furthermore, we analyzed in depth whether the correlations between OSA severity and ocular surface exams exist.
Participants and Methods: Participants underwent a full-night polysomnography to determine OSA occurrence and severity. All participants subsequently received Ocular Surface Disease Index questionnaire and comprehensive ocular exams, including floppy eyelid syndrome (FES) assessment, oculus scan for tear meniscus height, non-invasive keratograph tear film breakup time (NIKBUT), and ocular surface redness, endothelial cell density, and corneal fluorescein staining.
Results: One hundred eighty-one participants were prospectively enrolled in the study. FES was found in 11.5% of the normal control group and 60.0% of the severe OSA group (p=0.0005). There were significant differences in the first-NIKBUT (F-NIKBUT) (p < 0.0001), average-NIKBUT (A-NIKBUT) (p = 0.0007), and redness scores over the nasal bulbar (p = 0.032), temporal bulbar (p < 0.0001), nasal limbal (p = 0.014), and temporal limbal (p < 0.0001) areas among the four groups. F-NIKBUT and A-NIKBUT were significantly shorter in the moderate/severe OSA group (apnea/hypopnea index (AHI) ≥ 15) than in the normal/mild OSA group (AHI < 15) (both p < 0.0001). The redness scores over the temporal bulbar (p < 0.0001) and temporal limbal (p < 0.0001) areas were also significantly different in these two OSA groups. Moreover, F-NIKBUT and A-NIKBUT negatively correlated with AHI. Nasal bulbar redness, temporal bulbar redness, nasal limbal redness, and temporal limbal redness positively correlated with AHI.
Conclusion: OSA patients had higher occurrence of FES. The NIKBUT was significantly shorter, and the temporal conjunctival redness scores over bulbar and limbal areas were higher in the moderate/severe OSA group than in the normal/mild OSA group. NIKBUT and conjunctival hyperemia significantly correlated with the severity of untreated OSA.
Keywords: snoring, obstructive sleep apnea, ocular surface and tear film
Introduction
Obstructive sleep apnea/hypopnea syndrome (OSA) is a disorder characterized by recurrent partial or complete obstruction of upper airway and cessation of breathing during sleep. The prevalence of OSA in middle-aged population was 4% in men and 2% in women.1 Untreated OSA has been reported to be highly associated with hypertension, cardiovascular disorders, stroke and even sudden death.2–4 Figure 1 Continued. Figure 1 OSA patients with different presentations of TF-scan and R-scan. A 32-year-old female patient with an AHI of 10.9 had TMH of 0.19 mm (A), NIKBUT Level 0, and First NIKBUT of 18.54 seconds on TF-scan (B), the scores of R scan showed 1.1 for the nasal-bulbar area, 0.6 for the temporal-bulbar area, 0.9 for the nasal-limbal area, and 0.4 for the temporal-limbal area (C). A 30-year-old male patient with an AHI of 17.7 had TMH of 0.18 mm (D), NIKBUT Level 1, and First NIKBUT of 7.65 seconds on TF-scan (E), the scores of R scan showed 1.0 for the nasal-bulbar area, 0.9 for the temporal-bulbar area, 0.9 for the nasal-limbal area, and 0.9 for the temporal-limbal area (F). A 35 year-old male patient with an AHI of 72.2 had TMH of 0.11 mm (G), NIKBUT Level 2, and First NIKBUT of 3.63 seconds on TF-scan (H), The scores of R scan showed 1.8 for the nasal-bulbar area, 2.1 for the temporal-bulbar area, 1.3 for the nasal-limbal area, and 1.0 for the temporal-limbal area (I).

Ocular surface manifestations in OSA patients include floppy eyelid syndrome (FES), blepharochalasis, conjunctivochalasis, papillary conjunctivitis, punctate keratitis, recurrent corneal erosion, and keratoconus.5–9 Side sleeping could reduce the chance and severity of snoring and frequently be favored in OSA patients. However, direct contact of the upper eyelid with pillow during sleeping on side could cause spontaneous eversion of the upper eyelid and traumatize the upper tarsal conjunctiva, which can induce chronic conjunctival congestion and inflammation.6 Besides, repeat eversion of upper eyelid can result in laxity of upper lid and induce poor contact of upper eyelid to the globe with inadequate distribution of the tear film.6 Acar et al noted that moderate and severe OSA patients had a low Schirmer test value, which resulted in more corneal staining and short tear film breakup time (TFBUT).10 Continuous positive airway pressure (CPAP) is the main therapy for moderate to severe OSA patients. The treatment effects of CPAP on the tear film were conflicting in different studies. Some patients may suffer from dryness and irritation due to air leakage from the mask edge; however, others may have more stable tear film and less irritation by supine sleep postures with good fitting of mask.11–13 However, previous studies simply addressed the associations between tear film disorders and OSA, but did not objectively assess the changes of ocular surface in OSA patients.
In the present study, we first investigated the manifestations of ocular surface and tear film non-invasively with the innovated OCULUS Keratograph 5M (OCULUS Optikgeräte GmbH, Wetzlar, Germany) in patients with untreated OSA. The OCULUS Keratograph 5M is a Placido-based corneal topographer and noninvasive tear film analyzer. It has a color camera optimized for external imaging of ocular surface for examinations of tear meniscus height (TMH), non-invasive keratograph tear film breakup time (NIKBUT), and ocular surface redness. The evaluations of the symptoms of dry eye diseases (DED) with Ocular Surface Disease Index (OSDI) questionnaire, basic Schirmer test, and corneal fluorescein staining in different severities of OSA were conducted. The presence of FES was also assessed in all the participants. Furthermore, we analyzed whether the correlations between OSA severity and ocular surface exams exist.
Methods
This study was approved by the Institutional Review Board and Ethics Committee of the Chang Gung Memorial Hospital, Taiwan (CGMH IRB: 201900149B0), and was performed according to the principles outlined in the Declaration of Helsinki. Written informed consent was obtained from all participants.
Subjects
Patients presenting with loud snoring, observed apnea, or excessive daytime sleepiness were prospectively and consecutively admitted for an overnight sleep study and subsequently referred for a comprehensive ophthalmological examination.
Sleep Study (Polysomnography, PSG)
Each participant underwent a full-night attended, comprehensive diagnostic sleep study at our sleep center. The procedures were done identically as in our previous studies.14,15 Apnea/hypopnea index (AHI; /h) was defined as the total number of apneas and hypopneas per hour of electroencephalographic sleep. OSA is defined as an AHI more than 5. Subjects with an AHI between 5 and 15 are classified as mild OSA, an AHI between 15 and 30 is classified as moderate OSA, and an AHI greater than 30 is classified as severe OSA.16
Ophthalmologic Examination
At the time of ophthalmologic exam, the polysomnographic data was unknown to the patients and the examiner. Patients who had a history of stroke with central apnea, presence of any other sleep disorders, systemic lupus erythematosus, sicca syndrome, chronic uveitis, glaucoma, optic neuropathy, previous ocular trauma or surgeries, wearing contact lenses, and receiving topical medication for ocular diseases were excluded from this study.
The DED symptoms were evaluated with OSDI questionnaires. The scores of OSDI questionnaire were from 0 to 100, where 0–12 grade as normal, 13–22 grade as mild DED, 23–32 grade as moderate DED, and 33–100 grade as severe DED.17
After completing the questionnaires, all participants received ocular surface and tear film survey, including OCULUS Keratograph 5M, central corneal thickness and endothelial cell density, corneal fluorescein staining, and basic Schirmer test. Then they underwent ophthalmologic evaluation, including best-corrected visual acuity, intraocular pressure measurement, eyelid evaluation, slit-lamp biomicroscopy, and fundoscopy.
Ocular Surface Scanning with OCULUS Keratograph 5M
Tear Film Analysis with the TF-Scan of OCULUS Keratograph 5M
In the Keratograph 5M software, the TF-Scan was used for assessing tear film volume as TMH and tear film stability as NIKBUT.
All subjects underwent imaging with the tear film analyzer with illumination using 4 infrared diodes of 880 nm wavelength. The central TMH was measured from the lower lid margin at the location vertically below the pupil center to the top of the tear lake with an integrated ruler. The images were captured three times and the mean values were recorded after each blink. To avoid artificial high readings by reflex tearing from other tests, TMH measurement was performed first during tear film assessment.
After TMH evaluation, the NIKBUT was measured non-invasively and automatically by the NIKBUT software. All participants were instructed to look straight ahead, blink twice, and then try their best not to blink as long as they could. Placido rings were reflected on the corneal surface with 880 nm ring illumination to prevent glare during assessment. The NIKBUT results are displayed in a color-coded map. Red or orange segment means a faster breakup time. A breakup characteristics map shows the total area (%) of the cornea affected during the measuring time. The time of the first break in the tear film (F-NIKBUT) and the average time of all the breakups (A-NIKBUT) during the measurement were displayed.
Conjunctival Redness Analysis with R-Scan of Keratograph 5M
The R-Scan is the first modality to evaluate and classify the degree of bulbar and limbal conjunctiva redness objectively. The R-Scan analyzes the conjunctival vessels, evaluates the degree of redness, and makes classification of the bulbar and limbal redness automatically.
The light source was shifted to white ring illumination on the same tear film analyzer for R-scan evaluation after TF-scan measurement. All participants were directed to fixate and focus on the mark inside the camera after blinking and the 22-mire Placido ring system would reflect on the entire corneal area. The conjunctival blood vessels were analyzed, and the severity of redness was quantified using a built-in software calculator. The index of mean bulbar and limbal redness score was obtained within 10 seconds. The degree of redness at nasal and temporal areas was separately displayed. The conjunctival redness value graded from 0 to 4: no vessel injection as grade 0; single injection as grade 1; mild diffuse injection as grade 2; severe local injection as grade 3; and severe diffuse injection as grade 4.
Central Corneal Thickness (CCT) and Endothelial Cell Density Measurement with Non-Contact Specular Microscope (SP-3000P, TOPCON, Tokyo, Japan)
All participants were required to fixate on the central target, with chin on the chin rest and head on the forehead rest. CCT and endothelial cell density measurements were obtained simultaneously using the automatic image capture, low-intensity mode of the specular microscope. The auto-tracking system took over in an area of 8 mm × 8 mm with precise focus and centering to obtain consistent and repeatable images of the corneal endothelium. The CCT and endothelial cell density were automatically displayed.
Cornea Fluorescein Staining
Cornea fluorescein staining was evaluated using a blue cobalt filter after the specular microscope measurement. A single drop of saline is instilled onto a fluorescein-impregnated strip. The lower lid is then pulled down and the strip is tapped onto the lower tarsal conjunctiva. The upper eyelid is lifted slightly to grade the whole conjunctival and corneal surface. Corneal and conjunctival staining was graded from 0 to 5 using the Oxford scheme.18
Basic Schirmer Test
One drop of 0.5% Proparacaine hydrochloride was instilled to each eye. The participants were instructed to close their eyes for 5 minutes, and then a standard Schirmer filter paper strip (Schirmer Tear Test Ophthalmic Strips, OptiTech, Tarun Enterprises, India) was inserted into the inferior lid margin 2–3 mm from the lateral canthus. The strip was removed after 5 minutes. The blue line would have spread in a light blue color. The length of the end of the blue color was recorded.
Eyelid Evaluation for FES
After finishing the tear film and ocular surface survey, the lid laxity was finally assessed to avoid reflex tear secretion and conjunctival hyperemia. All the participants were told to look downward and the examiner (the first author) used the thumb to lift the upper eyelid to find out whether the upper eyelid could be everted easily. When there was no tarsal conjunctiva visible, it was grade 0. When less than one third of the upper tarsal conjunctiva was visible and papillary conjunctivitis was identified by the slit lamp, it was grade 1 FES; when one-third to one-half of the tarsal conjunctiva was visible and papillary conjunctivitis was identified by the slit lamp, it was grade 2 FES; and when more than one-half of the tarsal conjunctiva was visible and papillary conjunctivitis was identified by the slit lamp, it was grade 3 FES.
Statistical Analysis
All analyses were performed using MedCalc® Statistical Software version 20.008 (MedCalc Software Ltd, Ostend, Belgium). Continuous data were compared among four groups using Kruskal–Wallis test and expressed as median (interquartile range). Categorical variables were compared using Chi-square test and expressed as numbers. To determine whether the severity of OSA increased the risk of ocular surface dysfunction, we further divided the patients into two groups: those without OSA and those with mild OSA (AHI < 15) versus those with moderate-to-severe OSA (AHI ≥ 15). Continuous data between two groups were compared using Mann–Whitney test, while categorical data were compared using Chi-square test. Correlation between polysomnographic variables and ophthalmologic variables in OSA patients were assessed using Pearson’s correlation coefficient. One eye per patient was randomly selected for analysis. All statistical tests were two-sided. A p value <0.05 was considered significant.
Results
One hundred and ninety-seven participants underwent PSG and ophthalmologic examinations consecutively. Two patients with sicca syndrome, five with previous refractive surgeries, three with previous cataract surgeries, one with previous ocular trauma, and five with glaucoma under medication treatment were excluded. A total of 181 subjects were finally enrolled in the study. The PSG data of all enrolled participants are shown in Table 1.
 |
Table 1 Demographic Data of Patients Grouped According to the Apnea/Hypopnea Index (AHI) |
FES was found in 11.5% of the normal control group, 45.3% of the mild OSA group, 45.2% of the moderate OSA group, and 60.0% of the severe OSA group (p = 0.0005). Upon analysis of the ophthalmologic data, there were no significant differences among four groups with regard to OSDI, TMH, CCT, endothelial cell density, basic Schirmer test, and corneal staining. Regarding the TF-scan and R-scan data, there were significant differences in the F-NIKBUT (p < 0.0001), A-NIKBUT (p = 0.0008), and redness scores over the nasal bulbar (p = 0.032), temporal bulbar (p < 0.0001), nasal limbal (p = 0.013), and temporal limbal (p < 0.0001) areas among four groups. The data are shown in Table 2.
 |
Table 2 Ophthalmologic Examination Data of OSA Patients Grouped According to the Apnea/Hypopnea Index (AHI, /Hr.) |
To determine whether OSA severity had some effect on ocular surface, all participants were further divided into two groups: normal/mild OSA with an AHI < 15, and moderate/severe OSA with an AHI ≥ 15. Comparison of polysomnographic data between normal/mild OSA (N = 79) and moderate/severe OSA patients (N=102) is shown in Table 3.
 |
Table 3 Comparison of Polysomnographic Data Between Normal/Mild OSA (AHI < 15, N = 79) and Moderate/Severe OSA Patients (AHI ≥ 15; N = 102) |
Upon analysis of the ophthalmologic data, no significant differences were observed between the two groups with regard to OSDI, TMH, CCT, endothelial cell density, basic Schirmer test, and corneal staining. For the TF-scan and R-scan data, the F-NIKBUT and A-NIKBUT were significantly shorter in the moderate/severe OSA group than in the normal/mild OSA group (both p < 0.0001). The redness scores over the temporal bulbar (p < 0.0001) and temporal limbal (p< 0.0001) areas were significantly different between normal/mild OSA and moderate/severe OSA groups. The data are shown in Table 4. Three OSA patients with different presentations of TF-scan and R-scan are shown in Figure 1.
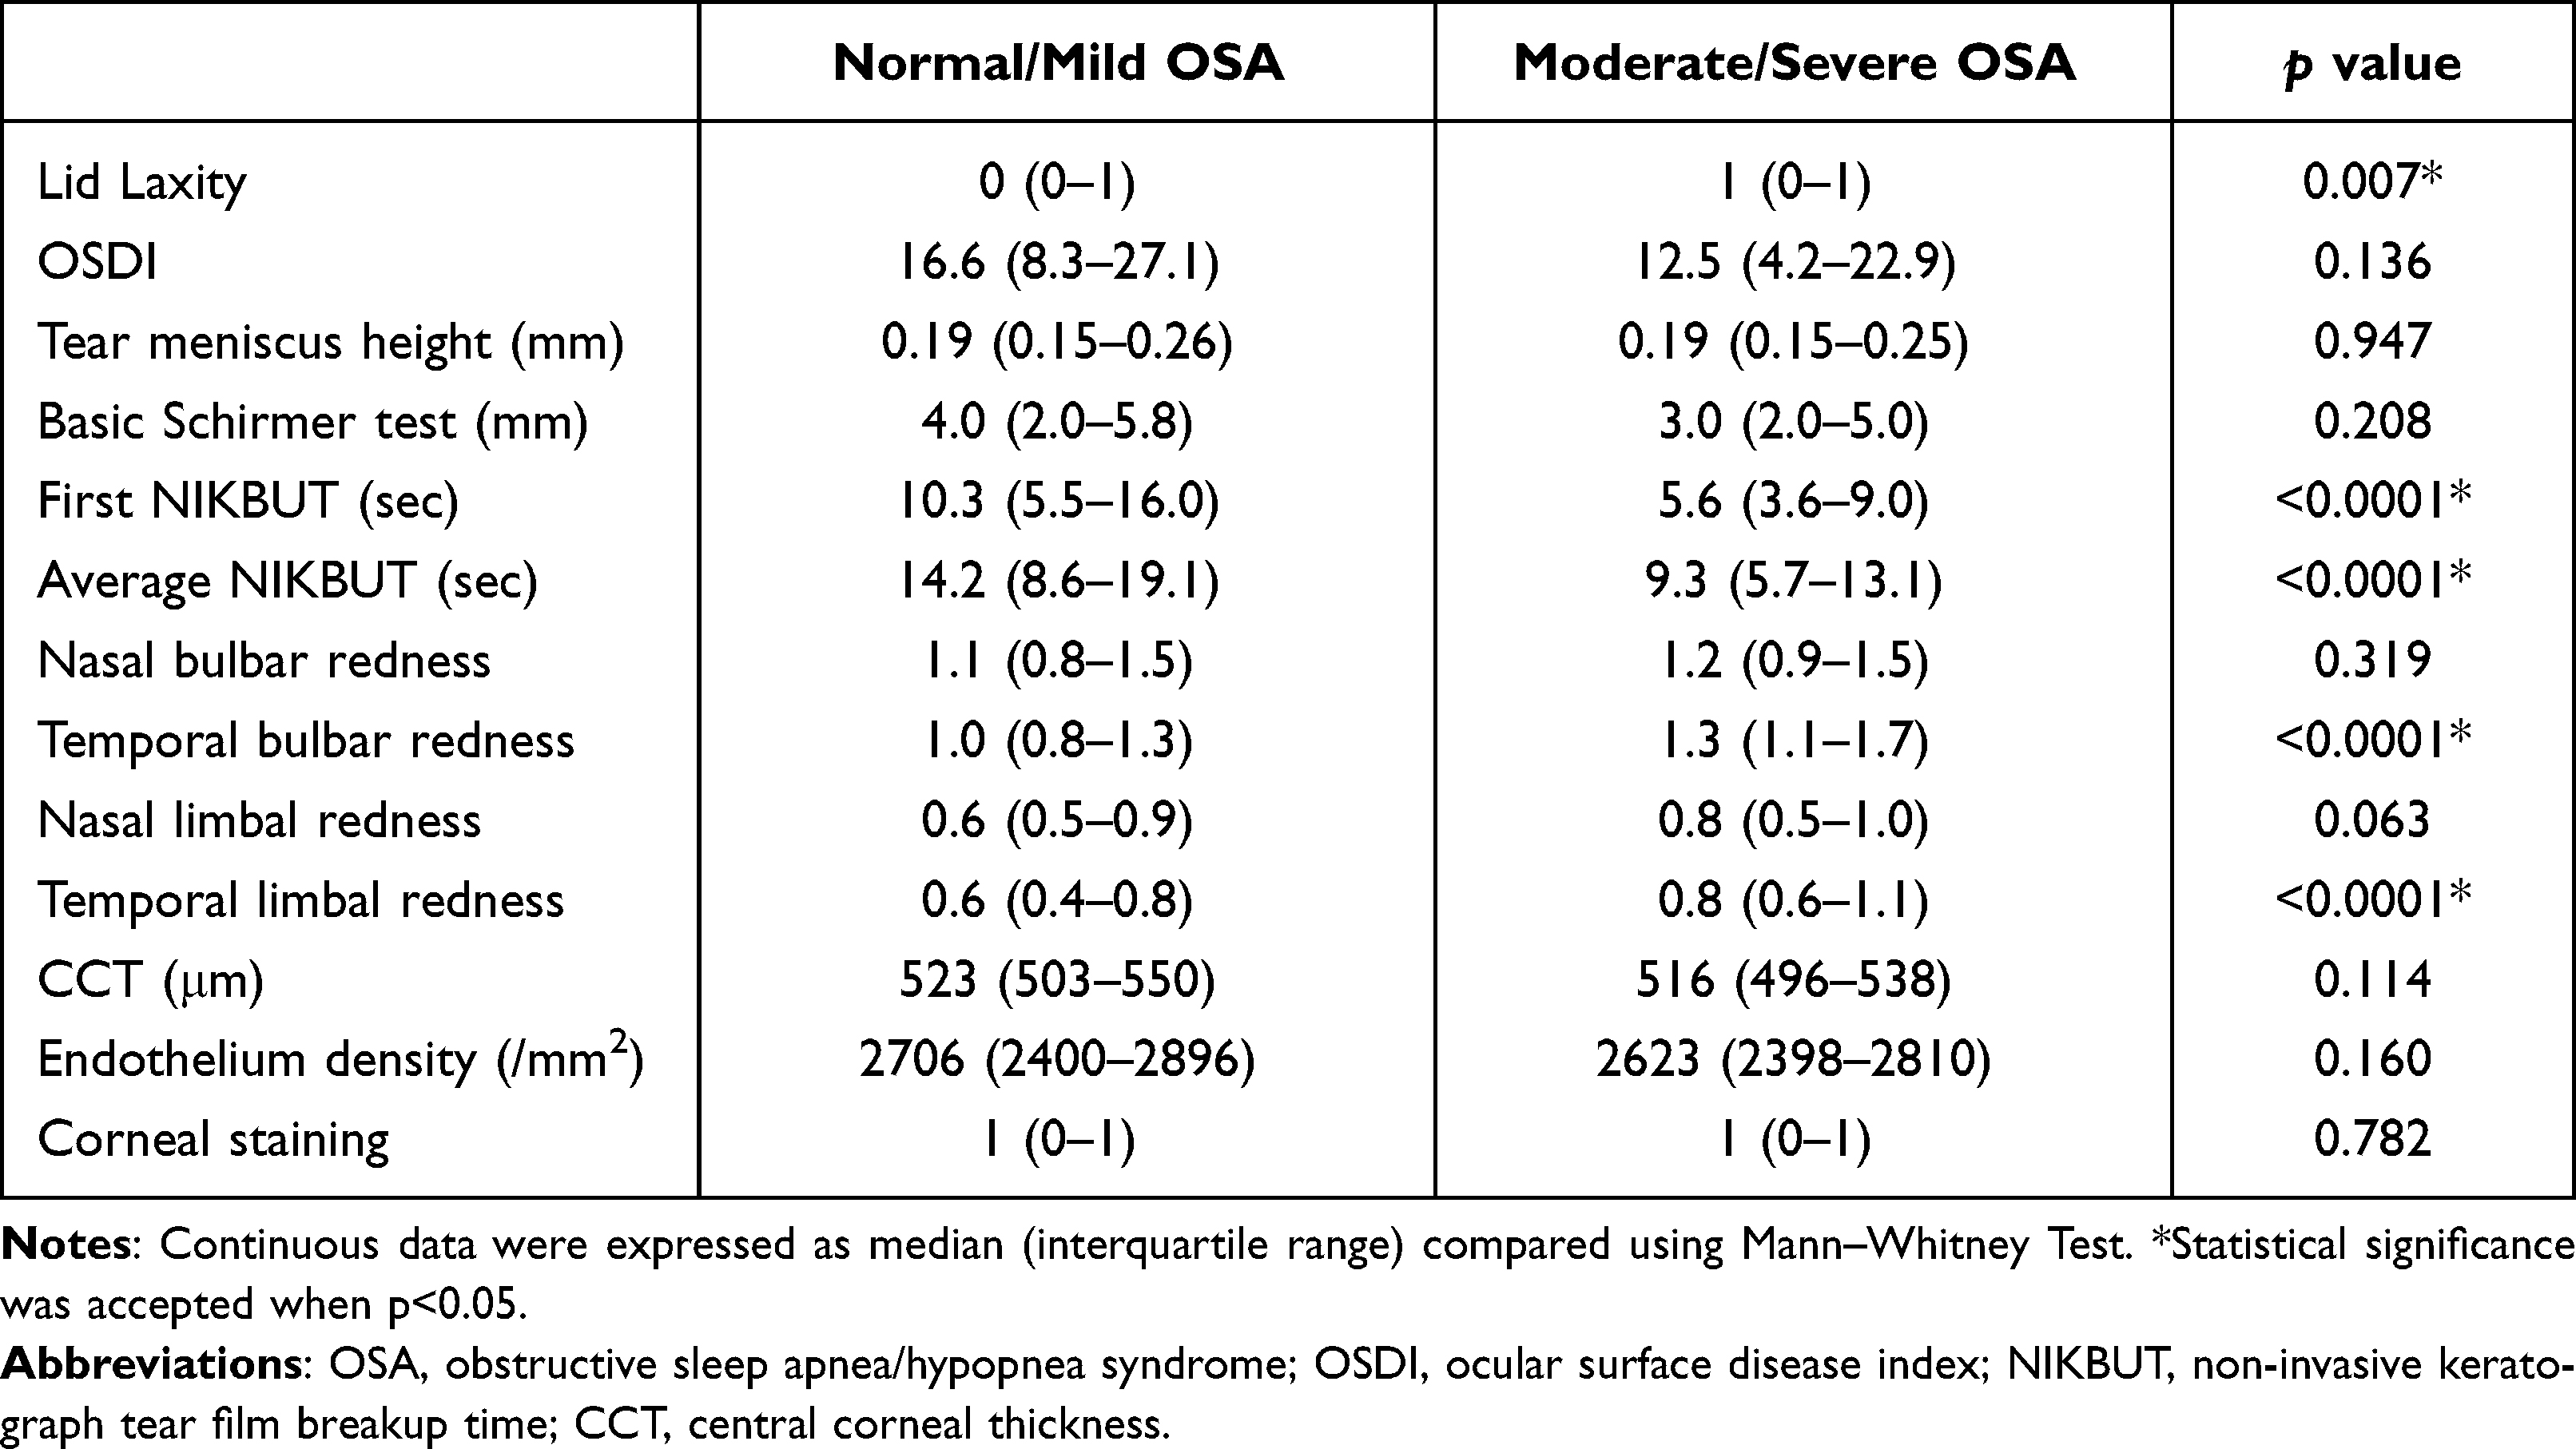 |
Table 4 Comparison of Ophthalmologic Examinations Between Normal/Mild OSA (AHI < 15, N=79) and Moderate/Severe OSA Patients (AHI ≥ 15, N=102) |
 |
Table 5 Correlation (r) Between Polysomnographic Variables and Ophthalmologic Variables in OSA Patients |
Pearson correlation coefficients were used to determine the correlation between PSG and ophthalmologic variables among the OSA patients. The grade of lid laxity positively correlated with AHI (r = 0.189, p = 0.0184), body mass index (BMI) (r = 0.242, p = 0.0010), and ODI (r = 0.203, p = 0.0115). The F-NIKBUT and A-NIKBUT negatively correlated with AHI (r = −0.282, p = 0.0004; and r = −0.226, p = 0.0046, respectively). The F-NIKBUT and A-NIKBUT negatively correlated with longest apnea (r = −0.366, p = 0.0001; and r = −0.292, p = 0.0005, respectively). The F-NIKBUT and A-NIKBUT also negatively correlated with ODI (r = −0.297, p = 0.0002; and r = −0.227, p = 0.0046, respectively). Nasal bulbar redness positively correlated with AHI (r = 0.225, p = 0.0049), BMI (r = 0.152, p = 0.0416), and ODI (r = 0.222, p = 0.0056). Temporal bulbar redness positively correlated with AHI (r = 0.259, p = 0.0011), BMI (r = 0.239, p = 0.0012), and ODI (r = 0.230, p = 0.0041). Nasal limbal redness and temporal limbal redness also positively correlated with AHI (r = 0.215, p = 0.0073; and r = 0.202, p = 0.0117, respectively). These detailed results are shown in Table 5 and Figure 2.
 |
Figure 2 Scatter plots showing the relationships between apnea/hypopnea index and the parameters of TF-scan and R-scan. (A) First NIKBUT; (B) Nasal bulbar redness; (C) Temporal bulbar redness; (D) Nasal limbal redness; (E) Temporal limbal redness. NIKBUT: non-invasive keratograph tear film breakup time. |
Discussion
Culbertson and Ostler first proposed FES by reporting 11 overweight patients who had easily everted upper eyelids and papillary conjunctivitis, while the patients were sleeping.19 Chambe et al studied 127 participants with the portable home sleep monitoring device, not a standard comprehensive full-night sleep study PSG, and they found that FES was noted in 15.8% of the control subjects and 25.8% of OSA patients and the occurrence of FES was significantly increased in severe OSA patients (40%).20 Acar et al noted that patients with moderate/severe OSA had higher rates and more advanced stages of FES.10 They suggested that if complaints such as ophthalmological burning, stinging, and itching which can be commonly observed in middle-aged patients are accompanied by FES, the patient should be evaluated for sleep disorders. In addition, FES patients and control subjects had comparable amount of tarsal collagen, but the tarsal elastin was significantly decreased in the FES patients.21,22 The laxity of the tarsus in FES patients may relate to the decrease in tarsal elastin. Repeated mechanical stress may increase elastolytic enzymes that lead to elastic fiber degradation and subsequent tarsal laxity with eyelash ptosis in FES. In this study, we prospectively enrolled 181 patients who complained with the symptoms of sleep-related breathing disorders and further received a full-night comprehensive PSG for confirming the OSA and disease severity. We found that FES occurred in 45% of the mild/moderate OSA patients, and in 60% of the severe OSA patients, which were significantly higher than that of normal control subjects (11.5%). Furthermore, the grade of lid laxity in our patients positively correlated with AHI, LSaO2 and ODI.
Previous studies showed that OSA patients are more likely to have DED. Tear film instability, tear hyperosmolarity, ocular surface inflammation and damage, and neurosensory abnormalities play the etiological roles of DED.23 The classification of DED includes aqueous deficient dry eye (ADDE) and evaporative dry eye (EDE). In ADDE, the lacrimal gland secretion is reduced and may result in tear hyperosmolarity. In EDE, excessive evaporation from the exposed tear film results in tear film hyperosmolarity. Tear hyperosmolarity in DED could trigger inflammatory mediators and proteases release from the surface epithelial cells, which leads to goblet cell and epithelial cell loss and damage to the epithelial glycocalyx.24 For diagnosing DED, subjective ocular symptoms were measured by triaging questions and homeostasis was measured by several markers, including TFBUT, tear osmolarity, and ocular surface staining. The OSDI questionnaire with 12 items can quickly assess the symptoms of ocular irritation in DED and how they affect vision-related function in the past week of the patient’s life.17
Karaca et al found OSDI scores were significantly higher, and Schirmer test results were significantly lower in the moderate/severe OSA groups compared to the control group.25 Acar et al noted moderate/severe OSA patients had low Schirmer test results and high scores in OSDI questionnaire.10 On the contrary, Karaca et al reported that Schirmer 1 test and OSDI scores did not differ significantly between AHI ≥ 30 and AHI < 15 groups.26 According to the results of our research, the results with a larger sample size are somewhat different from previous other studies. In our study, we surveyed ocular symptoms with OSDI questionnaires, tear volume with TMH and basal tear secretion with basic Schirmer test. The ocular symptoms measured by OSDI scores showed mild DED, and basal tear secretion measured by basic Schirmer test showed borderline DED for normal control and OSA groups. TMH measurement showed no difference among four groups. Female gender is an important risk factor for DED.24 Our study was performed at a tertiary medical center, subjects of male gender predominated in OSA groups and female gender predominated in the normal control group. Female predominance may cause a higher probability of DED in the normal group and lead to no significant difference in basic Schirmer test, OSDI scores, and TMH among the four groups.
TFBUT is a standard and widely accepted assessment for tear film stability. A value less than 10 seconds is usually considered as tear film instability. In our study, TFBUT was assessed non-invasively, objectively and automatically by NIKBUT software. The F-NIKBUT and A-NIKBUT were significantly decreased in moderate and severe OSA groups. Mucin layer is mainly secreted by conjunctival goblet cells and the stratified squamous cells of the conjunctival and corneal epithelia, and it changes the corneal epithelium from a hydrophobic to hydrophilic surface. Both mucin layer and lipid layers are responsible for maintaining tear film stability. Conjunctival goblet cells reduction and Meibomian gland dysfunction lead to mucin deficiency and lipid layer abnormalities, which further result in tear film instability. We assume that eyelid laxity in OSA patients could cause poor apposition of upper eyelid to the globe and induce uneven distribution of tear film over the ocular surface. Besides, OSA patients that sleep on side for avoiding snoring and decreasing upper airway obstruction may induce mechanical injury of ocular surface and subsequently result in tear film instability.
Karaca et al reported that loss of Meibomian glands and alterations of Meibomian gland ducts were significant in severe OSA patients.26 Morsy et al reported that OSA patients were at a greater risk of conjunctival hyperemia (OR = 3.77, 95% CI: 1.02–13.95) when compared to control subjects.27 In the present study, we first objectively assessed conjunctival redness with R-scan and found higher scores over bulbar and limbal areas in the severe OSA group than in the control group. The dilation of temporal bulbar vessels with higher redness score due to mechanical stimulation, and the dilation of temporal limbal vessels with higher redness score due to tissue hypoxia were more commonly seen in the moderate/severe OSA patients than in the normal/mild OSA group.
Acar et al found as the severity of OSA increased, the degree of corneal staining increased and Schirmer test data decreased.10 On the contrary, Mojon et al found OSA patients had significantly reduced TFBUT, but ocular symptoms and corneal involvement were rare among patients with OSA.28 Karaca et al also showed the mean Oxford scale scores did not differ significantly among normal, mild OSA and severe OSA groups.26 In the present study, we did not find differences for the CCT and endothelial density among the four groups. No keratoconus was found in our participants. Corneal staining also did not show significant difference among the four groups. As the corneal staining scores negatively correlated with TMH (r = −0.1766, p = 0.0279) in OSA patients, we assumed that OSA patients with low TMH may be associated with high corneal staining. Because there was no difference in TMH among normal and OSA groups, corneal staining scores did not show a difference in our study.
Previous studies evaluated the association between subjective and objective parameters for the assessment of DED and showed a significant negative correlation between OSDI and tear film thickness. However, no association was found between OSDI and the other evaluated signs (TFBUT and Schirmer test). In our study, we did not find significant correlations between OSDI and other parameters (TMH, NIKBUT, basic Schirmer test, and conjunctival red scores) in OSA patients. The OSDI has some limitations in clinical practice. It includes some dry eye symptoms such as grittiness, sensitivity to light, and pain; however, it does not include other symptoms such as foreign body sensation, itchiness, burning, and tearing. Besides, OSDI only investigates the effects of DED on vision-related functioning. It may not catch the entire effect of DED on a patient’s daily life.
Regarding the correlations between OSA severity and ophthalmologic parameters, we found that AHI negatively correlated with F-NIKBUT and A-NIKBUT, and positively correlated with nasal bulbar redness, temporal bulbar redness, nasal limbal redness, and temporal limbal redness. ODI also negatively correlated with F-NIKBUT and A-NIKBUT. Besides, LSaO2 positively correlated with F-NIKBUT and A-NIKBUT. The alterations of tear film and ocular surface assessed objectively showed that the F-NIKBUT, A-NIKBUT, conjunctival hyperemia correlated with the severity of OSA in the present study.
One of the major limitations of this study is that the sample size was still small, particularly with regard to the subgroups of OSA patients. Because the study was performed at a tertiary medical center, a greater proportion of patients with severe OSA were included than other severities. Besides, participants of male gender predominated in the OSA group, likely due to the fact that OSA is more common among males than females. Further studies for age-matched and gender-matched subgroups with different severities of OSA may be needed. In addition, basic Schirmer test (with anesthesia) measures basal tear secretion and Schirmer test (without anesthesia) measures basal and reflex tear secretion. In the present study, several measurements of ocular surface and tear film were performed that may have some effect on reflex tear secretion. Thus, we performed basic Schirmer test to evaluate basal tear secretion in OSA patients. Moreover, the TMH measurement in the present study may be affected by intra-observer difference. As the TMH was determined by calculating three recordings for the mean value, we assumed that the difference was minimal. However, we measured the NIKBUT by a single capture because the NIKBUT software automatically and objectively detected the tear film, so there could be little intra-observer difference. Besides, we did not perform meibography in the present study. Meibomian gland dysfunction can induce lipid layer abnormality and tear film instability, which may further result in EDE and ocular surface inflammation. We found temporal conjunctival hyperemia in patients with moderate/severe OSA. Further investigation of Meibomian gland morphology with meibography is necessary to justify the relationship between Meibomian gland alterations and severity of OSA. This cohort study investigated the alterations of ocular surface and tear film in OSA patients, and a significant correlation between increasing AHI and decreasing NIKBUT was found. If the hypoxia causes ocular surface inflammation and damage, longer duration and greater severity of OSA will result in greater changes of ocular surface. Longitudinal evaluations of ocular surface change and tear film performance, including Meibomian gland dysfunction and tear osmolarity, can be necessary in patients with OSA. Furthermore, we only evaluated the changes of ocular surface and tear film changes in the “untreated” OSA patients in the present study, especially with different disease severities. Treatments for OSA might have some effects on the ocular surface. However, all of our enrolled patients did not receive CPAP, oral appliance nor surgical treatment for OSA. Further studies with long-term follow-up and larger patient numbers before and after treatments would be required to adequately answer these questions.
Conclusions
Significant alterations of ocular surface and tear film in patients with untreated OSA were demonstrated in the present study. OSA patients had higher occurrence of FES, and the F-NIKBUT and A-NIKBUT were significantly shorter, and the temporal conjunctival redness scores over bulbar and limbal areas were significantly higher in the moderate/severe OSA group than in the normal/mild OSA group. NIKBUT and conjunctival hyperemia are significantly correlated with the severity of untreated OSA.
Data Sharing Statement
The data underlying this manuscript will be shared on reasonable request to the corresponding authors.
Ethics Approval and Consent to Participate
This study was approved by the Institutional Review Board and Ethics Committee of the Chang Gung Memorial Hospital, Taiwan (CGMH IRB: 201900149B0). All patients signed informed consent to participate in the study.
Acknowledgments
The authors thank the research grant from Kaohsiung Chang Gung Memorial Hospital (CMRPG8J0501), Kaohsiung, Taiwan, and the Biostatistics Center, Kaohsiung Chang Gung Memorial Hospital for the assistance of statistical analysis.
Author Contributions
All authors made a significant contribution to the work reported, whether that is in the conception, study design, execution, acquisition of data, analysis and interpretation, or in all these areas; took part in drafting, revising or critically reviewing the article; gave final approval of the version to be published; have agreed on the journal to which the article has been submitted; and agree to be accountable for all aspects of the work.
Funding
This study was sponsored by the grant from the Chang Gung Memorial Hospital (CMRPG8J0501), Kaohsiung, Taiwan.
Disclosure
Hsin-Ching Lin received two research grants from Intuitive Surgical Inc., Sunnyvale, CA. However, Intuitive Surgical Inc. had no role in the design or conduct of this study; collection, management, analysis, or interpretation of the data; preparation, review, or approval of the manuscript; or decision to submit the manuscript for publication. Pei-Wen Lin, Chun-Tuan Chang, Michael Friedman, Anna M. Salapatas, Meng-Chih Lin and Chih-Yun Li declare no potential conflict of interest.
References
1. Young T, Palta M, Dempsey J, et al. The occurrence of sleep-disordered breathing among middle-aged adults. N Engl J Med. 1993;328(17):1230–1235. doi:10.1056/NEJM199304293281704
2. Phillips CL, Cistulli PA. Obstructive sleep apnea and hypertension: epidemiology, mechanisms and treatment effects. Minerva Med. 2006;97(4):299–312.
3. Wolf J, Lewicka J, Narkiewicz K. Obstructive sleep apnea: an update on mechanisms and cardiovascular consequences. Nutr Metab Cardiovasc Dis. 2007;17(3):233–240. doi:10.1016/j.numecd.2006.12.005
4. Lyons OD, Ryan CM. Sleep apnea and stroke. Can J Cardiol. 2015;31(7):918–927.
5. Waller EA, Bendel RE, Kaplan J. Sleep disorders and the eye. Mayo Clin Proc. 2008;83(11):1251–1261. doi:10.4065/83.11.1251
6. McNab AA. The eye and sleep apnea. Sleep Med Rev. 2007;11(4):269–276. doi:10.1016/j.smrv.2007.03.006
7. Acar M, Firat H, Yuceege M, et al. The presence of conjunctivochalasis in obstructive sleep apnea patients. Eye Contact Lens. 2018;44(Suppl 1):S163–S166.
8. Culbertson WW, Tseng SC. Corneal disorders in floppy eyelid syndrome. Cornea. 1994;13(1):33–42. doi:10.1097/00003226-199401000-00007
9. Gupta PK, Stinnett SS, Carlson AN. Prevalence of sleep apnea in patients with keratoconus. Cornea. 2012;31(6):595–599. doi:10.1097/ICO.0b013e31823f8acd
10. Acar M, Firat H, Acar U, et al. Ocular surface assessment in patients with obstructive sleep apnea-hypopnea syndrome. Sleep Breath. 2013;17(2):583–588. doi:10.1007/s11325-012-0724-0
11. Matossian C, Song X, Chopra I, Sainski-Nguyen A, Ogundele A. The prevalence and incidence of dry eye disease among patients using continuous positive airway pressure or other nasal mask therapy devices to treat sleep apnea. Clin Ophthalmol. 2020;14(10):3371–3379. doi:10.2147/OPTH.S274949
12. Kadyan A, Asghar J, Dowson L, Sandramouli S. Ocular findings in sleep apnoea patients using continuous positive airway pressure. Eye. 2010;24(5):843–850.
13. Acar M, Firat H, Yuceege M, Ardic S. Long-term effects of PAP on ocular surface in obstructive sleep apnea syndrome. Can J Ophthalmol. 2014;49(2):217–221. doi:10.1016/j.jcjo.2013.11.010
14. Lin PW, Friedman M, Lin HC, et al. Normal tension glaucoma in patients with obstructive sleep apnea/hypopnea syndrome. J Glaucoma. 2011;20(9):553–558. doi:10.1097/IJG.0b013e3181f3eb81
15. Lin PW, Friedman M, Lin HC, et al. Decreased retinal nerve fiber layer thickness in patients with obstructive sleep apnea/hypopnea syndrome. Graefes Arch Clin Exp Ophthalmol. 2011;249(4):585–593. doi:10.1007/s00417-010-1544-1
16. American Academy of Sleep Medicine. Sleep-related breathing disorders in adults: recommendations for syndrome definition and measurement techniques in clinical research. The report of an American Academy of Sleep Medicine task force. Sleep. 1999;22(5):667–689. doi:10.1093/sleep/22.5.667
17. Schiffman RM, Christianson MD, Jacobsen G, et al. Reliability and validity of the ocular surface disease index. Arch Ophthalmol. 2000;118(5):615–621. doi:10.1001/archopht.118.5.615
18. Bron AJ, Evans VE, Smith JA. Grading of corneal and conjunctival staining in the context of other dry eye tests. Cornea. 2003;22(7):640–650.
19. Culbertson WW, Ostler HB. The floppy eyelid syndrome. Am J Ophthalmol. 1981;92(4):568–575. doi:10.1016/0002-9394(81)90652-8
20. Chambe J, Laib S, Hubbard J, et al. Floppy eyelid syndrome is associated with obstructive sleep apnoea: a prospective study on 127 patients. J Sleep Res. 2012;21(3):308–315. doi:10.1111/j.1365-2869.2011.00968.x
21. Netland PA, Sugrue SP, Albert DM, et al. Histopathologic features of floppy eyelid syndrome. Involvement of tarsal elastin. Ophthalmology. 1994;101(1):174–181. doi:10.1016/S0161-6420(94)31368-6
22. Schlötzer-Schrehardt U, Stojkovic M, Hofmann-Rummelt C, et al. The pathogenesis of floppy eyelid syndrome: involvement of matrix metalloproteinases in elastic fiber degradation. Ophthalmology. 2005;112(4):694–704. doi:10.1016/j.ophtha.2004.11.031
23. Craig JP, Nichols KK, Akpek EK, et al. TFOS DEWS II definition and classification report. Ocul Surf. 2017;15(3):276–283. doi:10.1016/j.jtos.2017.05.008
24. Craig JP, Nelson JD, Azar DT, et al. TFOS DEWS II report executive summary. Ocul Surf. 2017;15(4):802–812. doi:10.1016/j.jtos.2017.08.003
25. Karaca EE, Akçam HT, Uzun F, et al. Evaluation of ocular surface health in patients with obstructive sleep apnea syndrome. Turk J Ophthalmol. 2016;46(3):104–108. doi:10.4274/tjo.57778
26. Karaca I, Yagci A, Palamar M, et al. Ocular surface assessment and morphological alterations in meibomian glands with meibography in obstructive sleep apnea syndrome. Ocul Surf. 2019;17(4):771–776.
27. Morsy NE, Amani BE, Magda AA, et al. Prevalence and predictors of ocular complications in obstructive sleep apnea patients: a cross-sectional case-control study. Open Respir Med J. 2019;13:19–30. doi:10.2174/1874306401913010019
28. Mojon DS, Goldblum D, Fleischhauer J, et al. Eyelid, conjunctival, and corneal findings in sleep apnea syndrome. Ophthalmology. 1999;106(6):1182–1185. doi:10.1016/S0161-6420(99)90256-7
 © 2022 The Author(s). This work is published and licensed by Dove Medical Press Limited. The
full terms of this license are available at https://www.dovepress.com/terms
and incorporate the Creative Commons Attribution
- Non Commercial (unported, 3.0) License.
By accessing the work you hereby accept the Terms. Non-commercial uses of the work are permitted
without any further permission from Dove Medical Press Limited, provided the work is properly
attributed. For permission for commercial use of this work, please see paragraphs 4.2 and 5 of our Terms.
© 2022 The Author(s). This work is published and licensed by Dove Medical Press Limited. The
full terms of this license are available at https://www.dovepress.com/terms
and incorporate the Creative Commons Attribution
- Non Commercial (unported, 3.0) License.
By accessing the work you hereby accept the Terms. Non-commercial uses of the work are permitted
without any further permission from Dove Medical Press Limited, provided the work is properly
attributed. For permission for commercial use of this work, please see paragraphs 4.2 and 5 of our Terms.