Back to Journals » Clinical, Cosmetic and Investigational Dermatology » Volume 16
Alterations of Autophagy Modify Lipids in Epidermal Keratinocytes
Authors Geng Q, Wei G, Hu Y, Xu J, Song X
Received 27 February 2023
Accepted for publication 9 June 2023
Published 20 June 2023 Volume 2023:16 Pages 1569—1581
DOI https://doi.org/10.2147/CCID.S410252
Checked for plagiarism Yes
Review by Single anonymous peer review
Peer reviewer comments 2
Editor who approved publication: Dr Anne-Claire Fougerousse
Qingwei Geng,1,* Guoqi Wei,2,* Yebei Hu,1 Jinhui Xu,1 Xiuzu Song1
1Department of Dermatology, Hangzhou Third People’s Hospital, Hangzhou, Zhejiang, 310009, People’s Republic of China; 2Hangzhou Fuyang Hospital of Traditional Chinese Medicine, Hangzhou, Zhejiang, 322499, People’s Republic of China
*These authors contributed equally to this work
Correspondence: Xiuzu Song, Department of Dermatology, Hangzhou Third People’s Hospital, Affiliated Hangzhou Dermatology Hospital, Zhejiang University School of Medicine, West Lake Road 38, Hangzhou, 310009, People’s Republic of China, Tel +86-0571-87823102, Email [email protected]
Background: The skin barrier is the first line of defense of the body, while skin lipids play an important role in the skin permeability barrier. Lamellar bodies are also involved in maintaining the stability of the skin permeability barrier. However, the exact origin of lamellar bodies remains unclear. Recent studies have suggested that autophagy may participate in the formation of lamellar bodies.
Aim: This study aimed to investigate the role of autophagy in the formation of lamellar bodies in keratinocytes and the regulation of keratinocyte lipids.
Methods: Keratinocytes were incubated with autophagy inducer Rapamycin and autophagy inhibitor Bafilomycin A1. The changes in autophagy flux were detected by Western blot, and the formation of lamellar bodies was observed by transmission electron microscopy. Furthermore, the changes in keratinocytes lipidomics were detected by liquid chromatography-mass spectrometry.
Results: Our research showed that the autophagy inducer promoted autophagy activation and formation of lamellar bodies in keratinocytes, while the inhibitor inhibited autophagy signals and the formation of lamellar bodies in keratinocytes. In addition, the lipidomics results revealed a significant change in glycerophospholipids after autophagy induction and autophagy inhibition.
Conclusion: These results demonstrate that autophagy may play an essential role in skin lipids via glycerophospholipids pathway.
Keywords: skin barrier, lipid, liquid chromatography-mass spectrometry, rapamycin, Bafilomycin A1, keratinocytes
Introduction
The human skin is composed of multiple barriers, among which the skin permeability barrier composed of lipids is one of the most important barrier functions.1 Changes in lipid content, structure and composition affect the skin condition. The lipids can be divided into sebaceous gland lipids or intercellular lipids. Sebaceous gland lipids mainly include squalene, triglycerides, cholesterol and cholesterol esters, while intercellular lipids mainly include ceramide, free fatty acids, cholesterol, etc.2 Lamellar bodies (LBs) in the epidermis are secretory organelles formed during the differentiation of keratinocytes (KCs) in the upper spinous layer and granular layer. It can deliver a variety of contents, including lipid precursors and enzymes related to the permeability barrier and antimicrobial peptides related to the antimicrobial barrier. Loss or dysfunction of LBs can result in a disruption of the skin barrier homeostasis and lead to various skin disorders.1,3,4
Autophagy (generally referred to as macro-autophagy) is a lysosomal-associated cellular self-digestion and degradation pathway present in epidermal KCs and is usually maintained in a relatively stable condition in most tissues.5,6 Lipophagy is a selective form of autophagy that targets a unique neutral lipid storage organelle called lipid droplets (LDs) to regulate abnormalities in lipid storage in the liver, pancreas and adipose tissues. When hunger leads to nutritional deficiency in the body, the LDs lipids stored in cells are hydrolyzed into fatty acids in the form of triglycerides to produce energy. In addition, starvation also causes a cellular response - inducing autophagy.7–9 Mammalian target of Rapamycin (mTOR), microtubule-associated protein 1 light chain 3 (LC3), autophagy-related protein Sequestosome (SQSTM1, p62) are the three most important marker proteins in autophagy.
Lipids regulate cell growth, differentiation and death, participate in the metabolic process in vivo, and affect the occurrence and development of various diseases.10 Lipid balance is essential for healthy skin. However, our knowledge of lipid channels and functions is still far behind that of genes and proteins due to the diversity and complexity of lipid molecular structure as well as the limitations of detection and analysis techniques. Lipidomics can comprehensively analyze lipids and their metabolites. In our study, the lipid changes in KCs after promoting and inhibiting autophagy were detected for the first time.
Materials and Methods
Cell Culture and Treatments
The immortalized human keratinocyte cell line HaCaT cell from the Institute of Cell (Shanghai, China) was cultured in DMEM (Gibco, America) supplemented with 10% fetal calf serum (Life Technologies, America), 1% penicillin and 1% streptomycin at standard conditions (37°C, 5% CO2, in a humidified atmosphere). Additionally, Normal Human Epidermal Keratinocytes (NHEKs), purchased from PromoCell (Heidelberg, Germany, C-12003), were cultured in the company’s supporting medium. 1×10⁵ cells/well were seeded onto six-well plates. The cells were left untreated or treated with 50nM Rapamycin (Abcam, UK) for both HaCaT cells and NHEKs, or 100nM Bafilomycin A1 (Abcam, UK) for HaCaT cells and 50nM for NHEKs. The cells were then collected according to the indicated period.
Western Blot Analysis
The cultured HaCaT cells were washed twice with phosphate-buffered saline (PBS) and then lysed with lysis buffer. The equivalent protein samples were separated by 12% SDS-PAGE and then transferred from the gel to a nitrocellulose membrane. After blocking with 5% non-fat dry milk, the membrane was washed and incubated with primary antibodies (rabbit monoclonal anti-mTOR, mouse polyclonal anti-LC3, mouse monoclonal anti-p62, rabbit monoclonal anti-Rab11a, or mouse polyclonal anti-β-Actin; Abcam, UK) overnight at 4°C. Subsequently, the membranes were washed and incubated with secondary antibodies (anti-rabbit IgG or anti-mouse IgG; Sigma, American) for 2h at room temperature. After being washed again, the membranes were placed on an ODYSSEY dual-color infrared laser imaging system (LICOR, America). The grayscale value was analyzed, and the ratio of the target protein to β-Actin was calculated.
Transmission Electron Microscopy
HaCaT cells were centrifuged and collected after treatments, washed with PBS and fixed in 2.5% glutaraldehyde at 4°C for 24h. Then the cells were washed with PBS again and fixed in 1% osmium acid solution for 2h, dehydrated with ethanol and embedded in Spurr’s plastic resin. The ultrastructure of the cells was observed by a Hitachi H-7650 transmission electron microscope in the Bio-ultrastructure Analysis Laboratory of Analysis center of Agrobiology and Environmental Sciences (Zhejiang University, China). The expression of LBs was quantified by cytoplasmic regions (excluding the nucleus). Referring to the reports of Hariri et al and Lajoie et al, LBs was defined as membrane-bound cytoplasmic organelles that present at least three distinct circumferential concentric membrane lamellae.11,12
Cell Absolute Quantitative Lipidomics
NHEKs were treated with 50nM rapamycin and 50nM bafilomycin. The cells were collected, and the lipid components of the cells were detected by liquid chromatography-tandem mass spectrometry. A non-targeted lipidomics analysis platform based on the UPLC-Orbitrap mass spectrometry system was used in combination with LipidSearch software (Thermo Scientific™). The internal isotope standards of 13 lipid molecules were used for lipid identification and data preprocessing.
Statistical Analysis
Statistical analysis was performed using SPSS 21.0. The data were expressed as the mean ± standard deviation (SD). Multiple independent samples were compared using Levene’s test for homogeneity of variance; if variances were equal, a one-way analysis of variance was used for comparison, followed by the LSD-t-test; if not, the Kruskal–Wallis H rank sum test was used, followed by Mann–Whitney U-test. In this study, P<0.05 was considered statistically significant.
Results
Autophagy Inducer Rapamycin Promoted Autophagy Activation and Formation of LBs in HaCaT Cells
As shown in Figure 1, autophagy is a continuous dynamic process that begins with the discrete phagophores and gradually forms autolysosomes.5 The autophagic flux is an important index to judge the dynamic changes of autophagy.13 Rapamycin, an autophagy inducer, promotes autophagy by inhibiting mTOR, which is the central molecule of the autophagic upstream signal.14 First, the changes of key autophagic biomarkers after Rapamycin treatment were examined by Western blot. Compared with the control group, 0h, a significant decrease in mTOR expression at 12h and 24h was observed, while the conversion of LC3-I to LC3-II and the expression of LC3-II and p62 were significantly increased. The results suggested the activation of the autophagic flux, resulting in a compensatory increase in the number of autophagosomes and amphisomes. At 48h, compared with the control group, the mTOR signal was still suppressed, and the conversion of LC3-I to LC3-II remained high. Nevertheless, the increase in LC3-II and P62 levels was not statistically significant, indicating that the autophagic flux was over-activated and the number of autophagosomes and amphisomes decreased relative to the previous stage (Figure 2a and b).
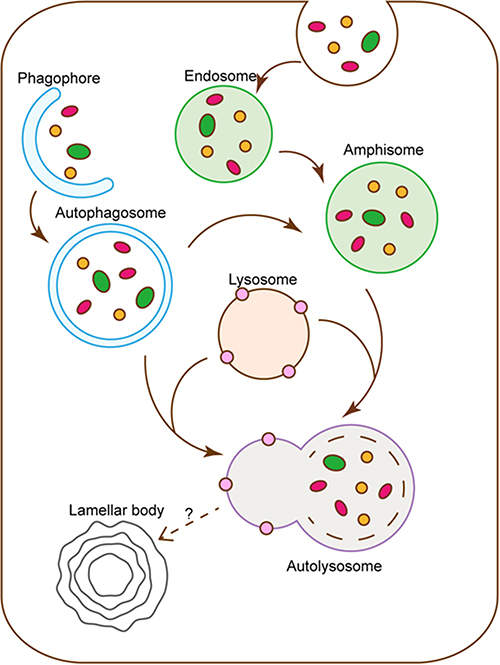 |
Figure 1 Flow chart of autophagy and lamellar body formation. Autophagy begins with the disperse membrane-like structure, also known as phagophore, which expands to form a bowl-shaped substance and eventually forms a vesicle-like structure with a complete bilayer membrane wrapped by continuous extension and fusion. Next, autophagosomes or amphisomes which derived from endosome fuse with lysosome to form autolysosome. |
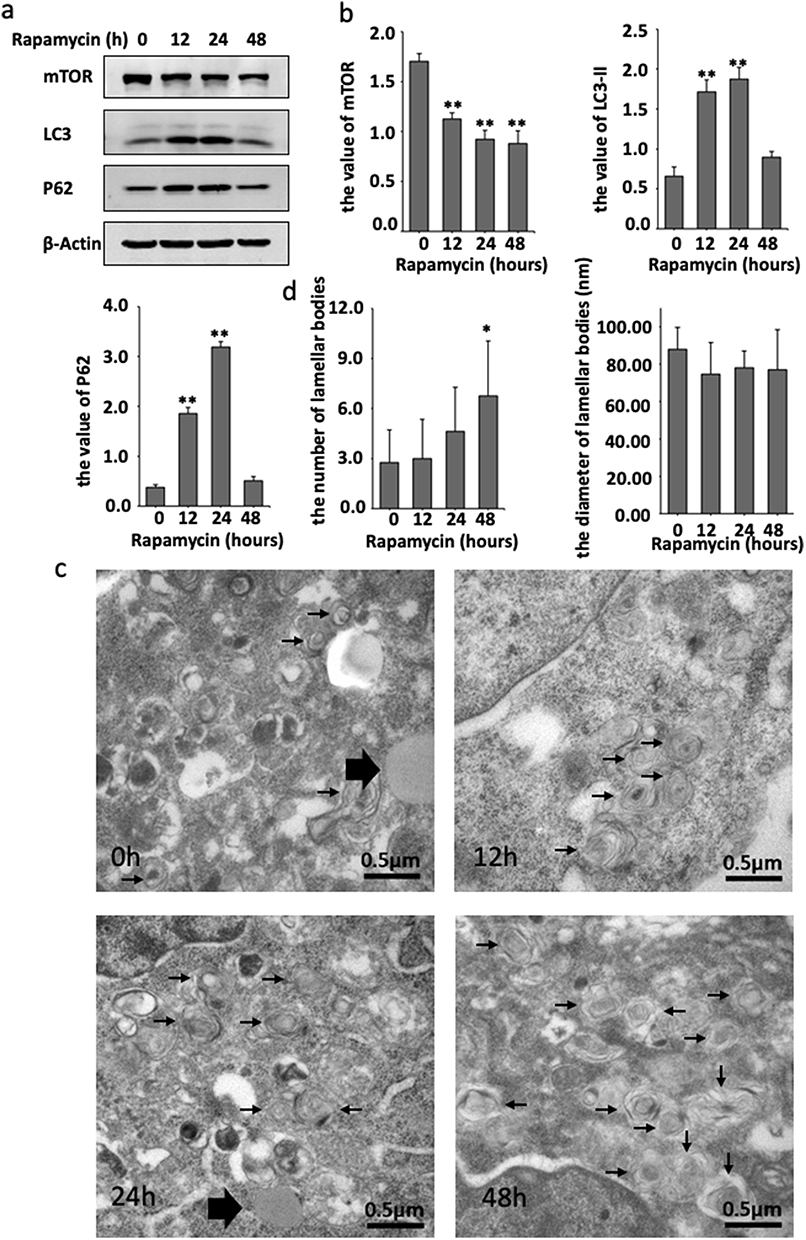 |
Figure 2 Rapamycin promoted autophagy activation and formation of LBs in HaCaT cell. (a) Western blot detection of autophagy related protein mTOR, LC3 and P62 from cultured HaCaT cell treated with 50nM rapamycin at 0h, 12h, 24h, 48h. (b) After the treatment of rapamycin, the value of mTOR, LC3-II and P62. (c) LBs (black small arrows) observed under transmission electron microscope after the treatment of rapamycin. Uniform density lipid droplets (large black arrows) can be found around LBs. (d) After the treatment of rapamycin, the number of LBs at 48h were significantly higher than 0h, and diameter of LBs has no significant change. *P<0.05, **P<0.01. |
Subsequently, the ultrastructure of the HaCaT cells cytoplasmic area after treatment with Rapamycin was observed using transmission electron microscopy (TEM), which is the best way to observe LBs. The LBs displayed a concentric multilamellar structure, the station of several LBs had gathered, and round gray lipid droplets of uniform density had accumulated around the LBs. Moreover, the peak number of LBs was reached after 48h of Rapamycin exposure. Next, the diameter of LBs was analyzed using Image-Pro Plus (IPP), revealing no significant difference among the four periods (Figure 2c and d).
Lipidomics Profiling Reveals the Variety of Lipids After Rapamycin Treatment in NHEKs
In order analyze the changes in lipid composition of KCs after rapamycin treatment, we collected KCs after 48 hours of treatment for lipidomics analysis. In the study, we purpose to closely observe the lipid expression of epidermal keratinocytes regulated by autophagy, we used NHEKs for lipidomics detection. The results showed that a total of 28 lipid classes and 728 lipid species were detected (Figure 3a and b). Although the content of triglyceride(TG) and diglyceride(DG) in glycerolipids are the highest among all lipids in two groups, there was no significant difference between the groups. The phosphatidylethanolamine(PE), phosphatidylinositol(PI) in glycerophospholipids were significantly higher in the control group than in the Rapamycin treatment (P < 0.05) (Figure 3b). Due to significant differences between the test group and the control group, OPLS-DA was used to select the important single lipid species in these subclasses (Figure 3c). After OPLS-DA analysis, significant differences were found between the rapamycin-treated group and the blank control group in 38 lipid molecules (VIP > 1, P < 0.05) (Table 1). From the table, the three lipid molecules with the largest differences were TG(15:0_15:0_20:1)+NH4, PE(16:1_16:1)-H, and PI(32:0)-H. However, only TG(15:0_15:0_20:1)+NH4 exhibited higher levels than the control group following Rapamycin treatment, while the other lipids showed lower levels. The clustering heatmaps of two sets of samples are shown in Figure 3d. Heat map and network diagram of 38 lipid molecules were showed in Figure 3e and f.
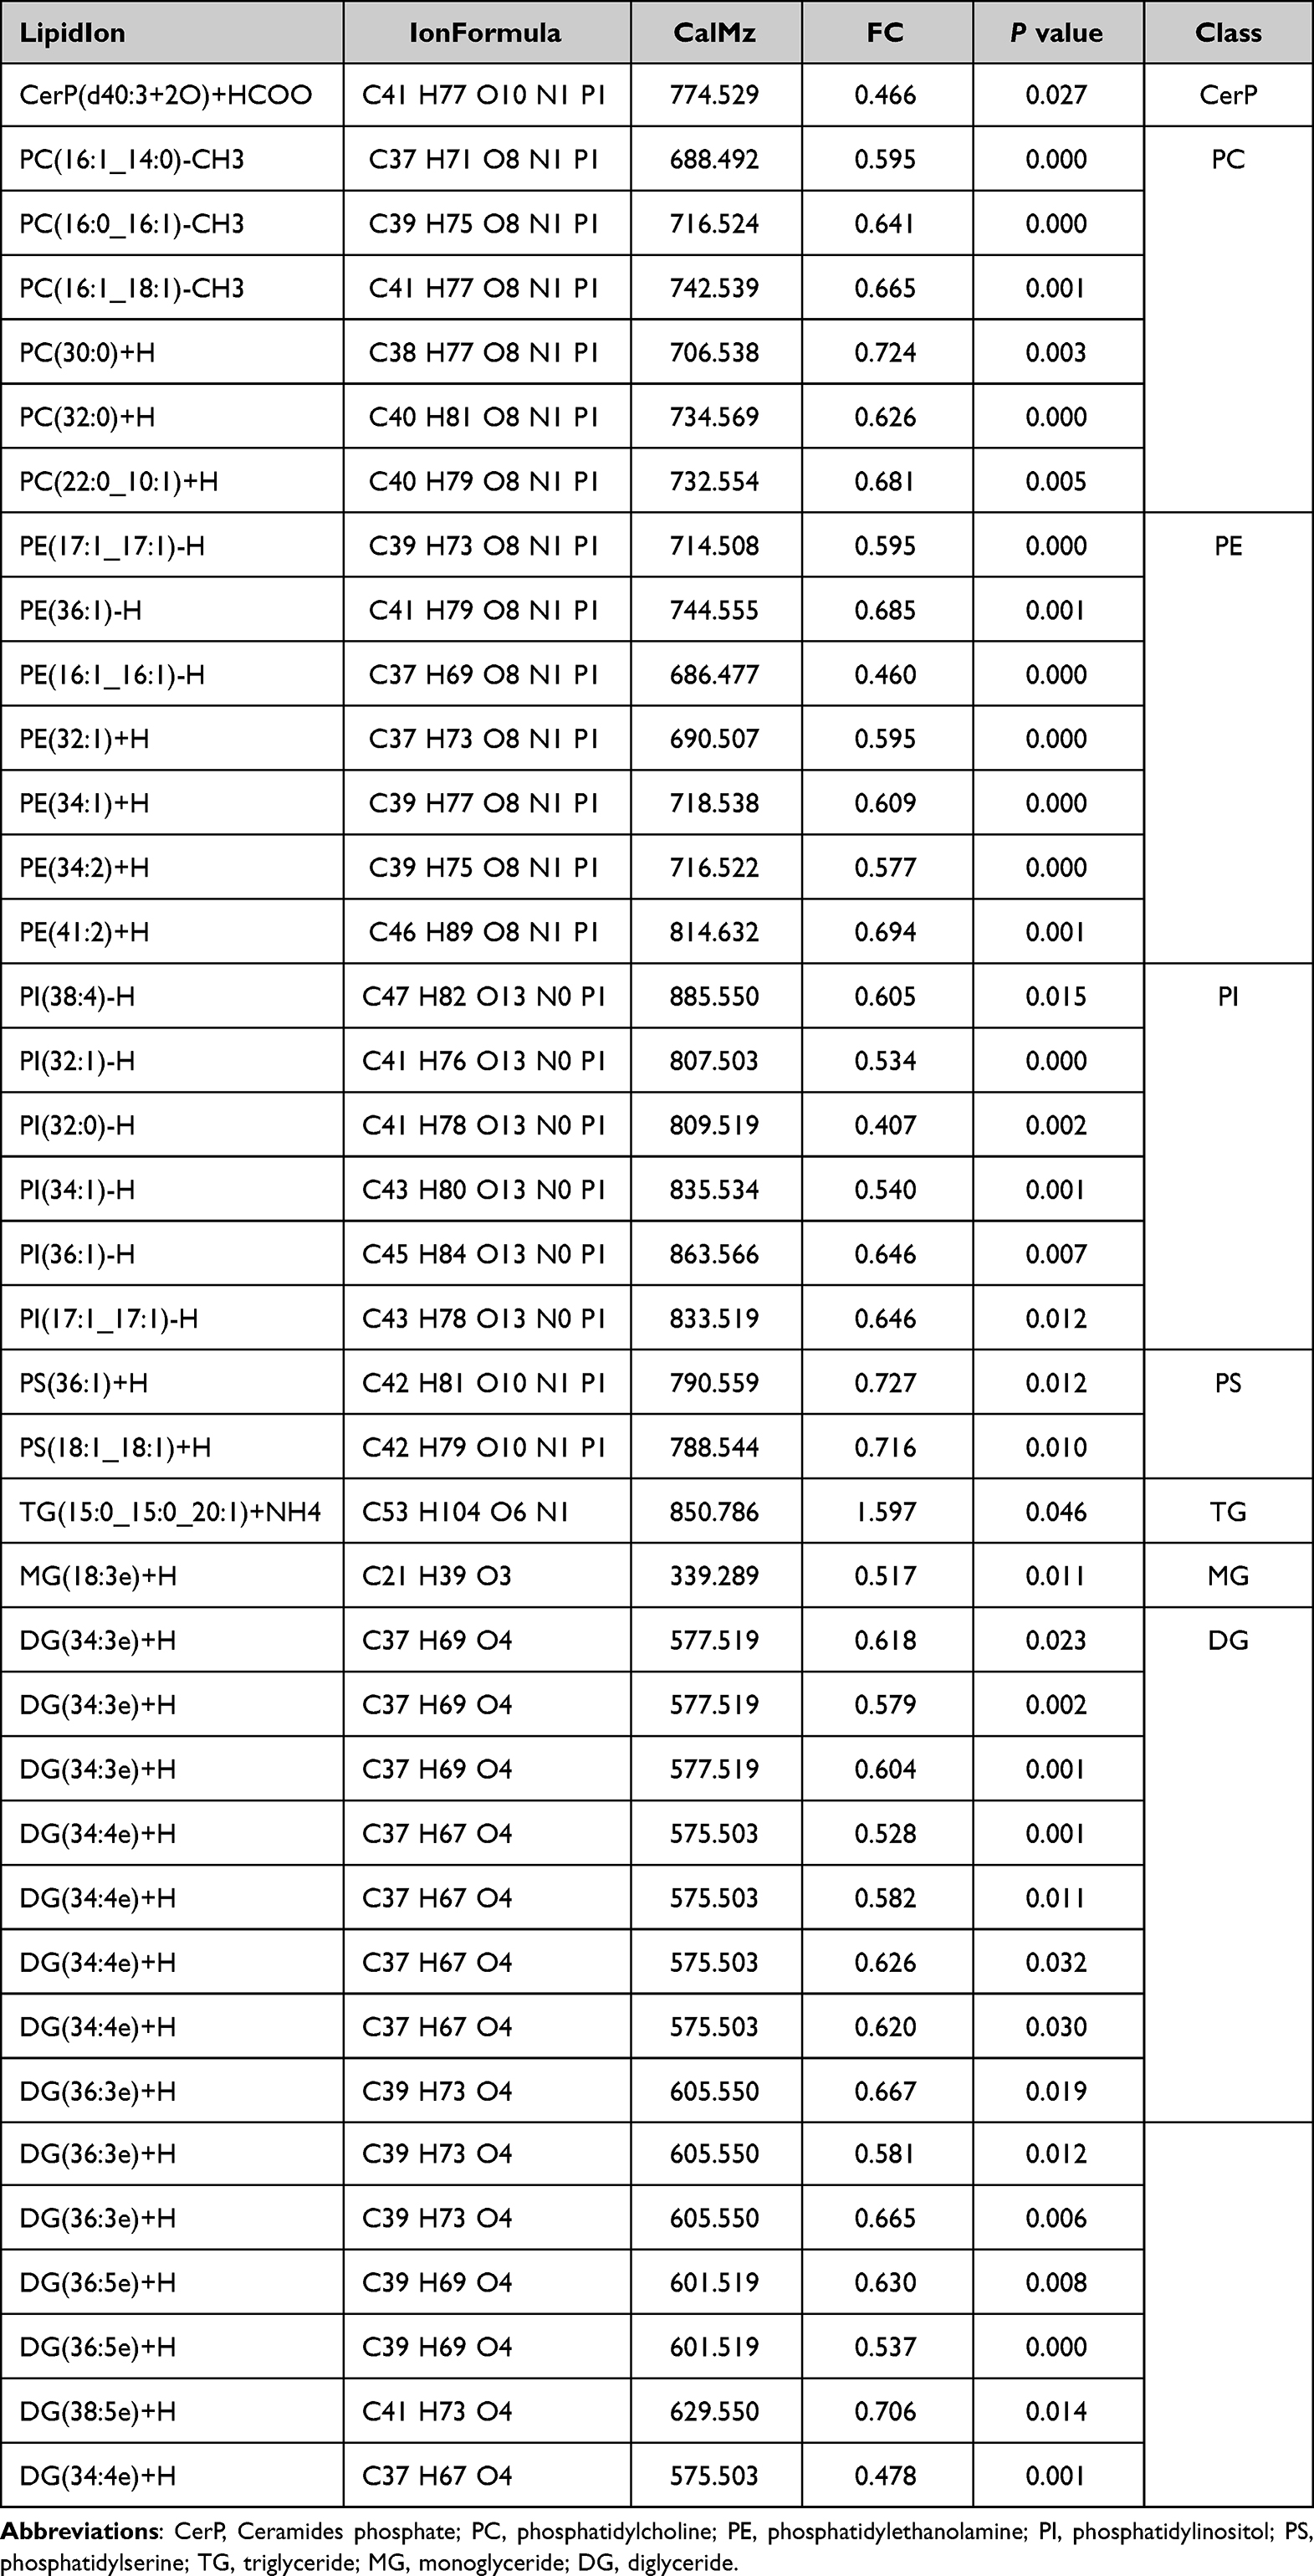 |
Table 1 Information Table of Different Lipid Metabolites in the Rapamycin Group and Control Group |
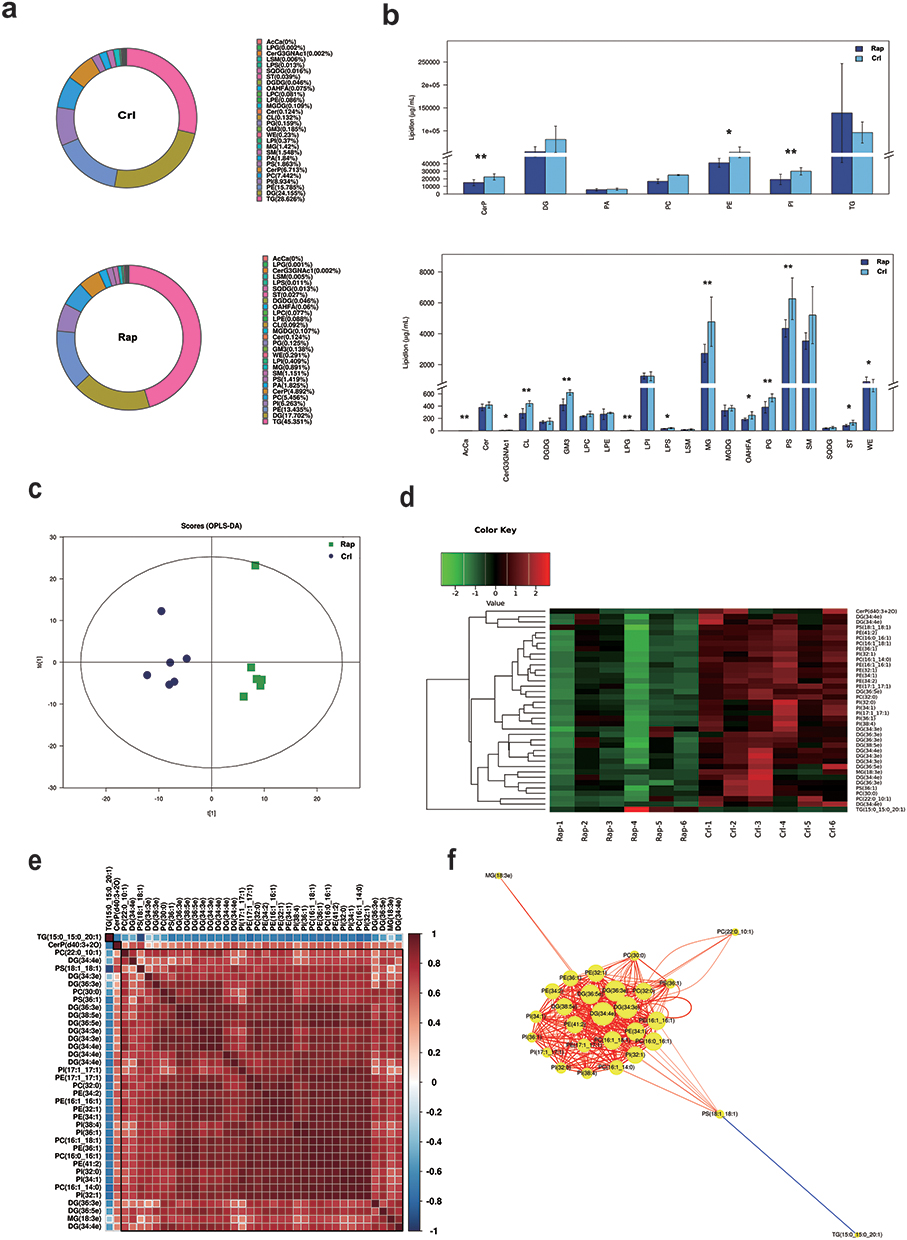 |
Figure 3 The multivariate data analysis and statistical analysis of lipids keratinocytes after the Rapamycin treatment. (a) Composition diagram of lipid subclasses in blank control group (Crl) and rapamycin treatment group (Rap). The proportion of each lipid subclass is expressed by the size of the color block area, and the specific percentage value is shown in the legend on the right side of the figure. (b) Histogram of lipid subclass content in blank control group (Crl) and rapamycin treatment group (Rap). *P<0.05, **P<0.01. (c) OPLS-DA score map of blank control group (Crl) and rapamycin group (Rap). (d) Heat map of 38 lipid molecules (VIP > 1, P < 0.05). (e) Lipid-lipid correlation matrix of 38 lipid molecules (VIP > 1, P < 0.05). (f) Network diagram of 38 lipid molecules (VIP > 1, P < 0.05). |
Autophagy Inhibitor Bafilomycin A1 Inhibited the Autophagy Signal and the Formation of LBs in HaCaT Cells
As shown in Figure 1, the combination of lysosomes with autophagosomes or amphisomes to form autolysosomes is an essential stage in autophagy. Bafilomycin A1, a general lysosomal inhibitor, blocks the degradation of autophagosomes or amphisomes to form autolysosomes, resulting in the accumulation of LC3-II protein.14 To further assess the role of autophagy degradation on LBs expression, HaCaT cells were also cultured with Bafilomycin A1 and then detected by Western blot. Compared to the absence of Bafilomycin A1, no significant change in mTOR expression was observed, while the expression of LC3 and p62 changed with time. At 12h, 24h and 48h, the conversion of LC3-I to LC3-II decreased, and the expression of LC3-II and p62 increased compared to the control group. These changes were attributed to Bafilomycin A1 blocking the autophagic flux and the degradation of autolysosome (Figure 4a and b).
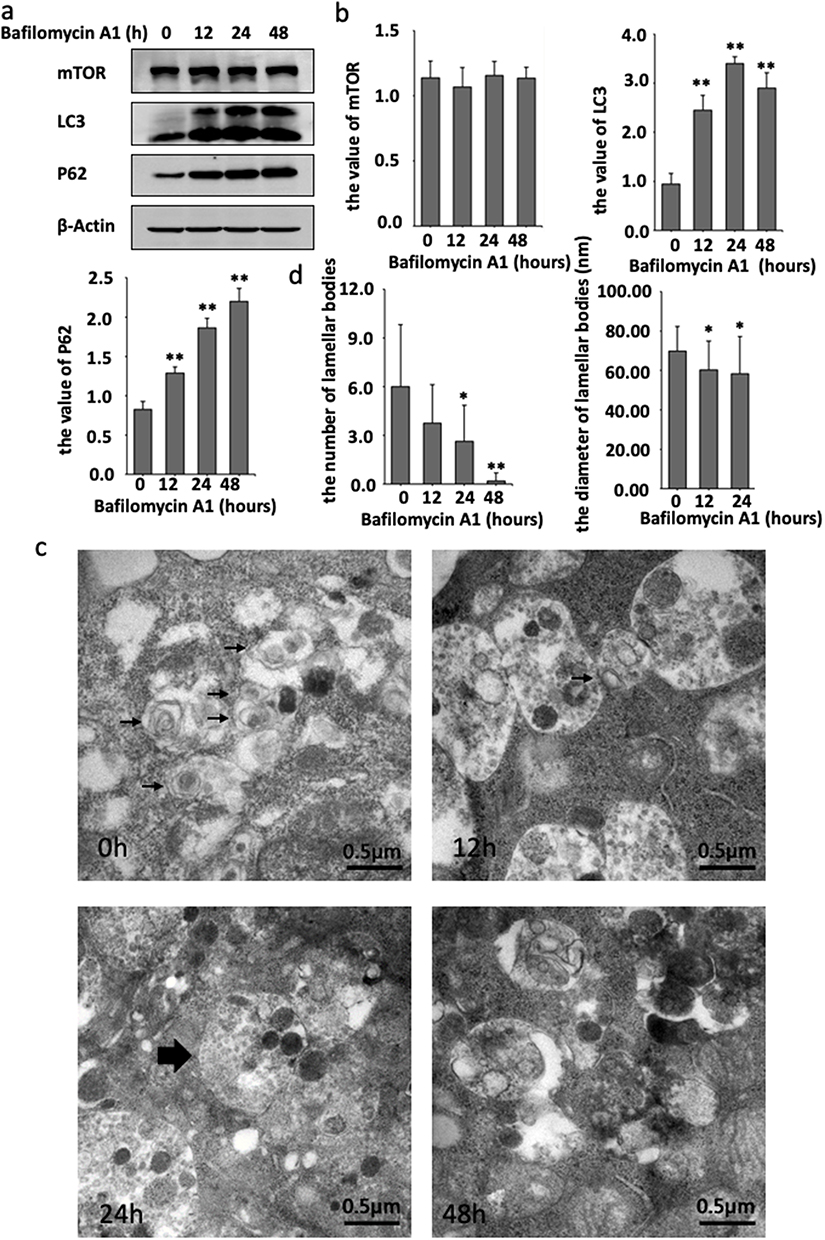 |
Figure 4 Bafilomycin A1 inhibited autophagy signal and the formation of LBs in HaCaT cell. (a) Western blot detection of autophagy related protein mTOR, LC3, P62 and β-actin from cultured HaCaT cell treated with 100nM Bafilomycin A1 at 0h, 12h, 24h, 48h. (b) After the treatment of Bafilomycin A1, the value of mTOR, LC3-II and P62. (c) LBs (black arrows) observed under the transmission electron microscope after the treatment of Bafilomycin A1. A large number of monolayers of amphisomes (largest black arrow) can be found in cells cultured with Bafilomycin A1 for 12h, 24h and 48h. (d) After the treatment of Bafilomycin A1, the number of the number of LBs at 24h and 48h were significantly lower than 0h, especially in 48h, and the diameter of LBs at 12h and 24h were significantly smaller than 0h. (Explanation: because there was only one lamellar body found after the treatment of Bafilomycin A1 with 48h, which was not included in the statistics of the lamellar body diameter.)*P<0.05, **P<0.01. |
Subsequently, the ultrastructural changes of LBs were observed by TEM. Treatment of HaCaT cells with Bafilomycin A1 for 48h induced the accumulation of autophagosomes and amphisomes, with the disappearance of LBs. Besides, the morphology of LBs was abnormal, and the lamellar outline became blurred and significantly decreased compared with the previous Rapamycin-treated group. The number of LBs decreased after 24h (Figure 4c). Furthermore, the LBs exposed to Bafilomycin A1 for 24h were significantly smaller than the untreated control group (Figure 4d).
Lipidomics Profiling Reveals the Variety of Lipids After Bafilomycin A1 Treatment in NHEKs
As with rapamycin treatment, we used NHEKs for detection of more accurately model the altered lipid expression in real epidermal keratinocytes. A total of 28 lipid classes and 728 lipid species were detected by LC-MS (Figure 5a and b). Although the total amount of triglyceride(TG), diglyceride(DG), and phosphatidylethanolamine(PE) was also higher, there was no statistically significant difference between the two groups (Figure 5b). OPLS-DA analysis is shown in Figure 5c. 24 significant differences lipid molecules were observed between the Bafilomycin A1-treated group and the blank control group (VIP > 1, P < 0.05) (Table 2). Among those 24 lipids molecules, the three molecules with the most significant increase were MG(18:3e)+H, PC(10:0_24:1)+Na, and PI(38:3)+NH4 (FC>2.4); while the three with the most significant reduction are WE(2:0_20:2)+NH4, LPC(16:0)+HCOO, LPC(16:0)+H (FC>10.3). The clustering heatmaps of two sets of samples are shown in Figure 5d. Heat map and network diagram of 25 lipid molecules were showed in Figure 5e and f.
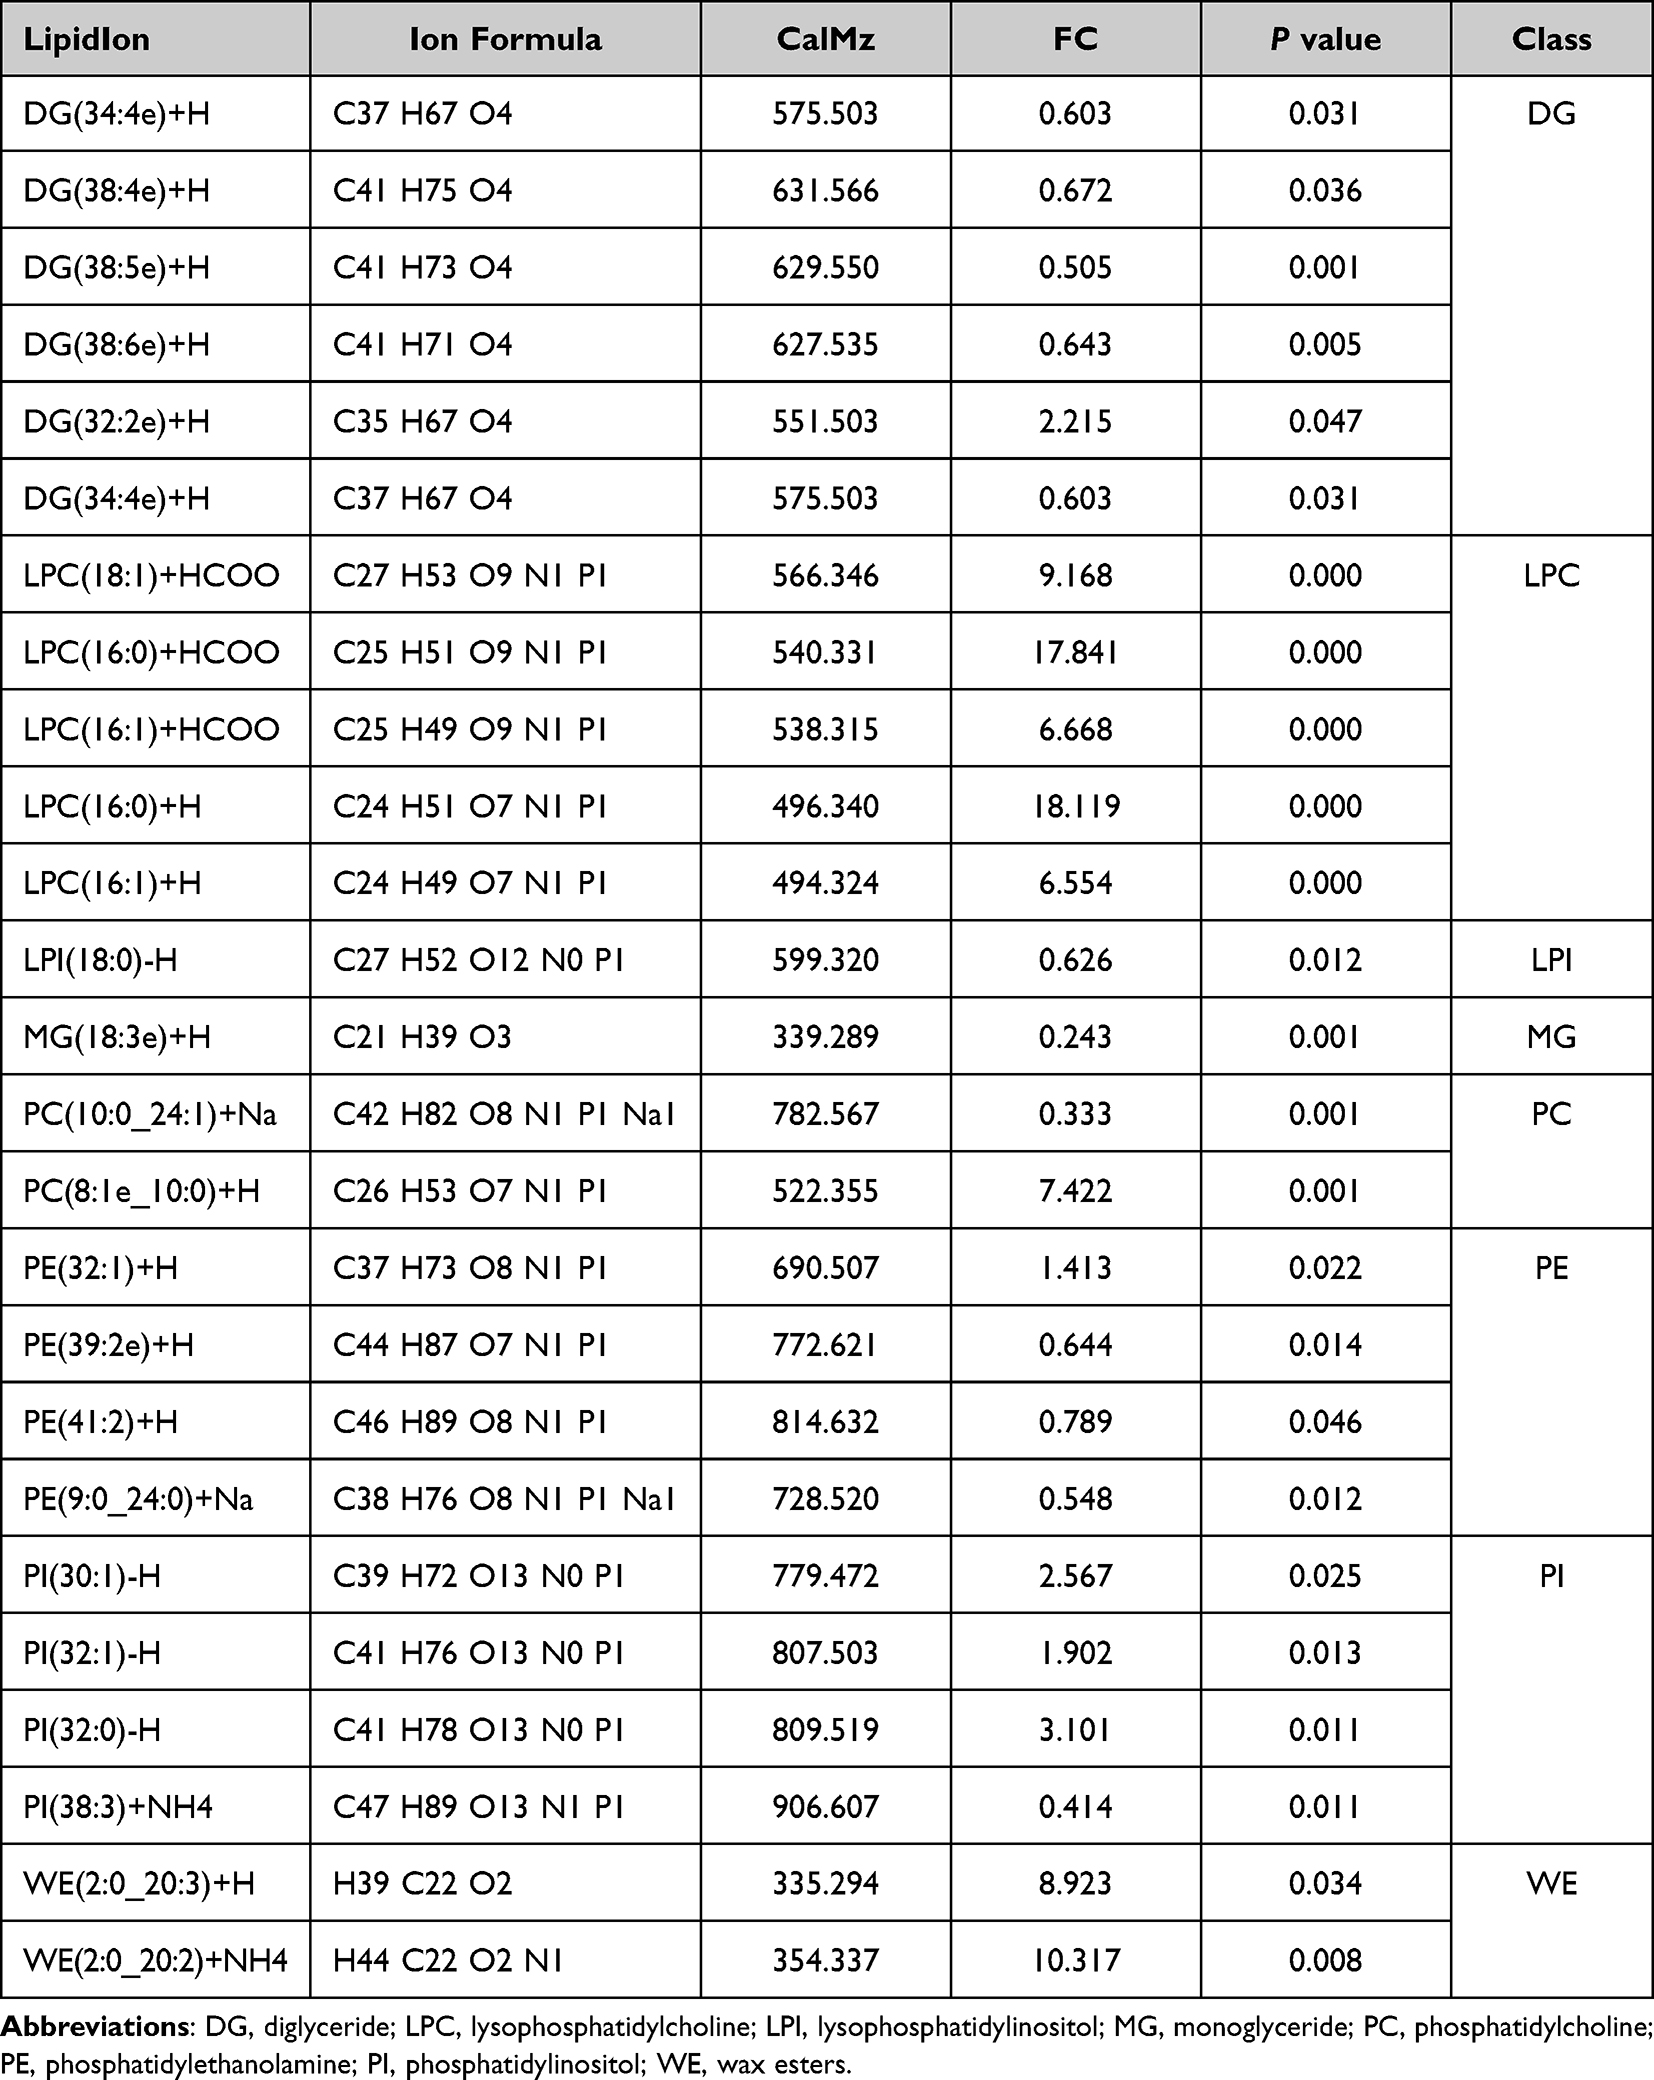 |
Table 2 Information Table of Different Lipid Metabolites in the Bafilomycin A1 Group and Control Group |
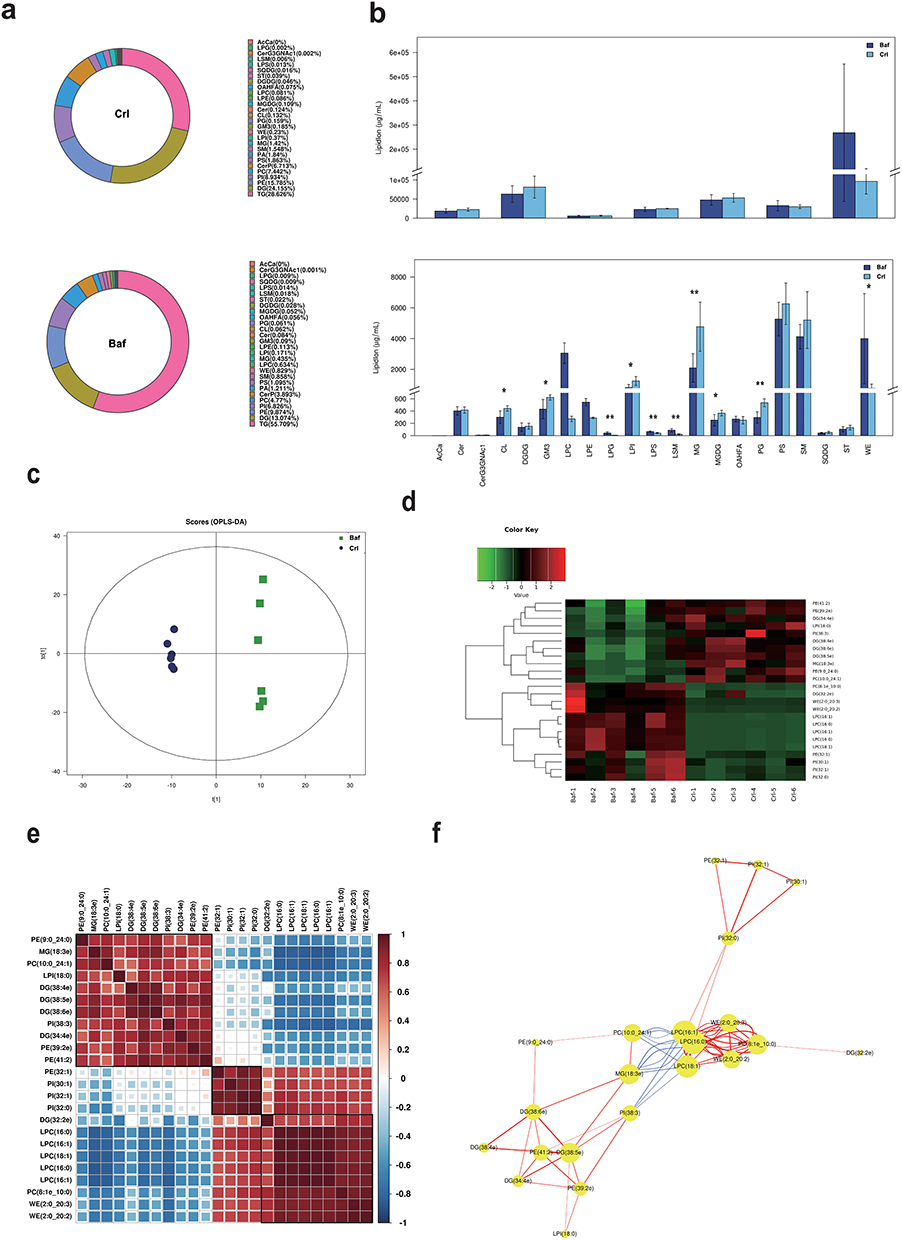 |
Figure 5 The multivariate data analysis and statistical analysis of lipids keratinocytes after the Bafilomycin A1 treatment. (a) Composition diagram of lipid subclasses in blank control group (Crl) and Bafilomycin A1 treatment group (Baf). The proportion of each lipid subclass is expressed by the size of the color block area, and the specific percentage value is shown in the legend on the right side of the figure. (b) Histogram of lipid subclass content in blank control group (Crl) and Bafilomycin A1 treatment group (Baf). *P<0.05, **P<0.01. (c) OPLS-DA score map of blank control group (Crl) and Bafilomycin A1 group (Baf). (d) Heat map of 24 lipid molecules (VIP > 1, P < 0.05). (e) Lipid-lipid correlation matrix of 24 lipid molecules (VIP > 1, P < 0.05). (f) Network diagram of 24 lipid molecules (VIP > 1, P < 0.05). |
Discussion
Autophagy is a cellular self-digestion process involved in the degradation of organelles. A growing number of reports have shown that autophagy participates in epidermal differentiation. Skin lipids play an essential role in the skin barrier, and LBs is considered an important component of lipids in KCs and lipid transport.1 Therefore, we speculated that autophagy is associated with the formation of LBs in the epidermis.
In psoriasis, the epidermal granular layer is thinned or even absent, resulting in impaired skin barrier.6,15,16 The amount and function of LBs in epidermal granular KCs determines the composition and secretion of extracellular lipids and plays an important role in the skin barrier.1 A study found that mTOR, the upstream signal of autophagy, is over-activated in the basal layer of the epidermis. In contrast, the expression of LC3, usually highly expressed in the granular layer of the epidermis, is down-regulated in psoriasis lesions.15 Meanwhile, the expression of p62 was increased.6 Therefore, autophagy may be related to the stability of the skin KCs. In our study, we found that a large number of LC-3-labeled autophagosomes or amphisomes were formed after treatment with Rapamycin, and the number of LBs increased. After 48h, the number of autophagosomes or amphisomes showed a relative decrease, while LBs was the most abundant. The results suggested that LBs might be formed after autolysosome formation. In order to confirm this hypothesis, Bafilomycin A1 was used to block the formation of autolysosomes. After 48h of treatment, autolysosome formation was blocked, and LBs disappeared, which was similar to the results of Burger et al, 2017. Thus, we conjectured this might be the normal metabolism process of LBs.
LBs can secrete extracellular lipid precursors through exocytosis, including phospholipids, glucosylceramide, sphingomyelin and cholesterol, to form lamellar membranes. The lipid precursors are released into the intercellular space between the granular layer and the stratum corneum.1 Studies have shown that lipid metabolism is related to autophagy, and Scarlatti et al showed that sphingolipid ceramide could regulate the autophagy of HT-29 cells.17 Lajoie et al believed that phospholipids were transported to late lysosomes by autophagy to promote the expression of LBs and that LBs were a form of autolysosomes.12 In our study, more LDs were found after treatment with the autophagy inducer Rapamycin, which are considered autophagy-specific organelles for unique neutral lipid storage.7–9 Studies have shown that in the prophase of fatty liver, autophagy mainly relieves steatosis by degrading intracellular LDs, while in the late stage, excessive autophagy activation can also induce cell death and aggravate the disease.18
Lipidomics refers to the comprehensive analysis and identification of lipids and their metabolites, investigating the function and metabolic regulation of lipids to reveal lipid metabolic pathways, networks and their relationship with physiological and pathological processes of the body. This field is of great significance in clinical medicine and life science research and has gained popularity in recent years.10 In general, lipids have three functions: cell membrane components, energy storage and signal molecules. Basically, all polar lipids (such as PC, PE, PI, PS, PA, etc.) are components of the cell membrane. The lipid membrane plays an important role in maintaining cell structure and function. In addition, changes in membrane lipid content and composition affect the permeability of the membrane to small neutral molecules (such as water) and small ions. The composition and function of membrane proteins (such as ion channels), cell communication and the microenvironment of ion distribution in cells are also affected by membrane lipids. In this study, glycerophospholipids in cells changed significantly after autophagy inducer and inhibition treatment, which play an important role in protein recognition and signal transduction in cell membranes. Autophagy may regulate membrane lipids and change the content and composition of intracellular and extracellular lipids. Studies have shown that glycolysis can promote Th17 cell differentiation through the mTOR and HIF signaling pathways.19 Saccharides are important raw materials for the synthesis of glycerophospholipids. Zeng et al collected and analyzed plasma samples from 45 patients with psoriasis and 45 healthy people. LC-MS analysis showed that LPA, lysoPC and PA increased significantly in patients with psoriasis, while PC and PI decreased.19
Conclusion
Skin lipids are an important component of the skin barrier. Although autophagy affects the changes in glycerophospholipids in KCs in our study, the specific mechanism of autophagy on the dynamic changes of skin lipids remains unclear, as autophagy is a dynamic equilibrium process. In addition, whether autophagy causes the dissolution of the lipid components after phagocytosis through LBs needs further study.
Abbreviations
LBs, Lamellar bodies; KCs, keratinocytes; LDs, lipid droplets; NHEKs, Normal Human Epidermal Keratinocytes; mTOR, mammalian target of Rapamycin; LC3, microtubule-associated protein 1 light chain 3; SQSTM1, p62, autophagy-related protein Sequestosome; TEM, transmission electron microscopy.
Acknowledgments
Qingwei Geng and Guoqi Wei are joint first authors and contributed equally to this work.
Funding
This research was funded by National Natural Science Foundation of China (81872517) and Zhejiang Traditional Chinese Medicine Science and Technology Plan Project (2020ZB209).
Disclosure
The authors declare that have no conflicts of interest.
References
1. Feingold KR, Elias PM. Role of lipids in the formation and maintenance of the cutaneous permeability barrier. Biochim Biophys Acta. 2014;1841(3):280–294. doi:10.1016/j.bbalip.2013.11.007
2. Cui L, He CF, Fan LN, Jia Y. Application of lipidomics to reveal differences in facial skin surface lipids between males and females. J Cosmet Dermatol. 2018;17(6):1254–1261. doi:10.1111/jocd.12474
3. den Hollander L, Han H, de Winter M, et al. Skin lamellar bodies are not discrete vesicles but part of a tubuloreticular network. Acta Derm Venereol. 2016;96(3):303–308. doi:10.2340/00015555-2249
4. Elias PM. Stratum corneum defensive functions: an integrated view. J Invest Dermatol. 2005;125(2):183–200. doi:10.1111/j.0022-202X.2005.23668.x
5. Klionsky DJ, Abdel-Aziz AK, Abdelfatah S, et al. Guidelines for the use and interpretation of assays for monitoring autophagy. Autophagy. 2021;17(1):1–382.
6. Akinduro O, Sully K, Patel A, et al. Constitutive autophagy and nucleophagy during epidermal differentiation. J Invest Dermatol. 2016;136(7):1460–1470. doi:10.1016/j.jid.2016.03.016
7. Singh R, Kaushik S, Wang Y, et al. Autophagy regulates lipid metabolism. Nature. 2009;458(7242):1131–1135. doi:10.1038/nature07976
8. Komatsu M, Waguri S, Ueno T, et al. Impairment of starvation-induced and constitutive autophagy in Atg7-deficient mice. J Cell Biol. 2005;169(3):425–434. doi:10.1083/jcb.200412022
9. Mizushima N, Levine B, Cuervo AM, Klionsky DJ. Autophagy fights disease through cellular self-digestion. Nature. 2008;451(7182):1069–1075. doi:10.1038/nature06639
10. Vaz FM, Pras-Raves M, Bootsma AH, van Kampen AH. Principles and practice of lipidomics. J Inherit Metab Dis. 2015;38(1):41–52. doi:10.1007/s10545-014-9792-6
11. Hariri M, Millane G, Guimond MP, Guay G, Dennis JW, Nabi IR. Biogenesis of multilamellar bodies via autophagy. Mol Biol Cell. 2000;11(1):255–268. doi:10.1091/mbc.11.1.255
12. Lajoie P, Guay G, Dennis JW, Nabi IR. The lipid composition of autophagic vacuoles regulates expression of multilamellar bodies. J Cell Sci. 2005;118(Pt 9):1991–2003. doi:10.1242/jcs.02324
13. Levine B, Kroemer G. Autophagy in the pathogenesis of disease. Cell. 2008;132(1):27–42. doi:10.1016/j.cell.2007.12.018
14. Klionsky DJ, Abdelmohsen K, Abe A, et al. Guidelines for the use and interpretation of assays for monitoring autophagy (3rd edition). Autophagy. 2016;12(1):1–222. doi:10.1080/15548627.2015.1100356
15. Buerger C, Malisiewicz B, Eiser A, Hardt K, Boehncke WH. Mammalian target of rapamycin and its downstream signalling components are activated in psoriatic skin. Br J Dermatol. 2013;169(1):156–159. doi:10.1111/bjd.12271
16. Burger C, Shirsath N, Lang V, et al. Blocking mTOR signalling with rapamycin ameliorates imiquimod-induced psoriasis in mice. Acta Derm Venereol. 2017;97(9):1087–1094. doi:10.2340/00015555-2724
17. Scarlatti F, Bauvy C, Ventruti A, et al. Ceramide-mediated macroautophagy involves inhibition of protein kinase B and up-regulation of beclin 1. J Biol Chem. 2004;279(18):18384–18391. doi:10.1074/jbc.M313561200
18. Arab JP, Arrese M, Trauner M. Recent insights into the pathogenesis of nonalcoholic fatty liver disease. Annu Rev Pathol. 2018;13:321–350. doi:10.1146/annurev-pathol-020117-043617
19. Zeng C, Wen B, Hou G, et al. Lipidomics profiling reveals the role of glycerophospholipid metabolism in psoriasis. Gigascience. 2017;6(10):1–11. doi:10.1093/gigascience/gix087
 © 2023 The Author(s). This work is published and licensed by Dove Medical Press Limited. The
full terms of this license are available at https://www.dovepress.com/terms
and incorporate the Creative Commons Attribution
- Non Commercial (unported, 3.0) License.
By accessing the work you hereby accept the Terms. Non-commercial uses of the work are permitted
without any further permission from Dove Medical Press Limited, provided the work is properly
attributed. For permission for commercial use of this work, please see paragraphs 4.2 and 5 of our Terms.
© 2023 The Author(s). This work is published and licensed by Dove Medical Press Limited. The
full terms of this license are available at https://www.dovepress.com/terms
and incorporate the Creative Commons Attribution
- Non Commercial (unported, 3.0) License.
By accessing the work you hereby accept the Terms. Non-commercial uses of the work are permitted
without any further permission from Dove Medical Press Limited, provided the work is properly
attributed. For permission for commercial use of this work, please see paragraphs 4.2 and 5 of our Terms.