Back to Journals » Clinical Ophthalmology » Volume 13
Alteration in binocular fusion modifies audiovisual integration in children
Authors Quercia P ![]() , Pozzo T, Marino A, Guillemant AL, Cappe C
, Pozzo T, Marino A, Guillemant AL, Cappe C ![]() , Gueugneau N
, Gueugneau N
Received 17 January 2019
Accepted for publication 8 May 2019
Published 4 July 2019 Volume 2019:13 Pages 1137—1145
DOI https://doi.org/10.2147/OPTH.S201747
Checked for plagiarism Yes
Review by Single anonymous peer review
Peer reviewer comments 2
Editor who approved publication: Dr Scott Fraser
Supplementary video of Audiovisual integration in children
Views: 525
P Quercia,1 T Pozzo,2 A Marino,3 AL Guillemant,1 C Cappe,4 N Gueugneau1
1INSERM Unit 1093, Cognition-Action-Plasticité Sensorimotrice, University of Burgundy-Franche Comté, Dijon 21078, France; 2IIT@UniFe Center for Translational Neurophysiology, Istituto Italiano di Tecnologia, Ferrara, Italy; 3Private office, Vicenza 36100, Italy; 4Brain and Cognition Research Center, CerCo, Toulouse, France
Background: In the field of multisensory integration, vision is generally thought to dominate audiovisual interactions, at least in spatial tasks, but the role of binocular fusion in audiovisual integration has not yet been studied.
Methods: Using the Maddox test, a classical ophthalmological test used to subjectively detect a latent unilateral eye deviation, we checked whether an alteration in binocular vision in young patients would be able to change audiovisual integration. The study was performed on a group of ten children (five males and five females aged 11.3±1.6 years) with normal binocular vision, and revealed a visual phenomenon consisting of stochastic disappearanceof part of a visual scene caused by auditory stimulation.
Results: Indeed, during the Maddox test, brief sounds induced transient visual scotomas (VSs) in the visual field of the eye in front of where the Maddox rod was placed. We found a significant correlation between the modification of binocular vision and VS occurrence. No significant difference was detected in the percentage or location of VS occurrence between the right and left eye using the Maddox rod test orbetween sound frequencies.
Conclusion: The results indicate a specific role of the oculomotor system in audiovisual integration in children. This convenient protocol may also have significant interest for clinical investigations of developmental pathologies where relationships between vision and hearing are specifically affected.
Keywords: multisensory integration, binocular vision, audiovisual development, visual losses, ocular proprioception
Introduction
Multisensory integration is a fundamental brain mechanism allowing the integration of a multitude of inputs originating from the sense organs. Perceptive and behavioral responses to audiovisual targets are among the most explored in this field.1–4 Sounds can bias visual perception, as in the case of the “illusory flash effect” or the “fusion effect”.5,6 In these cases, sound biases vision, at least when the relationships between sound and vision are explored in their spatial aspect and through reaction times.7,8 Most of the time, visual inputs are luminous flashes, and only one study, using a visual target that could be precisely analyzed, has investigated how audition can change the details of a contrasted drawing.9
The quality of audiovisual cooperation also depends on the quality of the auditory and visual sensors, especially during the developmental period.10–12 It has been shown that a disturbance in the development of vision affecting both eyes at the beginning of life modifies but does not prevent the maturation of audiovisual integration.13 The perturbation enhances the salience of simple auditory input, and attention is biased toward hearing over vision.14 Early visual input to both eyes is critical for building the neural architecture needed for the development of audiovisual simultaneity.15,16 For both the deprived eye and the fellow eye, early unilateral visual deprivation changes the perception of simultaneity for audiovisual stimuli in humans.17 Unilateral visual deprivation is able to change not only the evolution of visual acuity for the deprived eye but also the development of binocular fusion.18,19 The role of binocular fusion in audiovisual integration has not yet been studied.
Studies involving children have shown the predominant role of vision during multimodal integration when combined with other sensory input.11 In these studies, vision was not modified. The objective of this study was to determine whether a modification of binocular vision in young patients without a history of visual deprivation would be able to change audiovisual encoding in childhood. We hypothesize that a slight alteration in binocular vision in children could dramatically affect audiovisual interaction.
Methods
Subjects
Audiovisual integration is likely to change throughout the life span from one subject to another. This study was performed on a group of average age 11 years, as it has been shown that children at this age have the same level of audiovisual integration as adults.11,12 Ten children (five males and five females aged 11.3±1.6 years) were tested within the guidelines of the Declaration of Helsinki with the informed consent of their parents. This was an observational clinical study with no therapeutic intervention, and thus did not require approval from an ethics committee. General exclusion criteria were psychiatric or genetic diseases, treatment with psychotropic drugs (especially phenylethylamine-based drugs or antiepileptics), delayed or abnormal psychomotor development, and IQ <90.
Experimental procedure
Visual assessment
All the children had 20/20 uncorrected vision in both eyes, based on evaluation with cyclopentolate to rule out underlying hypermetropia. Slit-lamp examinations of anterior and posterior segments were normal. Assessment of stereoscopic vision was done using the test of the Netherlands Organisation for Applied Scientific Research (TNO). It was always better than 120 arc seconds (Table 1). It was completed by standard and alternating cover tests allowing the measurement of horizontal and vertical phorias for distance vision, using prisms and a light source placed at 4 m from the child. The convergence of each eye was measured in centimeters for near vision using a Mawas ruler. This battery of tests is a classical clinical method to evaluate the normality of binocular vision.20 Children with strabismus with or without surgery, orthoptic rehabilitation in progress, vertical phoria >0.75 prism D, and reeducated amblyopia were excluded. All patients had normal binocular vision (TNO <120ʹ, PPC <8 cm, horizontal phoria <4 prism D, vertical phoria 0–0.25 prism D), and there was no history of abnormal visual fields.
Apparatus and stimuli
The core of our experiment relied on the study of the effect of brief sound stimulations on the visual perception of an image consisting of a small light associated with a red line that crossed it (Figure 1, supplementary video). Sounds were emitted simultaneously in both ears through Sennheiser HD 200 Pro headphones. Each beep lasted 500 ms at an exact volume of 50 dB. The patient received successively a series of 22 500 Hz and 23 1,000 Hz sound impulses delivered randomly, allowing the child to respond without stress. An experimental sequence with 45 sound impulses lasted 25 minutes on average. It must be emphasized that auditory stimulation (given by an examiner) was intermittent, separated by the time required for the child to answer quietly.
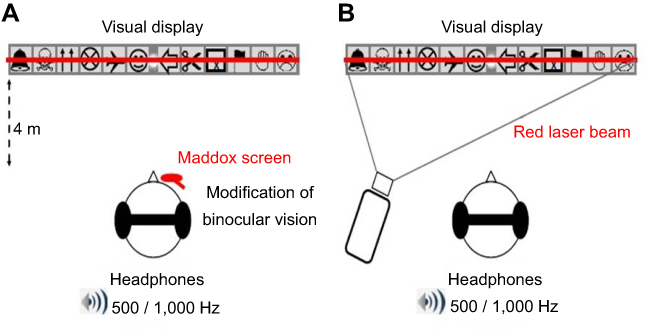 |
Figure 1 Schematic representation of the experimental set-up. Notes: (A) With the Maddox rod. Participants stood upright in front of the visual display, which was at the same height as their eyes. Here, the Maddox screen is represented over the subject's right eye (see “Experimental procedure” section and the supplementary video for details). Participants wore headphones that delivered sounds of 500 or 1,000 Hz (series of 500 ms beeps). During the trials, the subject had to fixate with both eyes on a small light located at the exact center of the visual display. Top: detailed representation of the visual display. Six 8-cm-high drawings, easy for the children to identify, were placed on each side of the visual display (the light always appeared in the center gray zone). Bottom: when the Maddox screen was placed in front of one of the two eyes, the subject sees a combination of the vision of the unoccluded eye (light point in the center and 12 pictures) and of the other eye (a red horizontal line that goes through the light). Each of the two eyes thus sees a different image of the light, and binocular fusion is modified. The subject fixates with both eyes on a light located in the center of 12 easily recognized images. (B) With the red laser beam. Here, the red line is produced by a laser beam projected through the center of this light. Because both eyes see the same image, there is no change in binocular vision. |
The light is located 4 m from the subject at eye level. It must be emphasized that the light must be very small so that the red line caused by the Maddox screen is as thin as possible (the surface of commonly used fixation points should be reduced to 1.2 mm at most). Light intensity (light-emitting diode) measured at 2 cm of the source was 120 lm. The red line can be created in two distinct ways: interposition of a Maddox screen in front of the right or left eye while the two eyes fixate on the light (Figure 1A), and projection of a laser beam emitted at a distance (4 m), the two eyes seeing the light and the laser beam without any screen interposition (Figure 1B).
When the Maddox screen is used, the appearance of light is changed: it appears on the retina with one eye in the form of a red line. This retinal image is so unlike the image formed in the other eye that the fusion reflex is not stimulated. The eyes will then stay in the passive position, ie, there is modification of binocular vision. When the laser projected on the light is used, the image received by the two retinas is identical, ie, binocular vision is maintained.
In the first condition (Maddox condition), the Maddox rod test was used specifically to disrupt the fusion of retinal images (Figure 1A). This condition was achieved with the screen placed in front of the right eye and in front of the left eye randomly. Note that the Maddox rod test is a classical ophthalmological evaluation. It is performed with a red Maddox rod consisting of 17 biconvex cylinders that give enough convergence to transform the image of a white-light dot into a red line perpendicular to the cylinder axis (supplementary video). When stripes are positioned parallel to the vertical axis of the eye, the patient sees two dissociated images of the same object (which is the light source placed 4m at eye level): a red horizontal line through the Maddox rod and a colorless light point in direct vision. Because the light is perceived as two distinct forms, the Maddox rod test thus alters the fusion of both retinal images. Consequently, the exact orientation of both eyes on the light can become less stable, because it is controlled only by ocular proprioception and corollary discharge.20
Three signals and interactions among them are used to create efficient binocular vision. The first signal is visual reafference from the retina. The second signal comes from ocular muscle proprioception. The last is a corollary discharge that is a copy of the command to maintain muscle tone (or to activate eye muscles when eyes are moving).21 During the Maddox rod test, an angular deviation known as latent deviation or heterophoria may occur in any of the three spatial planes,22 hence the Maddox rod test allows the manipulation of visual perception while enhancing the roles of ocular proprioception and corollary discharge. It is important to mention that we targeted vertical heterophoria rather than horizontal heterophoria, because the possibility of natural compensation is weak. In normal subjects, vertical deviation is on average 0.16°±0.01°.23 The Maddox rod test has been proven to make precise vertical heterophoria measurements.24 All subjects tested had normal vertical heterophoria (0.16° or less), which underlines the fact that with only ocular proprioception and corollary discharge, the control of visual axes remained excellent (Table 1).
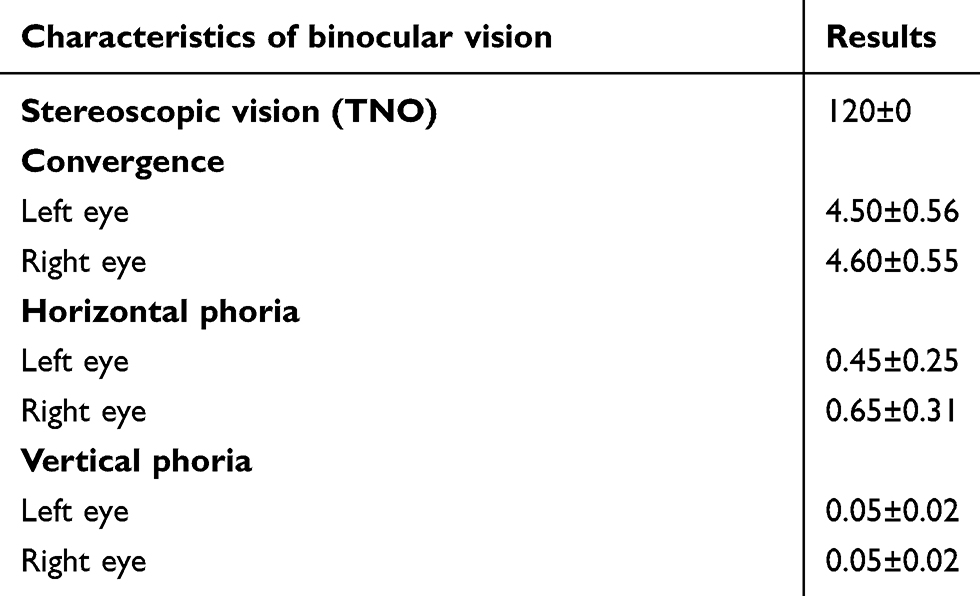 |
Table 1 Visual assessment |
In the second condition (laser condition), the Maddox test was not used. The same image (ie, a red line crossing a light) was given to both eyes using a red laser beam crossing the light (Figure 1B). In this condition, there was no modification of binocular vision, because both retinas received exactly the same image, allowing normal retinal fusion mechanisms. It must be emphasized that the patient saw an image similar to that seen during the Maddox rod test, but here retinal fusion was maintained.
In both conditions, the light and the red line were permanently presented, and six 8-cm-high drawings (extracted from Wingdings font, Word 2010) separated by a distance of 0.4° separation and easy for the children to identify, were placed on each side of the light. The binocular visual field covered by the drawings corresponded to a total angular width of 19°. The child stared directly at the light dot while hearing the sound impulses. We asked them to press a button as soon as the red line disappeared partially or totally. This step of the experiment allowed us to measure the reaction time between the perception of the sound and any visual scotoma (VS). The patient had to specify in front of which drawing the line disappeared (Figure 2). They had to report quietly that they were ready before each trial.
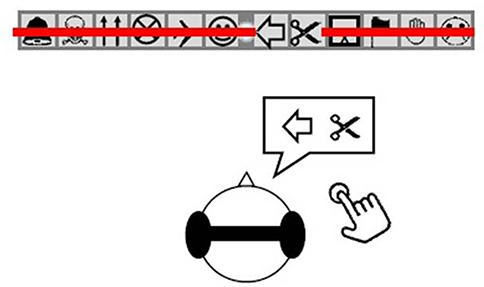 |
Figure 2 Example of a subject verbally reporting a VS. Note: While fixating on the visual display, if the subject experienced a VS they had to press a handheld button their right hand and say clearly to the experimenter from where the “red line” had disappeared, in this case at the level of the left-oriented arrow and the scissors. Abbreviation: VS, visual scotoma. |
Finally, we introduced a new paradigm in which under two conditions the patient received brief sounds while perceiving the same image: a red line crossing a tiny light, but the production of this perceived image differed. In the Maddox condition (Maddox rod in front of the right eye or in front of the left eye in random order), binocular vision was modified. In the laser condition, binocular vision remained intact. The patient received 45 sound stimulations with the Maddox rod in front of the right eye, in front of the left eye, and in the laser condition (ie, 135 stimulations in total). Trials were performed in a block for each condition, and ocular conditions (binocular vs right and left Maddox) were counterbalanced among subjects. This paradigm allowed the study of a possible influence of binocular vision on audiovisual integration.
Data analysis
Visual losses induced by sound perception were designated VSs, ie, a brief suppressive effect of visual perception. Here, one VS indicated a partial disappearance of a specific part of the red line, ie, corresponding to a picture location within the visual display. Therefore, two VSs indicated that a subject would have reported a disappearance of the red line over two pictures. The number of VSs was 0–12 per trial (ie, 12 pictures, Figure 1). VS were quantified as follows for each experimental condition.
Percentage of VS occurrence
The sum of trials with at least one VS was related to the total number of trials for each subject and experimental condition, so as to calculate a percentage of VS occurrence. For instance, when a participant reported at least one VS in five of the 22 trials in a given experimental condition, this gave (5×100)/22=22.72%, giving the percentage of VS occurrence. Group mean ± SE was calculated for each experimental condition (Figure 3A).
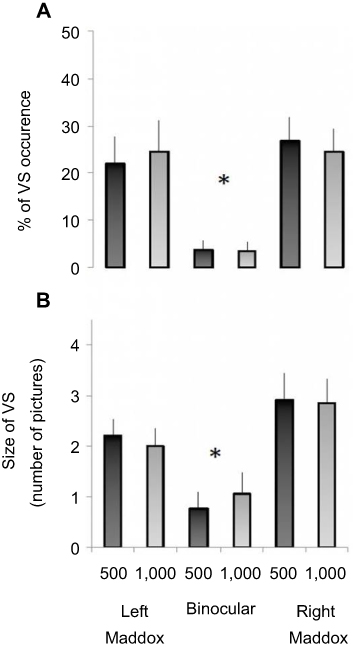 |
Figure 3 Occurrence and size of the VS phenomenon during the different experimental conditions. Notes: (A) Mean percentage (± SE) of VS occurrence for the different conditions of binocular vision and for both sound frequencies. (B) Mean size (± SE) of VS for the different experimental conditions. Note that the values are expressed as number of “vanished pictures”. *P<0.05Abbreviation: VS, visual scotoma. |
Size of VSs
For each subject and experimental condition, VSs were summed and then divided by the number of trials in which at least one VS was reported. For instance, if a subject reported three VSs during a trial and then one VS in the next trial, the size of VSs for these two trials would be two, ie, (3+1)/2=2, and expressed as “number of drawings”. The group mean ± SE was calculated for each experimental condition (Figure 3B).
Spatial distribution of VSs
Here, we measured the percentage of VS occurrence for each specific picture within the visual display. For each picture, we summed the trials with VS occurrence and divided them by the number of trials, ie, for each participant and experimental condition, we obtained a percentage of VS occurrences for each picture location. This allowed us to track the position of VS occurrence within the visual field of the participant (Figure 4).
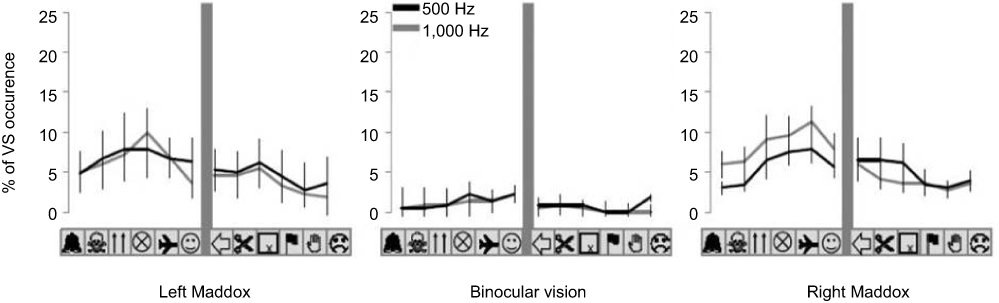 |
Figure 4 “Topography” or spatial distribution of VS within the visual display is represented for each experimental condition. Note: For each condition of binocular vision and sound frequency, the graphs indicate mean percentage (± SE) of VS occurrence for each picture location.Abbreviation: VS, visual scotoma. |
Mean reaction time
This was the time between perception of the sound and VS appearance. The subjects had to press a handheld button held in the right hand when they experienced a VS. As such, the reaction time actually measured the time to report a VS. Reaction time was calculated for each experimental condition.
Statistics
Normal distribution (Shapiro–Wilk and Kolmogorov–Smirnov tests) and sphericity (Mauchly's test) of the data were checked for all variables. As normality was systematically violated in the binocular vision condition, we used Friedman's ANOVA (nonparametric test) with a condition effect (left Maddox, binocular vision, and right Maddox 500 and 1,000 Hz each) for analysis of variables related to VS. Significant condition effects were followed up with Wilcoxon signed-rank tests with Holm–Bonferroni correction. To evaluate the potential link between visual performance and VS, we performed simple regression analyses between the percentage of VS occurrence in each condition and subjects' scores in the visual assessment tests (ie, TNO, standard and alternating cover test for horizontal and vertical phorias for distance vision, convergence of each eye for near vision). Mean reaction times for each experimental condition were entered as a three (binocular manipulation [left Maddox, binocular vision right Maddox]) by two [frequency 500 and 1,000 Hz) repeated-measure ANOVA. For all analyses, statistical significance was accepted at P<0.05.
Results
The main result of the present study was evidence of a clear link of modification of binocular vision with VS occurrence. For both right and left Maddox conditions, only one participant did not report any VS for either eye or sound frequency. Conversely, six of ten did not report any VS in the binocular condition. We found a modulation of VS according to experimental conditions. The percentage of VS occurrence for all experimental conditions is indicated in Figure 3A. It was 23.22%±2.34% and 25.63%±1.82% for left and right Maddox conditions, respectively, and 3.56%±0.72% for binocular vision, independently of sound frequency. Friedman's ANOVA revealed a significant condition effect (χ2 =23.31, P=0.00029). Wilcoxon tests then indicated that the percentage of VS occurrence was significantly lower during binocular vision compared to Maddox conditions for each sound frequency. For the 500 Hz condition, results yielded P=0.025 and 0.011 for binocular vision vs left and right Maddox condition comparison respectively. For the 1,000 Hz condition, P=0.029 and 0.007 for binocular vision vs left and right Maddox condition comparison, respectively, were found. No significant difference was detected between left and right Maddox conditions for any sound frequency (for the 500 Hz condition, P=0.39 for the left Maddox condition vs right Maddox condition comparison; for the 1,000 Hz condition, P=0.85 for the left Maddox condition vs right Maddox condition comparison).
The mean size of VS as a function of experimental conditions followed a pattern of modulation that was qualitatively similar to the percentage of VS occurrence (Figure 3B). Indeed, we systematically observed higher values in both Maddox conditions compared to binocular vision. On average, 2.09±0.13 and 2.88±0.18 pictures per trial were occluded for left and right Maddox conditions, respectively, and 0.92±0.13 for binocular vision, independently of sound frequency. ANOVA confirmed a significant condition effect (χ2=23.69, P=0.00025). Wilcoxon tests indicated that mean VS size was significantly lower during binocular vision than Maddox conditions (P<0.05 for all comparisons between binocular vision and Maddox conditions for each sound frequency). No significant difference was detected between left and right Maddox conditions for any sound frequency (P>0.05 for all). Note the presence of values <1, because some participants never experienced VSs in the binocular test.
The spatial distribution of VSs within the visual display for each experimental condition is shown in Figure 4. The figure precisely indicates the percentage of VS occurrence for each picture location. From the preceding analysis, no significant difference was detected in the percentage of VS occurrence between the right and left Maddox conditions or between the sound frequencies. We thus applied an ANOVA with a location effect for each condition of vision and each sound frequency separately. No significant location effect was detected for any test condition. The ANOVA gave χ2=11.50 (P=0.40) and χ2=14.54 (P=0.20) for the 500 Hz and 1,000 Hz left Maddox conditions, respectively, χ2=6.01 (P=0.87) and χ2=12.26 (P=0.34) for the 500 Hz and 1,000 Hz binocular vision, respectively, and χ2=32.50 (P=0.07) and χ2=9.23 (P=0.59) for the 500 Hz and 1,000 Hz right Maddox conditions, respectively.
Significantly, no evidence for a link between VS and visual performance was observed. For each experimental condition, R2 for regression analyses between percentages of VS occurrence and visual assessment tests were 0 for TNO, <0.20 for both eyes horizontal phorias, <0.22 for both eyes vertical phorias, and <0.20 for both eyes convergence tests (P>0.05 in each case). Mean reaction time was 864.9±232 ms for all experimental conditions (865.7±275 ms, 895.2±183 ms, and 833.9±238 ms for right and left Maddox and binocular conditions, respectively, independently of sound frequency). Importantly, repeated-measure ANOVA for reaction time revealed no main effect of binocular manipulation (F2,4=2.99, P=0.16) or frequency (F1,2=0.01, P=0.97) and no interaction effect (F2,4=1.06, P=0.42).
Discussion
Our study investigated whether sound induces a suppressive effect on vision in a population of 11-year-old children. We modified binocular vision using a Maddox rod to create an artificial modification of the fusion of both retinal images of a light. We found that brief auditory stimuli combined with binocular fusion modification created brief VSs.
The particular visual context created by the Maddox rod test may explain the present recorded VSs. Indeed, this test forces the brain to perceive two different images, even though the visual input has the same temporal and spatial characteristics (one single-lit dot located in one place). This visual context may create a sensory conflict that would explain the present VSs, which disappeared when the perceived final image (a red horizontal line superimposed on a central white-lit dot) has been created by an identical visual scene on each retina. In the following sections, we consider several possible explanations.
VS and binocular vision
A modification of sensorimotor mechanisms involved during normal binocular vision may have induced VSs. Indeed, binocular vision results from the combination of two components: visual (retinal signal) and oculomotor (the muscle tone that stabilizes gaze).20,21 In the present conflictual context, the brain might reweight these components, which could in turn contribute to creating VSs. Surprisingly, however, all subjects tested had good binocular vision, characterized by good depth perception, potential of convergence in near vision, and weak horizontal heterophoria. Moreover, during the recording session, measured vertical heterophoria remained at a normal physiological level. This suggests that the VSs were not directly caused by a preexisting anomaly of binocular vision, since the aforementioned clinical characteristics testified to normal binocular vision in all tested subjects. It must be emphasized that when there are VSs, the subject always sees the complete image of one eye and part of the image of the other eye. This is not the alternation of two images, but rather a deficit in the perception of one eye. The phenomenon is therefore different from what occurs during binocular rivalry.25
VS and attention processes
Even if binocular vision is normal, changes in the oculomotor signal during the present audiovisual and putative associated attention modifications may play a role in visual suppression.2,26 Indeed, the idea that oculomotor control and visual attention are dependent and interconnected functions is largely accepted.27–29 For instance, investigations using repetitive transcranial magnetic stimulation suggested that the oculomotor signal modulates the spatial distribution of visual processing resources.30 More generally, a large body of evidences assumes that ocular proprioception modulates the deployment of attention in visual space, shifts visual sensitivity, and codes the locus of attention in collaboration with the location of the image on the retinas.31–33 Additionally, the attention process in children compared to adults represents a more sensitive component of the multimodal integration process.11 However, even if we did not systematically test children's attention capacity, it should be emphasized that participants' performance did not change during the recording session, suggesting a stable attention level and consequently a limited contribution of this factor to VS. Although attention is recurrently proposed as a cause of intermodal suppression, its role in hearing and vision interference has not yet been clearly established.34
Otherwise, it is well accepted that gaze orientation modulates the attention process. More precisely, the oculomotor signal preactivates sensory areas.26 Similarly, auditory cortex activity is modulated by eye position in nonhuman primates, even in the dark and independently of retinal stimulation.35,36 Subjects' visual axis remained in its initial position and should not have modulated visuospatial attention. A positive effect on vision of auditory stimulation is also conceivable. Indeed, when a stream of visual, auditory, and mixed stimuli is randomly presented to the left or right side of the head, the oculomotor response is faster and more accurate than with visual stimuli alone.37 Therefore, because the present visual input was continuous, one might predict a similar influence of sound on visual processing and consequently a minimization of VS. The presence of VSs suggests that disturbance due to the Maddox rod counteracted this putative effect on the cognitive processing of the visual scene.
Origin of VS
The presence of visual losses during passive auditory stimulation is not entirely surprising. Indeed, it is well known that responses of the auditory cortex are greater during passive externally produced sounds than self-produced sound, due to an attenuation effect.38,39 Here, the auditory stimulus was passively delivered, irrelevant, and unexpected. This can produce a noisy signal, degrading the visual process, facilitated by the strong interconnection existing between visual and auditory primary cortical areas (in addition to their multimodal character).35,36,40 Interestingly enough, the recorded reaction time exceeded the normal values obtained during classical multimodal stimulation. In contrast to simple reaction time to audiovisual stimulations, participants should give their response after localizing the VS along the horizontal red line. Therefore, instead of measuring a simple reaction to an external stimulation, participants should report the transient modification of a continuous visual scene, reflected by random visual discontinuities. This can increase cognitive load and consequent reaction time. Otherwise, even if there was a trend toward observing more VSs in the central part of each hemifield, VSs appeared to be stochastic in nature. Notably, the occurrence of visual loss was randomly distributed in time and space and recorded whatever the frequency (500 or 1,000 Hz) of the sound stimulations. The present protocol may induce such inconsistency in participant verbal response, due to the large size of the drawing for localizing the VSs. Another possibility is the transient character of the explicit VSs (only qualitatively estimated, based on participant verbal reports),which could additionally weaken participant accuracy. More speculatively, the chaotic occurrence of VSs may rely on desynchronization of cortical activity.41 Taken together, these results suggest a long-term process and a central origin of VSs.
Conclusion
In children with altered binocular vision, we have revealed a visual phenomenon consisting of stochastic disappearances of a part of the visual scene caused by auditory stimulation. This result indicates a specific role for the oculomotor system in the audiovisual integration process in children. Moreover, the proposed convenient protocol may have significant interest for clinical investigations, particularly in the frame of developmental pathologies where relationships between vision and hearing are specifically affected.
Acknowledgments
The authors thank the AF3DYS Association, children, and parents for their kind participation. The authors also thank LJ Feiss, MD for revising the English version of the manuscript.
Disclosure
The authors report no conflicts of interest in this work.
References
1. Stein BE, Meredith MA. The Merging of the Senses. Cambridge, MA: MIT Press; 1993.
2. Koelewijn T, Bronkhorst A, Theeuwes J. Attention and the multiple stages of multisensory integration: a review of audiovisual studies. Acta Psychol (Amst). 2010;134(3):372–384. doi:10.1016/j.actpsy.2010.03.010
3. Cappe C, Thut G, Romei V, Murray M. Auditory-visual multisensory interactions in humans: timing, topography, directionality, and sources. J Neurosci. 2010;30:12572–12580. doi:10.1523/JNEUROSCI.1099-10.2010
4. Cappe C, Thut G, Romei V, Murray MM. Selective integration of auditory-visual looming cues by humans. Neuropsychologia. 2009;47:1045–1052. doi:10.1016/j.neuropsychologia.2008.11.003
5. Shams L, Kamitani Y, Shimojo S. Visual illusion induced by sound. Brain Res Cogn Brain Res. 2002;14:147–152. doi:10.1016/S0926-6410(02)00069-1
6. Mishra J, Martinez A, Hillyard SA. Cortical processes underlying sound-induced flash fusion. Brain Res. 2008;1242:102–115. doi:10.1016/j.brainres.2008.05.023
7. Stein BE, Meredith MA, Huneycutt WS, Mcdade L. Behavioral indices of multisensory integration: orientation to visual cues is affected by auditory stimuli. J Cog Neurosc. 1989;1:12–24. doi:10.1162/jocn.1989.1.1.12
8. Gori M, Sandini G, Burr D. Development of visuo-auditory integration in space and time. Front Integr Neurosci. 2012;6:77.
9. Hidaka S, Ide M. Sound can suppress visual perception. Sci Rep. 2015;5:10483. doi:10.1038/srep10483
10. Gori M. Multisensory integration and calibration in children and adults with and without sensory and motor disabilities. Multisens Res. 2015;28:71–99.
11. Dionne-Dostie E, Paquette N, Lassonde M, Gallagher A. Multisensory integration and child neurodevelopment. Brain Sci. 2015;5:32–57. doi:10.3390/brainsci5010032
12. Murray MM, Lewkowicz DJ, Amedi A, Wallace MT. Multisensory processes: a balancing act across the lifespan. Trends Neurosci. 2016;39:567–579. doi:10.1016/j.tins.2016.05.003
13. Guerreiro MJS, Putzar L, Röder B. The effect of early visual deprivation on the neural bases of multisensory processing. Brain. 2015;138:1499–1504. doi:10.1093/brain/awu353
14. de Heering A, Dormal G, Pelland M, Lewis T, Maurer D, Collignon O. A brief period of postnatal visual deprivation alters the balance between auditory and visual attention. Curr Biol. 2016;26:3101–3105. doi:10.1016/j.cub.2016.10.014
15. Richards MD, Goltz HC, Wong AMF. Alterations in audiovisual simultaneity perception in amblyopia. PLoS One. 2017;12:e0179516. doi:10.1371/journal.pone.0179516
16. Carriere BR, Royal DW, Perrault TJ, et al. Visual deprivation alters the development of cortical multisensory integration. J Neuropsysiol. 2007;98:2858–2867. doi:10.1152/jn.00587.2007
17. Chen YC, Lewis TL, Shore DI, Maurer D. Early binocular input is critical for development of audiovisual but not visuotactile simultaneity perception. Curr Biol. 2017;27:583–589. doi:10.1016/j.cub.2017.01.009
18. Hess RF, Mansouri B, Thompson B. Restoration of binocular vision in amblyopia. Strabismus. 2011;19:110–118. doi:10.3109/09273972.2011.600418
19. Mitchell DE, Sengpiel F. Neural mechanisms of recovery following early visual deprivation. Philos Trans R Soc Lond B Biol Sci. 2009;364:383–398. doi:10.1098/rstb.2008.0192
20. Stidwill D, Fletcher R. Normal Binocular Vision: Theory, Investigation and Practical Aspects. Oxford: Wiley-Blackwell; 2011.
21. Wurtz RH. Neuronal mechanisms of visual stability. Vision Res. 2008;48(20):2070–2089. doi:10.1016/j.visres.2008.03.021
22. Scheiman M, Wick B. Clinical Management of Binocular Vision: Heterophoric, Accommodative, and Eye Movement Disorders. Philadelphia: Lippincott Williams and Wilkins Ed; 2013.
23. Van Rijn LJ, Ten Tusscher MP, de Jong I, Hendrikse F. Asymmetrical vertical phorias indicating dissociated vertical deviation in subjects with normal binocular vision. Vision Res. 1998;38:2973–2978. doi:10.1016/S0042-6989(98)00079-0
24. Casillas Casillas E, Rosenfield M. Comparison of subjective heterophoria testing with a phoropter and trial frame. Optom Vis Sci. 2006;83:237–241. doi:10.1097/01.opx.0000197958.83213.b1
25. Brascamp JW, Klink PC, Levelt WJ. The ‘laws’ of binocular rivalry: 50 years of Levelt’s propositions. Vision Res. 2015;109:20–37. doi:10.1016/j.visres.2015.02.019
26. Perry CJ, Fallah M. Effector-based attention systems. Ann N Y Acad Sci. 2017;1396:56–69. doi:10.1111/nyas.13354
27. Rizzolatti G, Riggio L, Dascola I, Umiltá C. Reorienting attention across the horizontal and vertical meridians: evidence in favor of a premotor theory of attention. Neuropsychologia. 1987;25:31–40. doi:10.1016/0028-3932(87)90041-8
28. Moore T, Fallah M. Microstimulation of the frontal eye field and its effects on covert spatial attention. J Neurophysiol. 2004;91:152–162. doi:10.1152/jn.00741.2002
29. Kustov AA, Robinson DL. Shared neural control of attentional shifts and eye movements. Nature. 1996;384:74–77. doi:10.1038/384074a0
30. Balslev D, Gowen E, Miall RC. Decreased visual attention further from the perceived direction of gaze for equidistant retinal targets. J Cogn Neurosci. 2011;23:661–669. doi:10.1162/jocn.2010.21440
31. Balslev D, Newman W, Knox PC. Extraocular muscle afferent signals modulate visual attention. Invest Ophthalmol Vis Sci. 2012;53:7004–7009. doi:10.1167/iovs.12-10249
32. Odoj B, Balslev D. Visual sensitivity shifts with perceived eye position. J Cogn Neurosci. 2013;25:1180–1189. doi:10.1162/jocn_a_00382
33. Odoj B, Balslev D. Role of oculoproprioception in coding the locus of attention. J Cogn Neurosci. 2016;28:517–528. doi:10.1162/jocn_a_00910
34. Mozolic JL, Joyner D, Hugenschmidt CE, et al. Cross-modal deactivations during modality-specific selective attention. BMC Neurol. 2008;8:35. doi:10.1186/1471-2377-8-35
35. Fu KM, Shah AS, O’Connell MN, et al. Timing and laminar profile of eye-position effects on auditory responses in primate auditory cortex. J Neurophysiol. 2004;92:3522–3531. doi:10.1152/jn.01228.2003
36. Werner-Reiss U, Kelly KA, Trause AS, Underhill AM, Groh JM. Eye position affects activity in primary auditory cortex of primates. Curr Biol. 2003;13:554–562.
37. Wu J, Li Q, Bai O, Touge T. Multisensory interactions elicited by audiovisual stimuli presented peripherally in a visual attention task: a behavioral and event-related potential study in humans. J Clin Neurophysiol. 2009;26:407–413. doi:10.1097/WNP.0b013e3181c298b1
38. Houde JF, Nagarajan SS, Sekihara K, Merzenich MM. Modulation of the auditory cortex during speech: an MEG study. J Cogn Neurosci. 2002;14:1125–1138. doi:10.1162/089892902760807140
39. Martikainen MH, Kaneko K, Hari R. Suppressed responses to self-triggered sounds in the human auditory cortex. Cereb Cortex. 2005;15:299–302. doi:10.1093/cercor/bhh131
40. Murray MM, Thelen A, Thut G, Romei V, Martuzzi R, Matusz PJ. The multisensory function of the human primary visual cortex. Neuropsychologia. 2016;83:161–169. doi:10.1016/j.neuropsychologia.2015.08.011
41. Franciotti R, Brancucci A, Della Penna S, Onofrj M, Tommasi L. Neuromagnetic responses reveal the cortical timing of audiovisual synchrony. Neuroscience. 2011;193:182–192. doi:10.1016/j.neuroscience.2011.07.018
 © 2019 The Author(s). This work is published and licensed by Dove Medical Press Limited. The
full terms of this license are available at https://www.dovepress.com/terms
and incorporate the Creative Commons Attribution
- Non Commercial (unported, 3.0) License.
By accessing the work you hereby accept the Terms. Non-commercial uses of the work are permitted
without any further permission from Dove Medical Press Limited, provided the work is properly
attributed. For permission for commercial use of this work, please see paragraphs 4.2 and 5 of our Terms.
© 2019 The Author(s). This work is published and licensed by Dove Medical Press Limited. The
full terms of this license are available at https://www.dovepress.com/terms
and incorporate the Creative Commons Attribution
- Non Commercial (unported, 3.0) License.
By accessing the work you hereby accept the Terms. Non-commercial uses of the work are permitted
without any further permission from Dove Medical Press Limited, provided the work is properly
attributed. For permission for commercial use of this work, please see paragraphs 4.2 and 5 of our Terms.