Back to Journals » Diabetes, Metabolic Syndrome and Obesity » Volume 13
Alpha1-Antitrypsin in Urinary Extracellular Vesicles: A Potential Biomarker of Diabetic Kidney Disease Prior to Microalbuminuria
Authors Ning J ![]() , Xiang Z, Xiong C, Zhou Q, Wang X, Zou H
, Xiang Z, Xiong C, Zhou Q, Wang X, Zou H ![]()
Received 21 February 2020
Accepted for publication 29 May 2020
Published 17 June 2020 Volume 2020:13 Pages 2037—2048
DOI https://doi.org/10.2147/DMSO.S250347
Checked for plagiarism Yes
Review by Single anonymous peer review
Peer reviewer comments 2
Editor who approved publication: Prof. Dr. Juei-Tang Cheng
Jing Ning, Zhicong Xiang, Chongxiang Xiong, Qin Zhou, Xin Wang, Hequn Zou
Department of Nephropathy, The Third Affiliated Hospital of Southern Medical University, Guangzhou 510630, People’s Republic of China
Correspondence: Hequn Zou
Department of Nephropathy, The Third Affiliated Hospital of Southern Medical University, 183 Zhongshan West Avenue, Tianhe District, Guangzhou 510630, People’s Republic of China
Tel +86 20 6278 4391
Email [email protected]
Purpose: Diabetic kidney disease (DKD), which is related to inflammation and immune response, is the primary vascular complication of diabetes mellitus and also the leading etiology of end-stage renal disease. Urinary extracellular vesicles (UEVs) are an attractive source for biomarker detection as they involve molecular constituents derived from their parental sections of the nephron. In this study, we aimed to search for a potential biomarker in UEVs for the early diagnosis and prediction of DKD, especially before the emergence of microalbuminuria.
Patients and Methods: UEVs were isolated from the urine of healthy subjects, pre-diabetic, and diabetic patients with varying degrees of kidney damage by ultracentrifugation, and the extracted UEVs were used to measure alpha1-antitrypsin (α 1-AT) by Western blot. To explore the function of α 1-AT in the inflammatory process leading to DKD, we silenced the expression of α 1-AT in renal tubular epithelial cells using cell transfection techniques to assess the differential expression of the inflammatory factors such as MCP-1 and TNF-α using qRT-PCR.
Results: There was no expression of α 1-AT in the UEVs of either healthy or pre-diabetic subjects. Its expression was significantly increased in the UEVs of diabetic patients with normoalbuminuria (prior to microalbuminuria), which was more sensitive and more stable than other renal indexes to predict DKD. Additionally, the expression of α 1-AT in UEVs was gradually upregulated with the aggravation of DKD and the decline of renal function. In vitro, the mRNA expression of MCP-1 and TNF-α was significantly decreased when the generation of α 1-AT in tubular epithelial cells was inhibited under high glucose stimulation.
Conclusion: Our results suggest that α 1-AT derived from UEVs, especially in diabetic patients with normoalbuminuria, might serve as a potential noninvasive biomarker for diagnosis of DKD early in the development of the disease and may predict the future decline of renal function.
Keywords: diabetic kidney disease, urinary extracellular vesicles, biomarker, alpha1-antitrypsin, inflammation, tubular epithelial cell
Introduction
Diabetes mellitus (DM) has become the most frequent metabolic disease across the world. According to The International Diabetes Federation (IDF), about 1 in 11 adults suffered diabetes mellitus globally in 2015,1 of which over 90% suffer from type 2 DM.2,3 Diabetic kidney disease (DKD) is the primary vascular complication of DM and is the major etiology of end-stage renal disease (ESRD).4 At present, microalbuminuria is the most widely used noninvasive marker for early detection of diabetic renal damage in the clinic. However, recent studies demonstrate that type 2 diabetic patients can commonly display advanced renal pathological changes while remaining in a normoalbuminuric state.5,6 Furthermore, microalbuminuria is not a specific marker for DKD, because it can also appear in patients with other progressive chronic kidney diseases (CKD).7,8 The gold standard for diagnosis is an invasive renal biopsy, but this process could result in serious complications of variable severity and cannot be performed frequently in patients with DM.9 Therefore, screening for specific and sensitive biomarkers is urgently needed for the early diagnosis of DKD and long-term monitoring of progression to ESRD.
Over the past decade, extracellular vesicles (100–1000nm in diameter) have been the focus of liquid biopsy studies for their potential role used as biomarkers in clinical diagnosis. Urinary extracellular vesicles (UEVs) are an attractive source of candidate marker detection since they involve molecular constituents derived from parental sections of the nephron, including endothelial cells, proximal tubular epithelial cells, and podocytes.10–12 UEVs play a significant role in the homeostasis and advancement of kidney disease through participation in multiple cell–cell contact and cell–environment communication by transferring various messenger molecules (proteins, nucleic acids, and lipids) to recipient cells.13 Moreover, UEVs can remain uncontaminated by blood-borne extracellular vesicles as they are large-sized bodies that cannot get through the glomerular filtration barrier.14 Examining UEVs for diabetic kidney disease biomarkers may serve as a potential and logical diagnostic approach replacing renal biopsies and assessing microalbuminuria, as these vesicles can be obtained noninvasively, are easy to isolate and are derived from the kidney and urinary tract.
Present research indicates that the pathogenesis of diabetic kidney disease is multifactorial, in which inflammation and immune response play a critical role.15,16 Furthermore, pro-inflammatory signaling pathways and their downstream molecules are suggested as novel biomarkers and potential therapeutic targets.17 Alpha1-antitrypsin (α1-AT, AAT), also called α1-proteinase inhibitor or serpin A1, is one of the most critical serine proteinase inhibitors in human plasma, encoded by the SERPINA1 gene. Alpha1-antitrypsin performs diverse roles in the regulation of inflammation, immune response, cell apoptosis, and proliferation, depending on its different biological characteristics.18–21 Although α1-AT in the blood is mainly produced by the liver, a large number of studies have found that many extrahepatic tissues, including intestinal epithelial cells, alveolar epithelial cells, pancreatic microvascular endothelial cells, monocytes, T lymphocytes, and articular cartilage, can also secrete α1-AT.22–26 In addition, it has been demonstrated that renal tubular epithelial cells can express α1-AT at both the protein and mRNA levels, and the expression can be upregulated by LPS.27 Therefore, we hypothesized that α1-AT might also be involved in the inflammatory processes involved in the progression of DKD. In this study, we assessed whether α1-AT derived from urinary extracellular vesicles could serve as a noninvasive diagnostic and prognostic early biomarker in diabetic patients at different stages of the disease, and explored the significance of α1-AT in the pathogenesis of DKD.
Patients and Methods
Population Design
This cross-sectional study was conducted on 147 subjects (40 healthy people, 40 pre-diabetic patients, 28 diabetic patients with normoalbuminuria, 28 diabetic patients with microalbuminuria and 11 diabetic patients with macroalbuminuria), who were strictly screened from 1529 physical examinations, recruited from six communities in Wanzhai County, Zhuhai City, China, from January to April 2018. Healthy individuals were required not to have a history of smoking and drinking of alcohol, or of chronic diseases such as cancer, kidney disease, hypertension, diabetes, and liver disease, and no history of medication in the past three months. All physical examination indicators of healthy individuals in this study were within normal ranges. Pre-diabetes was diagnosed as impaired fasting glucose (5.6mmol/L≤ FPG <7.0mmol/L) and/or abnormal glucose tolerance (7.8mmol/L≤ OGTT <11.1mmol/L, and/or 5.5%≤ HbA1c <6.4%). The inclusion criteria for diabetes mellitus were based on the Japan Diabetes Society Diagnostic Criteria,28 and the included patients could only have one other chronic disease to eliminate the interference of other diseases. The grouping was based on the urinary albumin-to-creatinine ratio (ACR), according to the Expert Consensus on Prevention and Treatment of Diabetic Nephropathy 2014 criteria (ACR ≤3mg/mmol for normoalbuminuria, 3mg/mmol< ACR ≤30mg/mmol for microalbuminuria, ACR >30mg/mmol for macroalbuminuria). Participants with malignant disease, other progressive kidney diseases, chronic liver disease, coronary heart disease, stroke, women while on their menstrual period, urinary tract infections, unexplained decline in eGFR, and unqualified specimens were excluded. The unqualified specimens included samples collected without an overnight fast and/or stopping of medication for at least 10h before taking the sample, samples which were not the fresh first-morning urine from participants, or samples which were less than 80mL in volume. All participants were required to have no history of surgery or blood transfusion within the past year. This study was carried out in accordance with the guidelines of the Helsinki Declaration for experiments involving humans and approved by the Ethics Committee of the Third Affiliated Hospital of Southern Medical University, Guangzhou. All patients and healthy subjects signed written informed consent.
Laboratory Examination
All blood and urine samples were collected after overnight fasting, and any medication use was stopped for at least 10h before sample collection. Samples were transported to the clinical laboratory center of the Third Affiliated Hospital of Southern Medical University within 3h after collection. Serum creatinine (SCr), fasting plasma glucose (FPG), uric acid (UA), blood urea nitrogen (BUN), high-density lipoprotein cholesterol (HDL-C), and triglyceride (TG) were measured by the colorimetric method. Low-density lipoprotein cholesterol (LDL-C) was calculated indirectly. High sensitivity c-reactive protein (hsCRP) was detected by immunoturbidimetry, while interleukin- 6 (IL-6) was detected by ELISA. Estimated glomerular filtration rate (eGFR) was calculated as 186 X (SCr)−1.154 X (Age)−0.203 X 0.742 (if female).29 Urinary albumin-to-creatinine ratio was calculated by dividing the value of urinary albumin by urinary creatinine. Body mass index (BMI) was calculated as the ratio of weight (in kg) to height squared (in m2). Waist-to-height ratio (WHtR) was calculated by dividing the value of waist circumference by height, which was considered as the index for central obesity.30–32
Urine Preparation and Isolation of Urinary Extracellular Vesicles
Fresh first-morning urine samples (80mL) were collected from all subjects in sterile containers and centrifuged at 2000 × g (Thermo Legend Mach 1.6R, Wilmington, DE, USA) for 30 min at 4°C (within 3 hours after collection) to remove the particulate matter, including cells and cell fragments. The supernatants were then stored at −80°C until further analysis. Subsequently, the clarified urine was centrifuged at 17,000 × g at 4°C for 10 minutes in a JA20 rotor (Avanti J-26S XP, Beckman, USA) to remove large membrane vesicles and other cell organelles, and the supernatant was moved to another sterile container. The pellets were resuspended in 200µL separation solution (250mmol/L sucrose, 10mmol/L triethanolamine, pH 7.6), and then 40mg DTT was added to the suspension at 37°C for 10 min to dissolve the Tamm-Horsfall protein polymeric network. After that, the mixture was centrifuged at 17,000 × g at 4°C for 10 minutes to retrieve the extracellular vesicles in the pellet. The supernatants from the previous two steps were mixed and ultracentrifuged at 170,000 × g at 4°C for 65 minutes in a Ti70 rotor (Optima XPN-100, Beckman, USA). Finally, the resulting UEVs pellets were solubilized in 300µL PBS per sample and stored at −80°C. The identification and purity of UEVs were analyzed by Nanoparticle Tracking Analysis (NTA) and Transmission Electron Microscope (TEM).
Nanoparticle Tracking Analysis
The UEVs suspension (2 µl) was diluted in PBS at a ratio of 1: 1000, and the diluted UEVs were extracted with a 1 mL syringe and slowly injected into the nanoparticle tracer analyzer sample tank. After loading the sample into the sample loading tank, the sample loading port and the sample outlet were plugged. The nanoparticle tracking analyzer NS3000 (NanoSight3000) was used to track the Brownian trajectory of UEVs nanoparticles, and the concentration and size range of the extracted UEVs in each study group were analyzed.
Transmission Electron Microscopy
We verified the morphological characteristics of extracellular vesicles by Transmission Electron Microscopy. UEVs (30 µL) were adsorbed on formvar/carbon-coated copper grids for 2 minutes, after which the excess fluid was removed using filter paper. The grids were then exposed for 10 minutes to 20 µL 2% phosphotungstic acid, and the excess fluid was removed again. After that, the grids were washed twice with water, and airdried for 2 minutes. Finally, the samples were examined with TEM (JEM-2100).
Western Blot
Total protein of urinary extracellular vesicles and cultured cells was extracted by RIPA lysis buffer (Beyotime, China) containing 1% protease inhibitor cocktail (PMSF, Beyotime, China), fully oscillated and then incubated statically for 30 min at 4°C. The protein lysate was centrifuged at 12,000 × g at 4°C for 10 minutes to remove the remaining debris and the supernatants were used as total UEVs lysates and cell lysates. The protein concentration of cultured cells was quantified using a Pierce BCA Protein Assay Kit (Thermo scientific, USA). Afterwards, equal amounts of cellular protein (20µg) and the same volumes of UEVs protein (20µL) were used to SDS-page on 10% polyacrylamide gels and transferred onto PVDF membranes (Millipore, USA) at a constant current of 200mA for 90min, which were then blocked at room temperature for 2h and blotted with primary antibodies overnight at 4°C. Membranes were probed with the following primary antibodies respectively: rabbit polyclonal anti-α1-AT antibody (abcam, UK) at a dilution of 1:1000, rabbit monoclonal anti-TSG101 antibody (abcam, UK) at a dilution of 1:1000, mouse monoclonal anti-GAPDH antibody (abclonal, China) at a dilution of 1:5000, and mouse monoclonal anti-β-actin antibody (Proteintech, USA) at a dilution of 1:5000. The ECL Western blotting detection system was used to observed the bands.
RNA Isolation and Quantitative RT-PCR Analysis
Total RNA was extracted from cultured human proximal tubular epithelial cells (HK-2) using Total RNA Extraction Reagent (Vazyme, China). The RNA was purified and reverse transcribed with PrimeScript™ RT reagent Kit (TAKARA, Japan) to generate cDNA, followed by qRT-PCR using TB Green® Premix Ex Taq™ II (TAKARA, Japan) to detect the expression of relative mRNA of relevant indicators and the internal standard. The sequences of the qRT-PCR primers were shown as follows: 5ʹ-CATCAAGAAGGTGGTGAAGCAG-3ʹ and 5ʹ-GTGTCGCTGTTGAAGTCAGAG-3ʹ for GAPDH as the internal standard; 5ʹ-CATCTACTCCCAGGTCCTCTTCA-3ʹ and 5ʹ-GAGGAGGTTGACCTTGGTCTG-3ʹ for TNF-α; 5ʹ-GCAATCAATGCCCCAGTCA-3ʹ and 5ʹ-ACACTTGCTGCTGGTGATTCTT-3ʹ for MCP-1; 5ʹ-GAAGGGTACTCAAGGGAAAATTG-3ʹ and 5ʹ-TCACCAGAGCAAAAACTGTGTCT-3ʹ for α1-AT. The quantitative RT-PCR analysis was conducted in a Lightcycler 96 (Roche, Switzerland) and all tests were performed at least three times. The cycling parameters were 5 sec at 95°C, followed by 30 sec at 55°C and 30 sec at 72°C, for totally 50 cycles.
Cell Culture and Stimulation
Human proximal tubular epithelial cells (HK-2) were purchased from the American Type Culture Collection (ACTT, USA) and were grown in normal glucose (1g/L D-Glucose) DMEM medium (Gibco, USA) containing 10% fetal bovine serum (FBS, Gibco, USA) under 5% CO2 at 37°C. HK-2 cells were used between the 5th and 10th passages for all experiments. The cell monolayers at 60–80% confluence were cultured in serum-free DMEM media containing 5.5 mM (1g/L) D-glucose for 24 h and then split into five experimental groups based on glucose concentration. To observe the effect of high glucose on HK-2 cells, we assessed the following conditions: 5.5mM glucose as normal control (NC), 15mM glucose, 30mM glucose, 45mM glucose, and 5.5mM glucose+39.5mM mannitol as osmotic pressure control group (OP). After 48 h stimulation, protein and RNA were extracted from confluent cells for further analysis.
CCK-8 Analysis
Cell counting kit (CCK-8 kit, KeyGEN, China) was used to assess cell viability and HK-2 cells were cultured in the same condition as mentioned above. Adjusted the cell concentration to 0.5 × 10⁴/mL, and seeded in a 96-well plate with 100 uL/well in seven replicates per experimental group. After covered with 70% of the bottom of the well plate, intervention factors were added to the plate according to the grouping. 90 µl fresh medium and 10 µl CCK-8 solution were used to replace the original medium in each well after 48 h stimulation and the 96-well plate was incubated in the dark for 1 h. Control wells (untreated cells, culture medium and CCK-8 solution) and blank wells (culture medium and CCK-8 solution) were also set up. The absorbance at 450 nm was detected using a plate reader (Bio-TEK, SynergyHTX).
Cell Transfection
When HK-2 cells covered 70% of each well in a 6-well plate, α1-AT siRNA or Negative Control siRNA (GenePharma, China) were transfected into HK-2 cells for 12–24 h using LipofectamineTM 3000 Transfection Reagent (Invitrogen, USA). After transfection, intervention reagents were added to the wells according to the grouping as follows: normal glucose (5.5mM) with Negative Control siRNA (NC), high glucose with Negative Control siRNA (30mM), and high glucose with α1-AT siRNA (30mM+siRNA). After 48 h of stimulation, transfection efficiency and the differential expression of relative factors were determined using Western blot and quantitative RT-PCR.
Statistical Analysis
The clinical data were expressed as mean ± standard deviation (SD) and analyzed using one-way ANOVA, followed by the LSD post hoc test for multiple comparisons (SPSS 20.0). All the quantitative RT-PCR data and statistical data of Western blot were finished using GraphPad Prism7 (GraphPad Prism Software, USA) and analyzed with Student’s t-test. Statistical significance was accepted as p<0.05 in all tests.
Results
Demographic and Clinical Characteristics of Study Subjects
Baseline characteristics of healthy subjects and patients with various degrees of diabetes mellitus are shown in Table 1. Compared with healthy subjects and pre-diabetic patients, diabetic patients were significantly older, had a higher body mass index, waist-to-height ratio, blood pressure and triglyceride level, and had a lower level of high-density lipoprotein cholesterol. Additionally, patients with microalbuminuria and those with macroalbuminuria had significantly higher levels of fasting plasma glucose, insulin, uric acid, serum creatinine, blood urea nitrogen and inflammatory factors (hypersensitive C-reactive protein, interleukin-6), and had lower estimated glomerular filtration rate than the other groups. However, there was no statistical difference in low-density lipoprotein cholesterol levels between the groups.
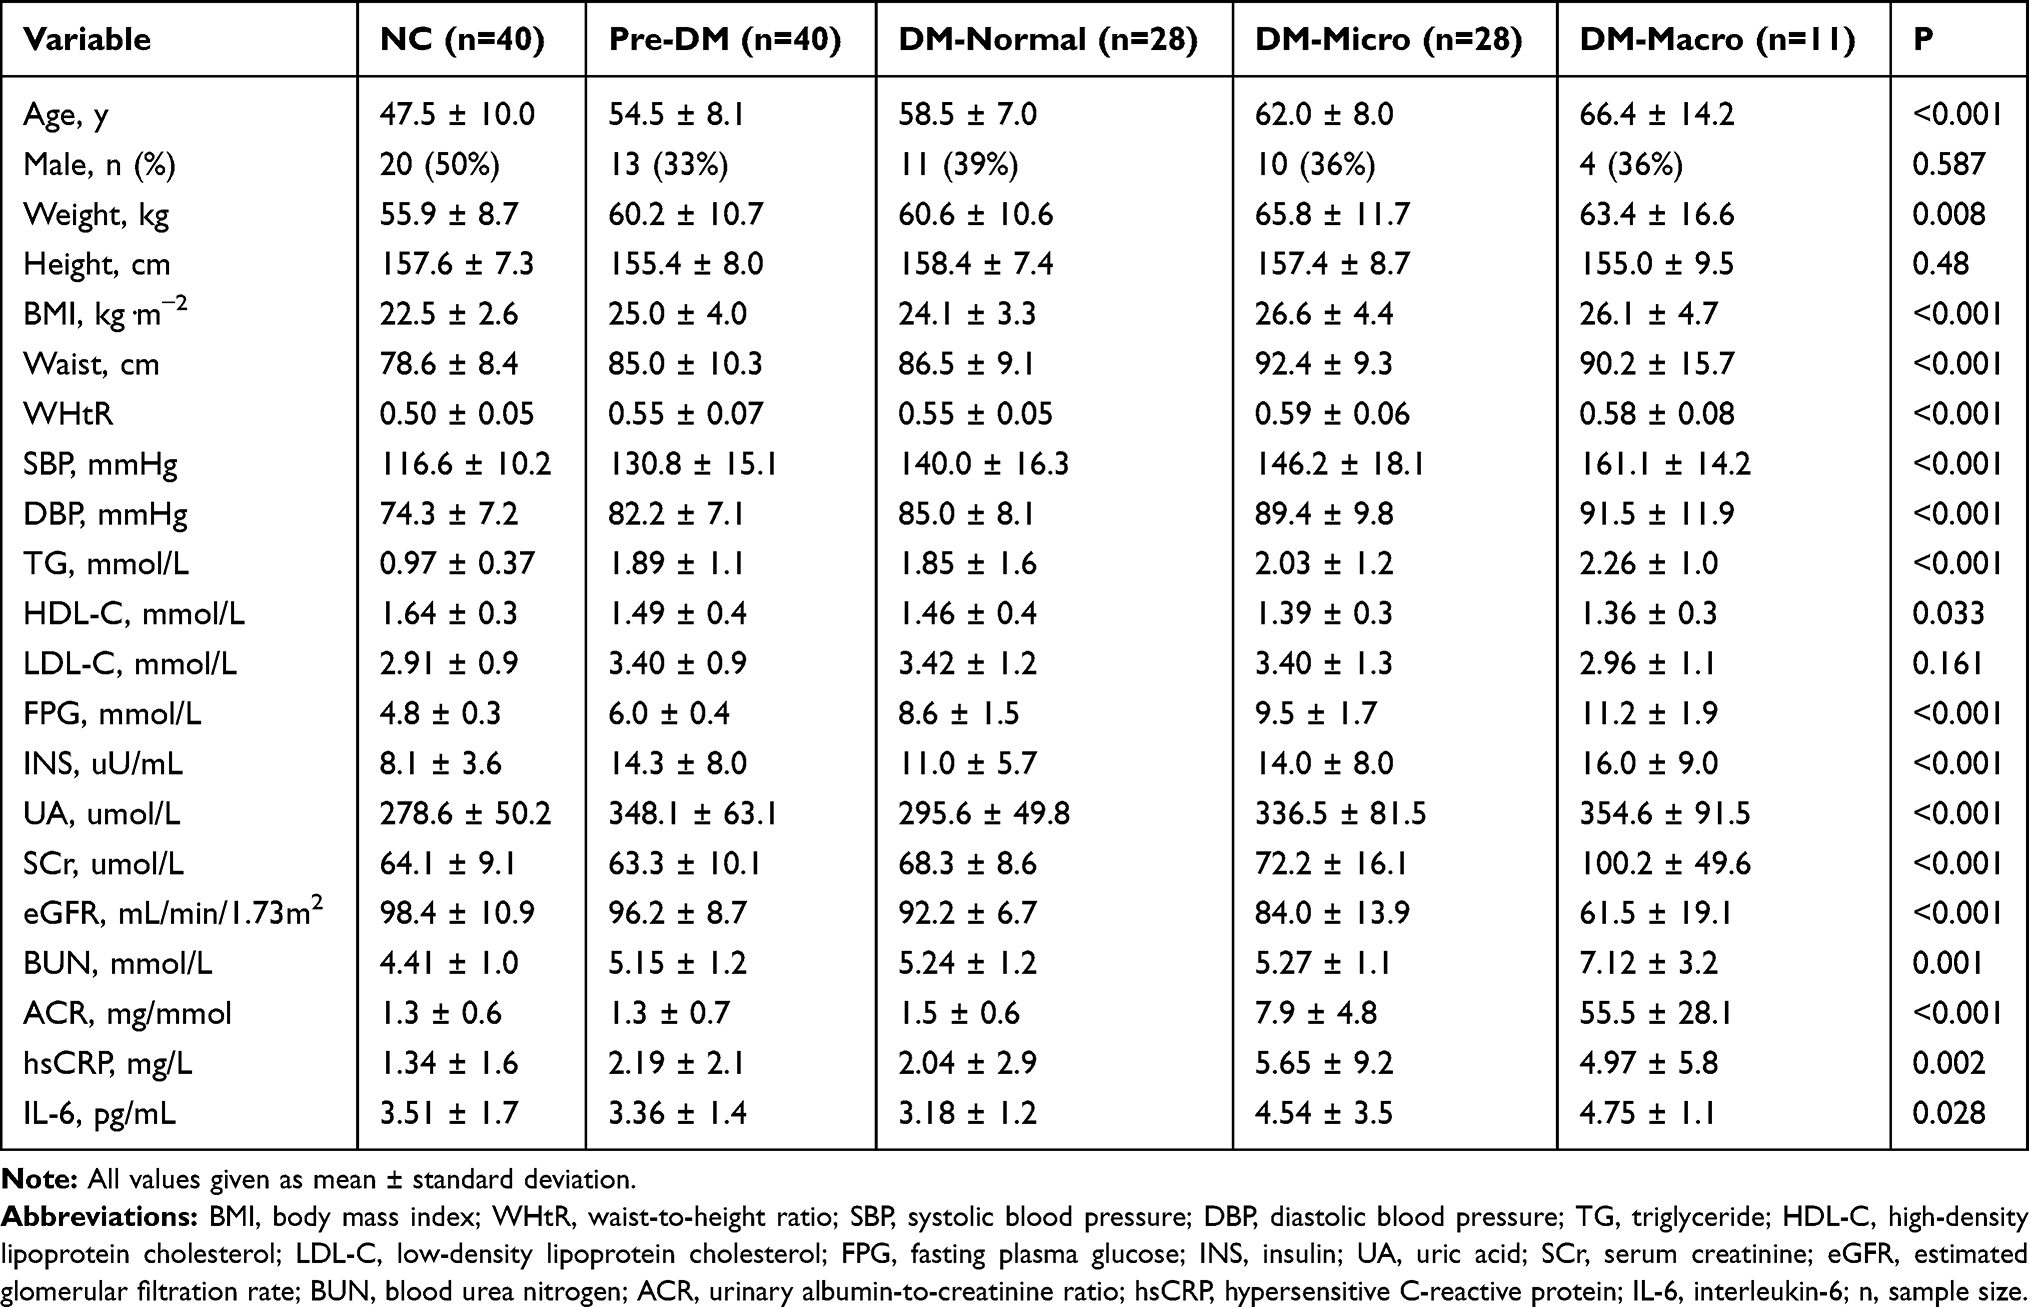 |
Table 1 Demographic and Clinical Characteristics of Subjects |
Characteristics of Urinary Extracellular Vesicles
Isolation of extracellular vesicles from urine is presently a non-specific, tedious, and complicated process. To determine the effectiveness of the extraction method and observe the distribution and concentration of UEVs, the extracted UEVs were analyzed using Nanoparticle Tracking Analysis (NTA) and Transmission Electron Microscope (TEM). The size and concentration of UEVs in different groups detected through NTA are shown in Table 2. There were no statistically significant differences in size and concentration of UEVs between healthy subjects, pre-diabetic patients, and diabetic patients in different degrees across the study. As shown in Figure 1A, the size of these nanoparticles had a maximum peak value of 120.7 ± 9.2 nm, and most of them were less than 300 nm in size, which conformed to the diameter range of extracellular vesicles (100–300 nm). In addition, the TEM analysis revealed that the isolated UEVs were round or oval in shape of variable sizes, which formed an intact continuous bilayer membrane about 120 nm in diameter at high magnification (Figure 1B). This conformed a typical morphological characteristic of extracellular vesicles.
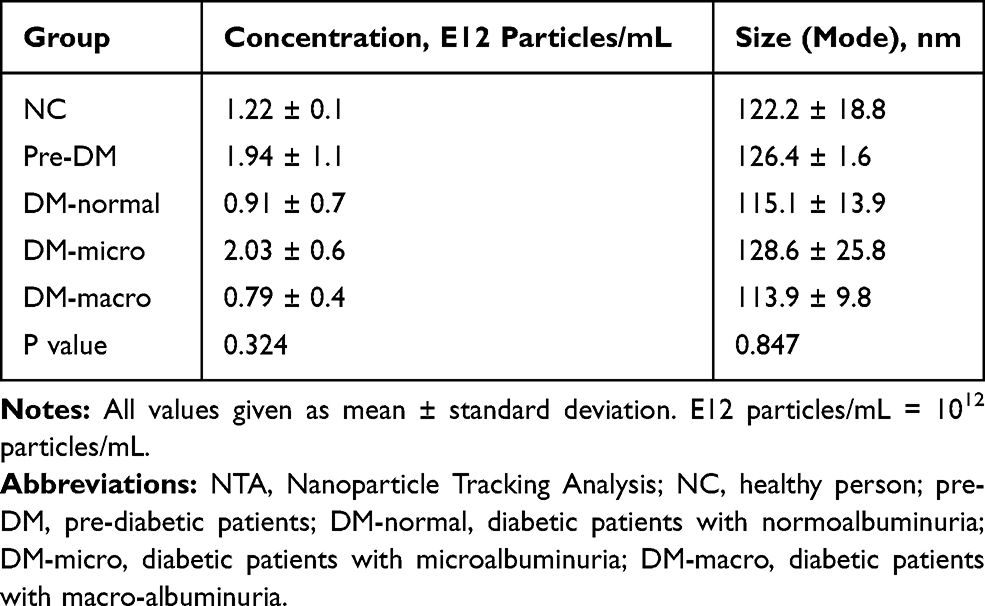 |
Table 2 Comparison of Size and Concentration Through NTA |
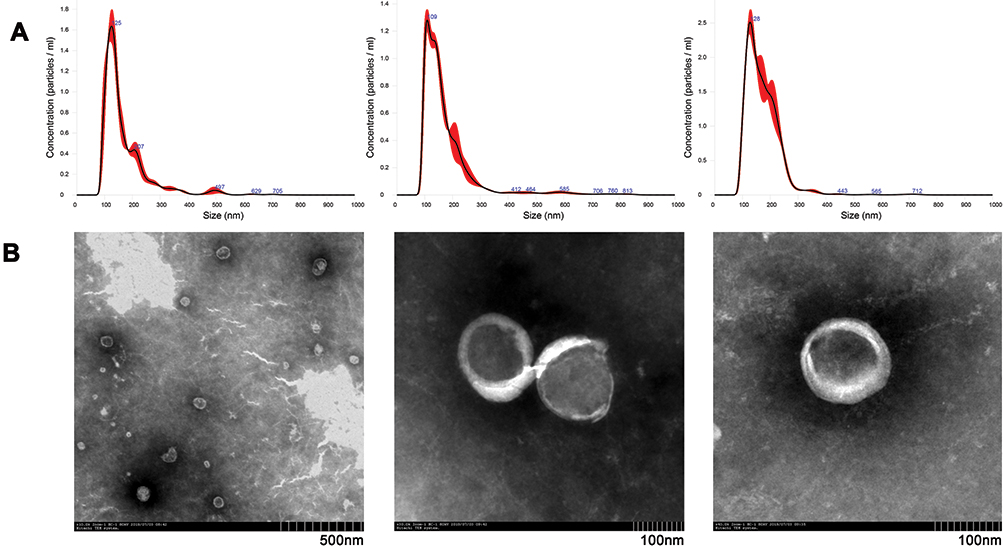 |
Figure 1 Characteristics of three representative urinary extracellular vesicles observed by Nanoparticle Tracking Analysis (NTA) and Transmission Electron Microscope (TEM). (A) The distribution and concentration of urinary extracellular vesicles were evaluated using NTA. (B) Electron morphology of urinary extracellular vesicles under TEM. The original magnification was ×10.0k, ×30.0k, ×40.0k in sequence from left to right. |
Differential Expression of α1-AT in UEVs from Participants
The UEVs samples were analyzed by Western blot with antibodies specific to alpha1-antitrypsin (α1-AT) and tumor susceptibility gene 101 (TSG101), a well-characterized extracellular vesicles marker (Figure 2A).33 TSG101 was expressed in all groups and used as the internal standard. We considered the ratio of gray values between α1-AT and TSG101 in each group as their relative expression of α1-AT. Based on the statistical analysis of more than three Western blots (Figure 2B), α1-AT was not found in the UEVs of either healthy subjects (NC) or pre-diabetic patients (pre-DM). However, expression increased significantly in the UEVs of diabetic patients with normoalbuminuria (ahead of microalbuminuria). The expression of α1-AT in UEVs was upregulated with the emergence and progression of albuminuria, indicating that α1-AT might serve as a diagnostic and monitoring indicator for diabetic kidney disease.
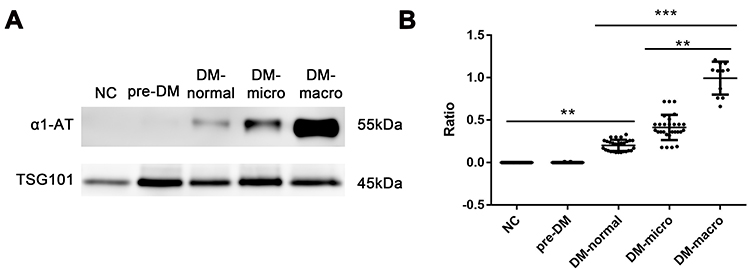 |
Figure 2 Different expression of α1-AT and TSG101 in urinary extracellular vesicles from different groups. (A) Western blot analysis for α1-AT and TSG101 in UEVs from each group. (B) Statistical analysis for the ratios of gray values between α1-AT and TSG101 in different groups from results of Western blot experiments (n=40, 40, 28, 28, 11 in each group, respectively). Ratio=gray value of α1-AT/TSG101. **P<0.01, ***P<0.001. Abbreviations: NC, healthy person; pre-DM, pre-diabetic patients; DM-normal, diabetic patients with normoalbuminuria; DM-micro, diabetic patients with microalbuminuria; DM-macro, diabetic patients with macro-albuminuria. |
Impact of Increasing Glucose Concentration and Osmotic Pressure on HK-2 Cells
To elucidate the mechanisms of α1-AT secretion from proximal tubular epithelial cells, we examined both protein and mRNA expression of α1-AT in cultured HK-2 cells under high glucose and hypertonic stimulation (Figure 3A). The expression of α1-AT was presented at basal levels in the normal control group (NC), and upregulated with increasing glucose concentration stimulation both at the protein and at the genetic level. On the other hand, mannitol stimulation, used as an osmotic pressure control group (OP), led to a slightly lower expression of α1-AT compared with that in 45mM high glucose. Moreover, we detected cell viability using CCK-8 analysis and analyzed the mRNA expression of inflammatory factors such as monocyte chemotactic protein 1 (MCP-1) and tumor necrosis factor-α (TNF-α) in HK-2 cells under various glucose concentrations by quantitative RT-PCR, to verify whether high glucose has a damaging effect on renal tubular epithelial cells and is capable of inducing a cellular inflammatory response. CCK-8 analysis showed that the viability of HK-2 cells gradually decreased in increasing glucose concentrations. However, viability only slightly decreased in the osmotic pressure control group (Figure 3B), confirming that high glucose harms renal tubular epithelial cells. On the other hand, quantitative RT-PCR analysis showed that high glucose stimulation significantly upregulated the expression of MCP-1 and TNF-α mRNA in a dose-dependent manner (Figure 3C and D).
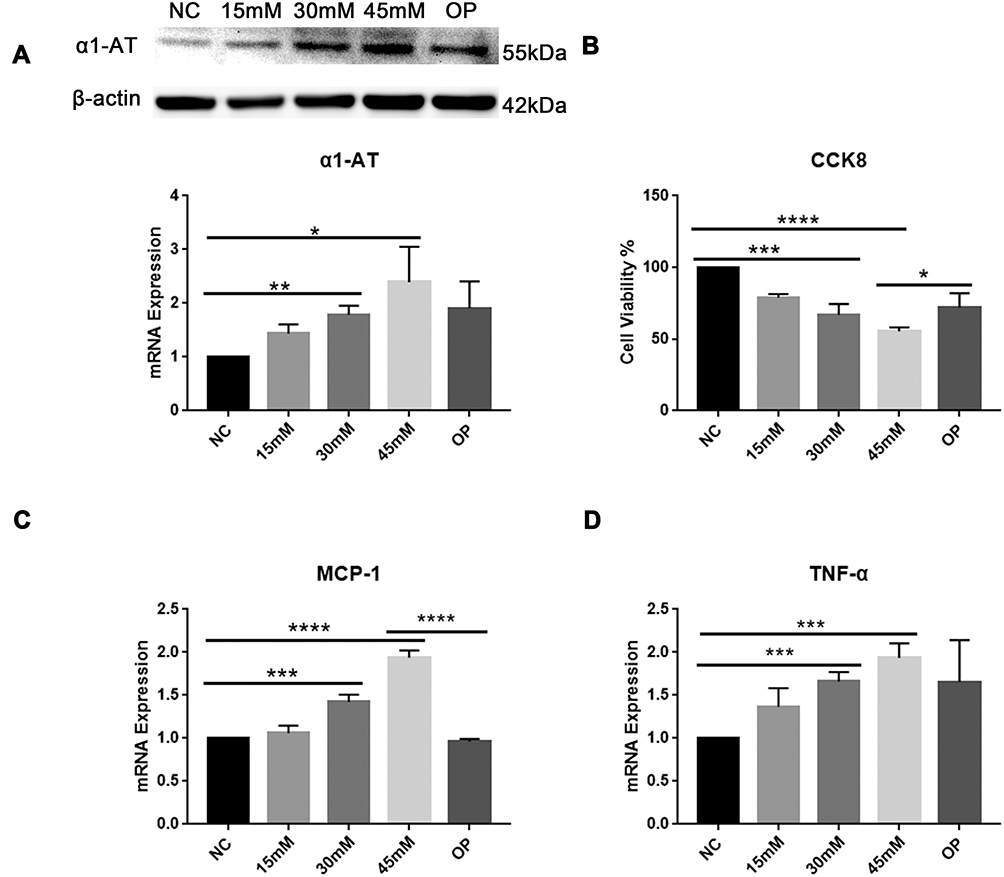 |
Figure 3 Impact of increasing glucose concentration and osmotic pressure on HK-2 cells. (A) The expression of α1-AT protein and mRNA levels were analyzed by Western blot and quantitative RT-PCR (qRT-PCR), respectively. (B) Cell viability of HK-2 cells in each group using CCK-8 analysis. (C and D) qRT-PCR analysis for expression of inflammatory factors such as MCP-1 and TNF-α in HK-2 cells. NC: normal control group (5.5mM glucose); 15mM: 15mM glucose; 30mM: 30mM glucose; 45mM: 45mM glucose; OP: osmotic pressure control group (5.5mM glucose+39.5mM mannitol). *P<0.05, **P<0.01, ***P<0.001, ****P<0.0001. |
The Role of α1-AT in Inflammation in Diabetic Kidney Disease
To explore the function of α1-AT in the inflammatory process of diabetic kidney disease, we stimulated cultured HK-2 cells in vitro with 30 mM high glucose solution to mimic diabetic kidney injury, and silenced the expression of α1-AT using cell transfection to observe the differential expression of inflammatory factors. As shown in Figure 4A, the expression of α1-AT protein and mRNA was significantly upregulated in the high glucose stimulation condition, as compared with the normal control group, but presented a significant decline after treating with α1-AT siRNA, which exhibited an excellent transfection efficiency. In addition, high glucose stimulation significantly increased the expression of inflammatory factors, such as MCP-1 and TNF-α, while the expression was just slightly upregulated compared with the normal control group after cell transfection (Figure 4B). The above differences were statistically significant, indicating that α1-AT could promote the expression of inflammatory factors MCP-1 and TNF-α in HK-2 cells under high glucose stimulation.
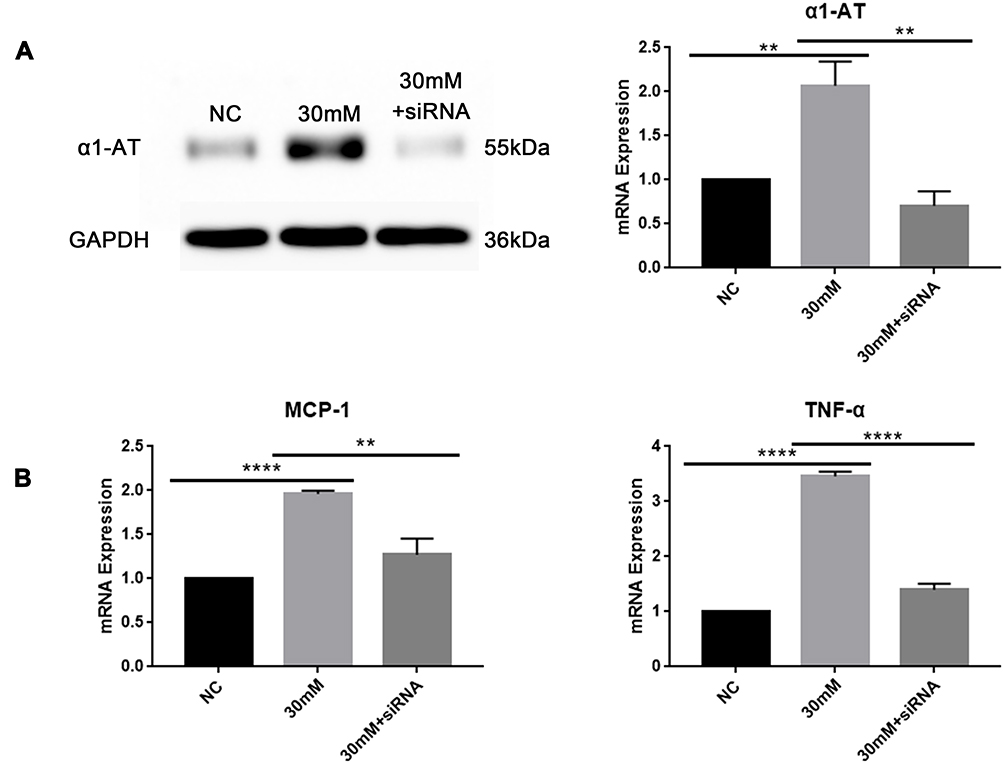 |
Figure 4 Effects of α1-AT siRNA transfection on HK-2 cells under high glucose stimulation. (A) Western blot and qRT-PCR analysis for transfection efficiency of α1-AT siRNA in HK-2 cells stimulating with high glucose. (B) Differential expression of MCP-1 and TNF-α mRNA levels in HK-2 cells treating with α1-AT siRNA transfection under high glucose stimulation measured by qRT-PCR. NC: normal glucose (5.5mM) with Negative Control siRNA; 30mM: high glucose (30mM) with Negative Control siRNA; 30mM+siRNA: high glucose (30mM) with α1-AT siRNA. **P<0.01, ****P<0.0001. |
Discussion
Diabetic kidney disease is a clinical syndrome characterized by persistent albuminuria, and/or a decline in estimated glomerular filtration rate (eGFR, <60mL/min/1.73m2) in patients with diabetes mellitus. It is often accompanied by raised arterial blood pressure and enhanced cardiovascular morbidity and mortality. In our cross-sectional study, we found that patients with diabetic kidney disease were more likely to suffer from a series of risk factors of metabolic syndromes, such as overweight, central obesity, and lipid metabolism disorders (abnormal metabolism of TG and HDL-C), and had a higher prevalence of hypertension and hyperuricemia, which has a similar pathogenesis to diabetic kidney disease. In addition, we also found that the progression of diabetic kidney injury was positively correlated with the expression levels of FPG, insulin, and inflammation indicators (hsCRP and IL-6) in patients with DKD. In the present clinical application, albuminuria is generally classified based on the value of the albumin-to-creatinine ratio (ACR) in a single urine sample or the excretion of urinary albumin in 24-hours urine samples. Although microalbuminuria is the most widely used clinical indicator for the early diagnosis of DKD, there are limits of its diagnostic accuracy for DKD since albumin excretion is susceptible to the external environment,34 and might be posterior to the structural damage of kidney.35–37 Furthermore, microalbuminuria is not specific for the diagnosis of DKD as it can also occur in non-diabetic patients with progressive chronic kidney disease and under some circumstances, including high protein diet, infection, fever, urinary tract infection, and congestive heart failure.7 Of note, renal biopsy is the most reliable diagnostic method for DKD, but it is not feasible to conduct biopsies for all diabetic patients or use it to assess disease progression due to its invasiveness and other factors. Therefore, there is an urgent need to identify more specific and sensitive biomarkers that can accurately predict patients’ susceptibility to DKD and assess the risk of progressing to end-stage renal disease.
Extracellular vesicles have been studied extensively in recent years. These vesicles may carry a variety of molecules with meaningful biological information. Urinary extracellular vesicles are emerging as an ideal noninvasive specimen source for potential biomarkers of kidney diseases owing to their easy accessibility and capacity to directly reflect the real-time status of tissue inflammation and kidney damage. No standardized technologies have until now been developed to isolate and purify UEVs owing to their complexity and variation. The most common approaches include ultracentrifugation, density gradient isolation using sucrose, ultrafiltration, antibody-based affinity capture, and polymer-based precipitation.38 We used ultracentrifugation to extract UEVs in this study. We effectively separated extracellular vesicles from contaminants as confirmed by nanoparticle tracking analysis, transmission electron microscope, and Western blot. Besides, there were no statistically significant differences in the size and concentration of UEVs between healthy subjects, pre-diabetic patients, and diabetic patients at various degrees of the disease in our study.
In a preliminary experiment, we characterized the association between five candidate markers of urinary extracellular vesicles and kidney function in patients with diabetic kidney disease. Among the five biomarkers, such as prostaglandin-H2D-isomerase (PTGDS), matrix metalloproteinase 9 (MMP9), alpha1-microglobulin (α1-MG), alpha1-antitrypsin (α1-AT) and clusterin (CLU), only the expression of α1-AT derived from UEVs could predict diabetic kidney injury before microalbuminuria using Western blot assays. In healthy conditions, as well as impaired fasting glucose or abnormal glucose tolerance, α1-AT was not expressed in UEVs. However, α1-AT derived from UEVs increased in diabetic patients with normoalbuminuria, while only a part of those patients presented with abnormal renal function examinations (SCr, eGFR, BUN). Moreover, the expression of α1-AT gradually increased in UEVs with the aggravation of diabetic kidney disease and the decline in renal function. These results indicate that α1-AT derived from urinary extracellular vesicles could potentially be an early diagnostic and prognostic biomarker of diabetic kidney disease prior to microalbuminuria and a more stable and sensitive indicator of diabetic kidney injury than eGFR or SCr. Studies from Carlson’s and Liew’s teams showed that α1-AT could be detected in renal tubular epithelial cells by immunohistochemistry.39,40 However, it has not been reported whether high glucose stimulation could directly induce renal tubular epithelial cells to produce α1-AT. We showed in vitro that α1-AT expression is low in tubular epithelial cells in normal glucose concentrations, but increases with higher glucose stimulation. Our data suggest that renal tubular epithelial cells can secrete α1-AT even in the physiological steady-state, and high glucose stimulation can effectively activate the inflammatory response, thereby promoting the secretion of inflammatory factors MCP-1 and TNF-α in tubular epithelial cells. Inflammation can further induce the upregulation of α1-AT, which may excrete into urine through extracellular vesicles only when renal function is impaired, allowing detection in UEVs. We also found that with the aggravation of diabetic kidney damage, the levels of FPG and inflammatory indicators (hsCRP and IL-6) in patients with DKD gradually increased, and the expression of α1-AT in UEVs was significantly upregulated, consistent with the results of cell experiments.
To further investigate the regulatory role of α1-AT in the inflammatory process of renal tubular epithelial cells in diabetic kidney disease, we silenced the expression of α1-AT in tubular epithelial cells and found that the mRNA expression of MCP-1 and TNF-α significantly decreased under high glucose stimulation. This indicates that α1-AT may promote the expression of MCP-1 and TNF-α in renal tubular epithelial cells in diabetic kidney disease. It also suggests that blocking the production of α1-AT in tubular epithelial cells might be a new approach to delay the progression of DKD by diminishing the inflammatory process involved. At present, several studies have shown that α1-AT plays an anti-inflammatory role in the development of chronic inflammation and some diseases.41 However, our research shows that the inflammatory factors MCP-1 and TNF-α significantly decrease when the generation of α1-AT in tubular epithelial cells during the inflammatory process is inhibited. These discrepancies may be due to variation between study subjects, research methods, interventions and observed indexes. Additionally, there might be other factors in the α1-AT to MCP-1/TNF-α pathways involved in renal tubular epithelial cells in diabetic kidney disease, which requires further comprehensive research to explore the underlying mechanisms.
Conclusion
Urinary extracellular vesicles are nanoparticles released from the urinary tract containing information of the cells of origin. Our study is the first to find that the expression of α1-AT in UEVs increased significantly in diabetic patients with normoalbuminuria, and was gradually upregulated with the progression of diabetic kidney disease. Our data thus suggested that α1-AT derived from UEVs, could be used as a potential noninvasive biomarker for the diagnosis of DKD prior to microalbuminuria and may predict a future decline in renal function. In vitro, α1-AT could promote the expression of MCP-1 and TNF-α in renal tubular epithelial cells in DKD, which suggested that α1-AT played a role in the inflammatory process involved in the progression of DKD. Due to the limitation of the number of patients recruited in our research, further verification in prospective cohorts with more subjects is thus warranted.
Acknowledgments
This work was supported by Science and Technique Program of Guangzhou (201604020015); Risk factors and prediction model of chronic kidney disease caused by metabolic syndrome: A multicentric prospective cohort study Clinical trial training project of Southern Medical University (LC2016PY047); South Wisdom Valley Innovative Research Team Program (CXTD-004) and The National Nature Science Foundation of China (81873620).
Disclosure
The authors report no conflicts of interest in this work.
References
1. Rahelic D. [7TH EDITION OF IDF DIABETES ATLAS–CALL FOR IMMEDIATE ACTION]. Lijec Vjesn. 2016;138(1–2):57–58.
2. Holman N, Young B, Gadsby R. Current prevalence of Type 1 and Type 2 diabetes in adults and children in the UK. Diabet Med. 2015;32(9):1119–1120. doi:10.1111/dme.12791
3. Bruno G, Runzo C, Cavallo-Perin P, et al. Incidence of type 1 and type 2 diabetes in adults aged 30–49 years: the population-based registry in the province of Turin, Italy. Diabetes Care. 2005;28(11):2613–2619. doi:10.2337/diacare.28.11.2613
4. Marshall SM. Recent advances in diabetic nephropathy. Postgrad Med J. 2004;80(949):624–633. doi:10.1136/pgmj.2004.021287
5. Chavers BM, Bilous RW, Ellis EN, Steffes MW, Mauer SM. Glomerular lesions and urinary albumin excretion in type I diabetes without overt proteinuria. N Engl J Med. 1989;320(15):966–970. doi:10.1056/NEJM198904133201503
6. Fioretto P, Steffes MW, Mauer M. Glomerular structure in nonproteinuric IDDM patients with various levels of albuminuria. Diabetes. 1994;43(11):1358–1364. doi:10.2337/diab.43.11.1358
7. Glassock RJ. Is the presence of microalbuminuria a relevant marker of kidney disease? Curr Hypertens Rep. 2010;12(5):364–368. doi:10.1007/s11906-010-0133-3
8. Caramori ML, Fioretto P, Mauer M. The need for early predictors of diabetic nephropathy risk: is albumin excretion rate sufficient? Diabetes. 2000;49(9):1399–1408. doi:10.2337/diabetes.49.9.1399
9. Li Y, Xu X, Tang X, et al. MicroRNA expression profile of urinary exosomes in Type IV lupus nephritis complicated by cellular crescent. J Biol Res (Thessalon). 2018;25:16. doi:10.1186/s40709-018-0088-0
10. Burger D, Schock S, Thompson CS, Montezano AC, Hakim AM, Touyz RM. Microparticles: biomarkers and beyond. Clin Sci (Lond). 2013;124(7):423–441. doi:10.1042/CS20120309
11. van der Pol E, Boing AN, Harrison P, Sturk A, Nieuwland R. Classification, functions, and clinical relevance of extracellular vesicles. Pharmacol Rev. 2012;64(3):676–705. doi:10.1124/pr.112.005983
12. Pisitkun T, Shen RF, Knepper MA. Identification and proteomic profiling of exosomes in human urine. Proc Natl Acad Sci U S A. 2004;101(36):13368–13373. doi:10.1073/pnas.0403453101
13. Campbell CR, Berman AE, Weintraub NL, Tang YL. Electrical stimulation to optimize cardioprotective exosomes from cardiac stem cells. Med Hypotheses. 2016;88:6–9. doi:10.1016/j.mehy.2015.12.022
14. Gudehithlu KP, Hart P, Joshi A, et al. Urine exosomal ceruloplasmin: a potential early biomarker of underlying kidney disease. Clin Exp Nephrol. 2019;23(8):1013–1021. doi:10.1007/s10157-019-01734-5
15. Garcia-Garcia PM, Getino-Melian MA, Dominguez-Pimentel V, Navarro-Gonzalez JF. Inflammation in diabetic kidney disease. World J Diabetes. 2014;5(4):431–443. doi:10.4239/wjd.v5.i4.431
16. Donate-Correa J, Martin-Nunez E, Muros-de-Fuentes M, Mora-Fernandez C, Navarro-Gonzalez JF. Inflammatory cytokines in diabetic nephropathy. J Diabetes Res. 2015;948417. doi:10.1155/2015/948417.
17. Alicic RZ, Johnson EJ, Tuttle KR. Inflammatory mechanisms as new biomarkers and therapeutic targets for diabetic kidney disease. Adv Chronic Kidney Dis. 2018;25(2):181–191. doi:10.1053/j.ackd.2017.12.002
18. Aoshiba K, Nagai A, Ishihara Y, Kagawa J, Takizawa T. Effects of alpha 1-proteinase inhibitor on chemotaxis and chemokinesis of polymorphonuclear leukocytes: its possible role in regulating polymorphonuclear leukocyte recruitment in human subjects. J Lab Clin Med. 1993;122(3):333–340.
19. Jeannin P, Lecoanet-Henchoz S, Delneste Y, Gauchat JF, Bonnefoy JY. Alpha-1 antitrypsin up-regulates human B cell differentiation selectively into IgE- and IgG4- secreting cells. Eur J Immunol. 1998;28(6):1815–1822. doi:10.1002/(SICI)1521-4141(199806)28:06<1815::AID-IMMU1815>3.0.CO;2-5
20. She QB, Mukherjee JJ, Crilly KS, Kiss Z. alpha(1)-antitrypsin can increase insulin-induced mitogenesis in various fibroblast and epithelial cell lines. FEBS Lett. 2000;473(1):33–36. doi:10.1016/s0014-5793(00)01492-7
21. Ikari Y, Mulvihill E, Schwartz SM. alpha 1-Proteinase inhibitor, alpha 1-antichymotrypsin, and alpha 2-macroglobulin are the antiapoptotic factors of vascular smooth muscle cells. J Biol Chem. 2001;276(15):11798–11803. doi:10.1074/jbc.M008503200
22. Molmenti EP, Perlmutter DH, Rubin DC. Cell-specific expression of alpha 1-antitrypsin in human intestinal epithelium. J Clin Invest. 1993;92(4):2022–2034. doi:10.1172/JCI116797
23. Cichy J, Potempa J, Travis J. Biosynthesis of alpha1-proteinase inhibitor by human lung-derived epithelial cells. J Biol Chem. 1997;272(13):8250–8255. doi:10.1074/jbc.272.13.8250
24. Perlmutter DH, Cole FS, Kilbridge P, Rossing TH, Colten HR. Expression of the alpha 1-proteinase inhibitor gene in human monocytes and macrophages. Proc Natl Acad Sci USA. 1985;82(3):795–799. doi:10.1073/pnas.82.3.795
25. Bashir MS, Jones DB, Wright DH. Alpha-1 anti-trypsin and CD30 expression occur in parallel in activated T cells. Clin Exp Immunol. 1992;88(3):543–547. doi:10.1111/j.1365-2249.1992.tb06484.x
26. Fischer DC, Siebertz B, van de Leur E, et al. Induction of alpha1-antitrypsin synthesis in human articular chondrocytes by interleukin-6-type cytokines: evidence for a local acute-phase response in the joint. Arthritis Rheum. 1999;42(9):1936–1945. doi:10.1002/1529-0131(199909)42:9<1936::AID-ANR20>3.0.CO;2-K
27. Tang GY, Chen YF, Zhang M, Rui HL, Cong X, Lou JN. [Expression of alpha 1 anti-trypsin in proximal tubular epithelial cell line]. Zhonghua Yi Xue Za Zhi. 2006;86(22):1540–1544.
28. Seino Y, Nanjo K, Tajima N, et al. Report of the committee on the classification and diagnostic criteria of diabetes mellitus. J Diabetes Investig. 2010;1(5):212–228. doi:10.1111/j.2040-1124.2010.00074.x
29. Ma YC, Zuo L, Chen JH, et al. Modified glomerular filtration rate estimating equation for Chinese patients with chronic kidney disease. J Am Soc Nephrol. 2006;17(10):2937–2944. doi:10.1681/ASN.2006040368
30. Ashwell M, Hsieh SD. Six reasons why the waist-to-height ratio is a rapid and effective global indicator for health risks of obesity and how its use could simplify the international public health message on obesity. Int J Food Sci Nutr. 2005;56(5):303–307. doi:10.1080/09637480500195066
31. Lamacchia O, Pinnelli S, Camarchio D, et al. Waist-to-height ratio is the best anthropometric index in association with adverse cardiorenal outcomes in type 2 diabetes mellitus patients. Am J Nephrol. 2009;29(6):615–619. doi:10.1159/000194454
32. Ashwell M, Gunn P, Gibson S. Waist-to-height ratio is a better screening tool than waist circumference and BMI for adult cardiometabolic risk factors: systematic review and meta-analysis. Obes Rev. 2012;13(3):275–286. doi:10.1111/j.1467-789X.2011.00952.x
33. Koritzinsky EH, Street JM, Chari RR, et al. Circadian variation in the release of small extracellular vesicles can be normalized by vesicle number or TSG101. Am J Physiol Renal Physiol. 2019;317(5):F1098–F1110. doi:10.1152/ajprenal.00568.2017
34. Tuttle KR, Bakris GL, Bilous RW, et al. Diabetic kidney disease: a report from an ADA consensus conference. Diabetes Care. 2014;37(10):2864–2883. doi:10.2337/dc14-1296
35. Currie G, McKay G, Delles C. Biomarkers in diabetic nephropathy: present and future. World J Diabetes. 2014;5(6):763–776. doi:10.4239/wjd.v5.i6.763
36. Kramer HJ, Nguyen QD, Curhan G, Hsu CY. Renal insufficiency in the absence of albuminuria and retinopathy among adults with type 2 diabetes mellitus. JAMA. 2003;289(24):3273–3277. doi:10.1001/jama.289.24.3273
37. MacIsaac RJ, Tsalamandris C, Panagiotopoulos S, Smith TJ, McNeil KJ, Jerums G. Nonalbuminuric renal insufficiency in type 2 diabetes. Diabetes Care. 2004;27(1):195–200. doi:10.2337/diacare.27.1.195
38. Merchant ML, Rood IM, Deegens J, Klein JB. Isolation and characterization of urinary extracellular vesicles: implications for biomarker discovery. Nat Rev Nephrol. 2017;13(12):731–749. doi:10.1038/nrneph.2017.148
39. Carlson JA, Rogers BB, Sifers RN, Hawkins HK, Finegold MJ, Woo SL. Multiple tissues express alpha 1-antitrypsin in transgenic mice and man. J Clin Invest. 1988;82(1):26–36. doi:10.1172/JCI113580
40. Liew CT. Alpha-1-antitrypsin in the renal tubular epithelium in patients with or without alpha-1-antitrypsin deficiency. Changgeng Yi Xue Za Zhi. 1990;13(1):1–9.
41. Janciauskiene S, Wrenger S, Immenschuh S, et al. The multifaceted effects of alpha1-antitrypsin on neutrophil functions. Front Pharmacol. 2018;9:341. doi:10.3389/fphar.2018.00341
 © 2020 The Author(s). This work is published and licensed by Dove Medical Press Limited. The
full terms of this license are available at https://www.dovepress.com/terms
and incorporate the Creative Commons Attribution
- Non Commercial (unported, 3.0) License.
By accessing the work you hereby accept the Terms. Non-commercial uses of the work are permitted
without any further permission from Dove Medical Press Limited, provided the work is properly
attributed. For permission for commercial use of this work, please see paragraphs 4.2 and 5 of our Terms.
© 2020 The Author(s). This work is published and licensed by Dove Medical Press Limited. The
full terms of this license are available at https://www.dovepress.com/terms
and incorporate the Creative Commons Attribution
- Non Commercial (unported, 3.0) License.
By accessing the work you hereby accept the Terms. Non-commercial uses of the work are permitted
without any further permission from Dove Medical Press Limited, provided the work is properly
attributed. For permission for commercial use of this work, please see paragraphs 4.2 and 5 of our Terms.