Back to Journals » Journal of Inflammation Research » Volume 15
Alpha-Momorcharin Inhibits Proinflammatory Cytokine Expression by M1 Macrophages but Not Anti-Inflammatory Cytokine Expression by M2 Macrophages
Authors Peng K, Deng N, Meng Y, He Q, Meng H, Luo T, Wei Y, Kang Y, Zhou X, Shen F
Received 3 June 2022
Accepted for publication 18 August 2022
Published 24 August 2022 Volume 2022:15 Pages 4853—4872
DOI https://doi.org/10.2147/JIR.S372306
Checked for plagiarism Yes
Review by Single anonymous peer review
Peer reviewer comments 2
Editor who approved publication: Professor Ning Quan
Kejun Peng,1,* Nianhua Deng,1,* Yao Meng,1,* Qianchuan He,2 Hao Meng,3 Ting Luo,4 Yanru Wei,1 Yue Kang,1 Xiaodong Zhou,1 Fubing Shen1
1School of Laboratory Medicine, Chengdu Medical College, Chengdu, People’s Republic of China; 2Public Health Sciences Division, Fred Hutchinson Cancer Research Center, Seattle, WA, 98109, USA; 3PKU-IDG/McGovern Institute for Brain Research, Peking-Tsinghua Center for Life Sciences, Peking University School of Life Sciences, Beijing, People’s Republic of China; 4Wuhan Corebiolab Co., Ltd, Wuhan, People’s Republic of China
*These authors contributed equally to this work
Correspondence: Fubing Shen, School of Laboratory Medicine, Chengdu Medical College, No. 783 Xindu Avenue, Xindu District, Chengdu, 610500, People’s Republic of China, Tel +86 28 62739522, Email [email protected]
Background: Alpha-momorcharin (α-MMC) is a natural medicine derived from bitter melon and has been found to exert immunomodulatory effects. Our previous study indicated that α-MMC can regulate cytokine release from monocytes, but it remains unknown about its regulatory effect on different types of cytokines, such as inflammatory cytokines or anti-inflammatory cytokines.
Methods: LPS-induced M1-type macrophages model and IL-4-induced M2-type macrophages model were established, and the expression of proinflammatory cytokines and anti-inflammatory cytokines were assessed by ELISA after α-MMC was administered. Then, a LPS-induced acute pneumonia mouse model was established, the proinflammatory cytokines levels and inflammatory lesions in lung tissues were examined by ELISA or H&E staining. Furthermore, omics screening analysis and Western blotting verification were performed on TLR4 and JAK1-STAT6 signalling pathway-related proteins to elucidate the regulatory mechanism of α-MMC in those M1 macrophages and M2 macrophages.
Results: At a noncytotoxic dose of 0.3 μg/mL, α-MMC significantly inhibited the LPS-induced expression of inflammatory cytokines, such as TNF-α, IL-1β, IL-6, IL-8, MIP-1α and MCP-1, by M1 macrophages in a time-dependent manner, but α-MMC did not inhibit the IL-4-induced synthesis of anti-inflammatory cytokines, such as IL-10, IL-1RA, EGF, VEGF, TGF-β and CCL22, by M2 macrophages. Moreover, α-MMC also inhibited inflammatory cytokine expression in an LPS-induced acute pneumonia mouse model and alleviated inflammation in lung tissues. Furthermore, omics screening and Western blotting analysis confirmed that α-MMC inhibited TAK1/p-TAK1 and subsequently blocked the downstream MAPK and NF-κB pathways, thus inhibiting the LPS-induced inflammatory cytokine expression.
Conclusion: Our results reveal that α-MMC inhibits proinflammatory cytokine expression by M1 macrophages but not anti-inflammatory cytokine expression by M2 macrophages. The efficacy of α-MMC in selectively inhibiting proinflammatory cytokine expression renders it particularly suitable for the treatment of severe inflammation and autoimmune diseases characterized by cytokine storms.
Keywords: α-MMC, M1 macrophage, proinflammatory cytokine, TLR4-NF-κB/MAPK
Introduction
Alpha-momorcharin (α-MMC) is a type I ribosome-inactivating protein (RIP) that is purified from the seeds of Momordica charantia.1,2 In addition to its antitumor and antiviral effects, α-MMC also exerts immunomodulatory effects.3 It has been found that α-MMC can significantly inhibit macrophage activity, such as macrophage cytostatic and phagocytic activities. A single injection of a nontoxic dose of α-MMC into mice significantly suppressed delayed-type hypersensitivity responses as well as the production of humoral antibodies against sheep red blood cells, and the thioglycolate-induced migration of macrophage migration was inhibited in vivo. Recently, we also found that α-MMC can regulate cytokine expression in monocytes in vivo and in vitro.4–6 α-MMC exerted a significant effect on the induction of apoptosis and release of cytokines by THP-1 cells, but it exerted no effect on normal WIL2-s B cells and H9 T cells. Specifically, at a noncytotoxic dose, α-MMC regulates THP-1 cells by inhibiting IL-1β, IL-2, IL-8, IL-9, IL-12, MIP-1α/β, MCP-1 and TNF-α expression and enhancing IL-1rα and RANTES expression, resulting in the inhibition of cellular immune function. The regulation of cytokine expression in the THP-1 monocyte cell line mainly results in an immunosuppressive effect, and the regulation of THP-1 cell cytokine production may be the initial step in the immunosuppressive effect of α-MMC.
However, in THP-1 cells, the primary effects of α-MMC treatment are the promotion of IL-8, IL-9, MIP-1α, MIP-1β, and MCP-1 synthesis during the early phase (2–8 h) and the inhibition of the synthesis of these cytokines in the late phase (8–24 h), but it results in persistent induction of IL-1rα and RANTES expression and persistent inhibition of IL-1β and TNF-α expression.4 Our expert peers also reported that α-MMC can elevate MCP-1, IL-8, IL-1β and TNF-α levels and activate the IKK/NF-κB and JNK signalling pathways in THP-1 cells within 6 hours.7 These results suggest that α-MMC exerts a regulatory effect on the expression of cytokines in the native THP-1 cell line, but this regulatory effect first increases and then decreases the production of these cytokines, and there is uncertainty about the regulatory effect of α-MMC on different types of cytokines (such as inflammatory cytokines and anti-inflammatory cytokines). This uncertainty stems from the fact that the basal expression levels of cytokines in resting monocytes are not high, and the expression levels are also unstable Therefore, the results observed using the THP-1 cell line do not reflect the pharmacological value of α-MMC. It cannot be determined whether α-MMC exerts proinflammatory or anti-inflammatory effects.
During inflammation, monocytes migrate from blood vessels to the site of inflammation and differentiate into macrophages; macrophages phagocytose pathogenic microorganisms and become activated to synthesize and express high levels of proinflammatory cytokines, such as IL-1β, TNF-α, IL-6 and IL-8, to activate other immune cells and initiate inflammatory responses. Such inflammation-promoting macrophages are classified as M1 macrophages.8,9 M1-type macrophages, if hyperpolarized, overexpress inflammatory cytokines, thereby creating an inflammatory cytokine storm and leading to excessive inflammation. There is also a class of M2 macrophages, and the M2 phenotype is characterized by anti-inflammatory activity due to the release of anti-inflammatory factors, including IL-10, EGF, VEGF and TGF-β; these anti-inflammatory factors can suppress the proinflammatory response and promote angiogenesis and tissue repair in the later stages of inflammation.10 In this study, we used an LPS-induced M1-type macrophage model and an IL-4-induced M2-type macrophage model to observe the expression of cytokines in two polarized macrophage populations in order to determine whether α-MMC exerts anti-inflammatory immunomodulatory effects or plays a role in inflammatory recovery and tissue repair.
It has been reported that the LPS-mediated polarization of macrophages occurs through activation of the TLR4 receptor signalling pathway and that LPS promotes the expression of a large number of inflammatory cytokines through this pathway.11,12 Additionally, according to reports,13 IL-4 activates STAT6 via the IL-4 receptor (IL-4R1 and IL-4R2) to regulate M1/M2 polarization via a STAT6-dependent pathway in inflammatory diseases, and IL-4 switches the M1/M2 polarization of microglia/macrophage and alleviates neurological damage by modulating the JAK1/STAT6 pathway after intracerebral hemorrhage (ICH). Therefore, in this study, we selectively verified changes in the expression of TLR4 signalling pathway-related proteins by Western blotting to elucidate the mechanism by which α-MMC regulates inflammatory cytokine expression in M1 macrophages. We also selectively verified changes in the expression of JAK1-STAT6 signalling pathway-related proteins to elucidate the mechanism by which α-MMC regulates anti-inflammatory cytokine expression in M2 macrophages.
In addition, to further observe the immunomodulatory and anti-inflammatory effects of α-MMC in vivo, we established an LPS-induced acute pneumonia mouse model; in this mouse model, the levels of the inflammatory cytokines TNF-α, IL-1β, IL-6, MIP-1α and MCP-1 were measured after the administration of α-MMC, and pathological changes in mouse lung tissues were also observed. The results of this study lay the foundation for the use of α-MMC in the anti-inflammatory treatment of infectious diseases characterized by cytokine storms.
Materials and Methods
Preparation of α-MMC
Alpha-MMC protein was kindly provided by Professor Yanfa Meng from the College of Life Sciences of Sichuan University and was prepared as described by Mengen Li14 and Yao Meng.15
Cell Culture
The human monocyte cell line THP-1 (RRID: CVCL_0006) was purchased from Procell (Wuhan, China). The cells were grown in complete RPMI-1640 medium (Gibco, USA) supplemented with 10% heat inactivated foetal bovine serum, 100 U/mL penicillin and 100 µg/mL streptomycin (Thermo, USA) and incubated at 37℃ in humid air containing 5% CO2. The cells were cultured in suspension, the medium was exchanged, and the cells were passaged according to conventional methods.
Induction and Identification of Polarized Macrophages
To generate PMA-induced (M0) macrophages, approximately 1×10⁶ THP-1 cells were seeded in a 6-well plate, PMA (30 ng/mL) was added, and the cells were cultured for 72 h. The medium was changed to completely remove the floating cells, fresh medium (excluding PMA) was added, and the cells were cultured for 24 h. To generate M1 macrophages, LPS was added to M0 macrophages in six-well plates at a final concentration of 20 ng/mL, and the macrophages were cultured in complete RPMI-1640 medium supplemented with 10% foetal bovine serum for 48 h to induce macrophage polarization towards the inflammatory (M1) phenotype. To generate M2 macrophages, IL-4 was added to M0 macrophages in six-well plates at a final concentration of 20 ng/mL, and the macrophages were cultured in complete RPMI-1640 medium supplemented with 10% foetal bovine serum for 48 h to induce macrophage polarization towards the anti-inflammatory (M2) phenotype.
Using flow cytometry, M1-polarized macrophages and M2-polarized macrophages were identified by measuring the expression levels of the cell surface markers CD86 (M1 macrophages) and CD206 (M2 macrophages). In brief, the method was as follows. The cells were trypsinized, and the induced M0, M1 and M2 macrophages were collected. After washing with PBS, 20 µL of FITC-labelled M-H CD86 (557,343, BD company product) or APC-labelled M-H CD206 (561,763, BD company product) flow antibody was added and incubated in the dark for 10 min. After washing with PBS and fixing with 70% ethanol, 0.2 µL Triton X-100 (T9284-100mL, Sigma) and 5 µL PE-cyTM7 M-H CD11b (561,685, BD company product) flow antibody were added and incubated in the dark for 10 min. Detection was performed using a flow cytometer (CytoFLEX S, Beckman Coulter).
Using qPCR technology, M1-polarized macrophages and M2-polarized macrophages were identified by measuring the levels of an M1 polarization marker (nitric oxide synthase, iNOS) and an M2 polarization marker (arginase 1, ARG-1). In brief, the method was as follows. M0 macrophages, M1 macrophages and M2 macrophages were digested with trypsin and collected, and then, RNA was extracted using the TaKaRa MiniBEST Universal RNA Extraction Kit (Cat.# 9767, TaKaRa). After genome removal and reverse transcription, gene expression was measured by qRT–PCR. The primer sequences specific for the target gene are as follows: forward: 5’-GCTCTACACCTCCAATGTGACC-3’ and reverse: 5’-CTGCCGAGATTTGAGCCTCATG-3’ for iNOS; forward: 5’-TCATCTGGGTGGATGCTCACAC-3’ and reverse: 5’-GAGAATCCTGGCACATCGGGAA-3’ for ARG-1; forward: 5’-TCAAGAAGGTGGTGAAGCAGG-3’ and reverse: 5’-TCAAAGGTGGAGGAGTGGGT-3’ for GAPDH. All primers were provided by TaKaRa Biotech.
Apoptosis Analysis
The induction of M0 macrophages and polarized M1 and M2 macrophages was performed as described previously. Alpha-MMC was added to the cells in each well at doses of 0 μg, 0.1 μg/mL, 0.5 μg/mL and 2.5 μg/mL. After 8 hours of drug treatment, the cells were collected for apoptosis assessment by flow cytometry. In brief, the method was as follows. (1) The cells were collected (collected suspension cells and adherent cells together), the cells were centrifuged at 1000 rpm for 5 min, and the supernatants were removed; (2) the cells were washed once with PBS, the cells were centrifuged at 1000 rpm for 5 min, and the supernatants were removed; (3) Annexin Binding Buffer (10X) was diluted, and 100 µL was used to resuspend the cells; (4) 5 µL Annexin FITC was added and incubated in the dark at room temperature for 10 min; (5) 5 µL PI was added and incubated in the dark at room temperature for 15 min; (6) 150 µL Annexin Binding Buffer was added before the samples were analysed with the machine; and (7) the cells were analysed using a flow cytometer (CytoFLEX S, Beckman Coulter).
ELISA Analysis
The induction of M0 macrophages and polarized M1 and M2 macrophages was performed as described previously. Alpha-MMC was added to each group of cells at a concentration of 0.3 μg/mL, and the cells were treated for 0 h, 2 h, 8 h, 24 h and 48 h. Two wells were included in each experimental group. To harvest the cells, 5×10⁶ cells from each cell line were washed in RPMI twice, snap frozen in liquid nitrogen, and then thawed at 37℃. Snap freezing and thawing were repeated two more times. Cellular debris was then spun down, and the supernatant was saved for analysis (Kumar S, 2003). Quantitative ELISA was performed to measure the expression levels of TNF-α, IL-1β, IL-6, IL-8, MIP-1α, MCP-1, IL-1RA, IL-10, EGF, VEGF-A, TGF-β, and CCL22 in the cell supernatant. The following ELISA kits produced by Immunoway Co., Ltd. were used: Human TNF-α ELISA Kit (KE1372), Human IL-1β ELISA Kit (KE1379), Human IL-6 ELISA Kit (KE1368), Human IL-8 ELISA Kit (KE1360), Human MIP-1α ELISA Kit (KE 1052), Human MCP-1 ELISA Kit (KE1511), Human IL-1RA ELISA Kit (KE1030), Human IL-10 ELISA Kit (KE1369), Human EGF ELISA Kit (KE1012), Human VEGF-A ELISA Kit (KE1374), Human TGF-β ELISA Kit (KE1373), and Human CCL22 ELISA Kit (KE1203). The cytokine levels were analysed according to the manufacturer’s instructions. The OD value was measured at a wavelength of 450 nm with an EnVision microplate reader (PerkinElmer, Britain), and the content of each cytokine was calculated according to the corresponding standard curve.
Animals
Forty specific pathogen-free (SPF) Bagg albino (Balb)/c mice (male, 6–8 w) were provided by Charles River (Beijing, China). All the animal experiments were conducted in accordance with the ARRIVE 2.0 guidelines approved by the Animal Ethics Committee,16 and performed according to protocols approved by the Ethics Committee of Servicebio (Wuhan, China). The animals were housed in SPF animal rooms maintained at a temperature of 22–25℃ and a relative humidity of 50–70% on a 12 h light-dark cycle. They were provided ad libitum access to fresh water and a standard diet and were acclimatized for at least 7 days prior to the beginning of the studies.
Induction of Acute Lung Injury (ALI) in Mice
The animals were randomly divided into 5 groups (n=8): (1) the sham group with normal saline; (2) the LPS model group (8.0 mg/kg); (3) the LPS (8.0 mg/kg) + dexamethasone (3.0 mg/kg) treatment group; (4) the LPS (8.0 mg/kg) + α-MMC (0.1 mg/kg) treatment group; and (5) the LPS (8.0 mg/kg) + α-MMC (0.3 mg/kg) treatment group. The mice were weighed and anaesthetized with 1% sodium pentobarbital (50 mg/kg), and 50 µL of dissolved LPS (or NS for normal control mice) was injected into the trachea with a microinjector. The mice were shaken to the left and right to ensure that the drug was uniformly distributed in the lungs. After the mice were able to breathe normally, they were placed back in their cages and allowed to recover. The mice in the treatment group were intraperitoneally injected with dexamethasone or α-MMC 1 h after LPS injection, and the mice in the model group and normal control group were intraperitoneally injected with an equal volume of normal saline. Twenty-four hours after the first modelling procedure, the mice in each group were subjected to a second modelling and drug treatment procedure in the same way. Twenty-four hours after the second modelling and treatment procedure, the mice in each group were anaesthetized by pentobarbital sodium, blood samples were collected, and the animals were sacrificed by cervical dislocation. The left lungs were fixed with paraformaldehyde and prepared for paraffin embedding. The right lungs were quick-frozen in liquid nitrogen and stored at −80℃ for ELISA.
Analysis of Cytokine Levels in Plasma and Lung Tissue by ELISA
After anticoagulation, venous blood was collected from the ocular vein and centrifuged at −4℃ and 3000 rpm/min for 15 minutes, and the supernatant (plasma) was collected and stored at −80℃. Snap-frozen lung tissues were thawed and weighed, and then, 9 volumes of RIPA lysis buffer supplemented with protein inhibitor cocktail III (Merck Millipore, USA) was added at a weight (mg): volume (μL) ratio of 1:9 for homogenization. The lysis buffer was centrifuged at 4℃ and 4000 rpm/min for 10 minutes, and the supernatants were transferred to clean microcentrifuge tubes. Then, 20 µL of each supernatant was collected and diluted, and the protein concentration was measured by the BCA method. The remaining samples were placed in a refrigerator at 4℃. The TNF-α, IL-1β, IL-6, MIP-1α and MCP-1 levels in the plasma and lung tissue homogenates were measured using a mouse ELISA kit (ImmunoWay Biotech, USA) according to the user’s manual.
Histopathological Evaluation of ALI
Left lung tissues were used for microscopic analysis of pathological changes. The tissues were fixed in 4% buffered formalin for 24 h, dehydrated, embedded in paraffin, sectioned, stained with haematoxylin and eosin, and analysed with a Nikon Eclipse Ci microscope (Nikon Electronic Company, Osaka, Japan). Five fields containing 300 alveoli (10× magnification) from each slide were chosen, and the degree of lung injury was evaluated by an investigator who was blinded to the treatment groups. The severity of lung inflammation was semiquantitatively assessed according to the methods described by Tanino Y et al17 Briefly, the lung inflammation grade was scored on a scale of zero to five. The criteria for grading lung injury were as follows: grade 0, normal tissue; grade 1, minimal inflammatory change; grade 2, mild to moderate inflammatory changes (no obvious damage to the lung architecture); grade 3, moderate inflammatory injury (thickening of the alveolar septae); grade 4, moderate to severe inflammatory injury (formation of nodules or areas of pneumonitis that distorted the normal architecture); and grade 5, severe inflammatory injury with total obliteration of the field. Caseviewer 2.4 software was used to collect and process these images.
Phosphoproteomics and Proteomic Analysis
M0-type macrophages and LPS-induced (M1) macrophages were prepared as described previously. Three experimental groups, namely, the M0 macrophage group, LPS-induced macrophage (M1 0 h) group and α-MMC-treated (4 h) LPS-induced macrophage (M1 4 h) group, were established. Alpha-MMC was administered at a dose of 0.5 μg/mL, and 3 wells were included in each group. At the end of the experiment, the cells were washed 3 times with PBS, scraped off with a spatula, collected, and frozen in liquid nitrogen, and the protein concentration was quantified by the BCA method. Then, TMT labelling and LC–MS/MS analysis were completed by a professional team from Shanghai Applied Protein Technology Co., Ltd. (APTBIO). Proteome Discoverer 2.4 software was used to identify the phosphorylated proteins and quantify their levels, and the Complex heatmap package in R (R version 3.4) was used to classify the two dimensions of sample and protein expression and generate a hierarchical clustering heatmap. Then, KEGG Automatic Annotation Server (KAAS) software and Fisher’s exact method were used to analyse the distribution of KEGG pathways and generate the overall protein set and the target protein set.
Western Blotting Analysis
M1 macrophage differentiation was induced as described previously. M1 macrophages in six-well culture plates were divided into 3 groups, the α-MMC 0 h group, α-MMC 4 h group and α-MMC 8 h group, and the dose of α-MMC was 0.5 μg/mL. A total of 5 wells were included in each group. Then, cell lysates from each experimental group at each administration time point were harvested (RIPA lysis buffer), and the expression levels of the following proteins were measured by immunoblotting: TAK1/p-TAK1, NF-kB p65/p-p65, AP1/p-AP1, JNK/p-JNK and TRAF6. In brief, the method was as follows. The protein concentration was measured by the BCA method, 5× SDS loading buffer was added according to the volume of the lysate, and the samples were boiled at 100℃ for 5 min. The protein samples (20 μg) were separated with 10% SDS polyacrylamide gels and 5% SDS concentrating gels. The samples were electrotransferred onto PVDF membranes and blocked with 5% milk/TBST. After washing, the primary antibody was diluted with 1% BSA/TBST at the recommended dilution ratio and transferred to a hybridization bag together with the PVDF membrane. The samples were refrigerated at 4℃ overnight. The recommended dilution ratios for the primary antibodies are as follows: TRAF6 (Abcam, ab137452, RRID: AB_2884908), 1:1000; TAK1 (Immunoway, YT4535, RRID: AB_2895035), 1:1000; p-TAK1 (Immunoway, YP0424, RRID: AB_2895032), 1:600; NF-kB p65 (Abcam, ab32536, RRID: AB_776751), 1:2000; p-p65 (Abcam, ab76302, RRID: AB_1524028), 1:1000; JNK (Immunoway, YT2440, RRID: AB_2895034), 1:1000; p-JNK (Immunoway, YP0156, RRID: AB_2895031), 1:600; AP1 (Immunoway, YT0248, RRID: AB_2895033), 1:1000; and p-AP1 (Immunoway, YP0018, RRID: AB_2895030), 1:1000. Then, the samples were incubated with horseradish peroxidase-labelled goat anti-rabbit secondary antibody (1:5000, Proteintech, SA00001-2, RRID: AB_2722564) or horseradish peroxidase-labelled goat anti-mouse secondary antibody (1:5000, Proteintech, SA00001-1, RRID: AB_2722565) for 1 h and developed by the ECL chemiluminescence method. The bands were visualized using a chemiluminescence gel imager (ChemiDoc™ XRS+, Bio–Rad, USA), and a rabbit anti-human β-actin antibody (1:5000, Proteintech, 66009-1-Ig, RRID: AB_2687938) was used as an internal control. ImageJ software was used to measure the grey value of each band, and the ratio of the grey value of each target protein band to that of the β-actin band was calculated.
M0 macrophage and M2 macrophage differentiation was induced as described previously. The experiments were performed in the following groups: M0 macrophages treated for 8 h; M2 macrophages treated for 8 h; and M2 macrophages+α-MMC (0.5 μg/mL) treated for 8 h. At the end of the experiment, cell lysates from each experimental group were harvested, and the expression levels of the following proteins were measured by immunoblotting: TAK1/p-TAK1, NF-kB p65/p-p65, JNK/p-JNK, AP1/p-AP1, JAK1/p-JAK1, STAT6/p-STAT6 and β-catenin. The recommended dilution ratios of the JAK1/p-JAK1, STAT6/p-STAT6 and β-catenin primary antibodies are JAK1 (Immunoway, YT4535, 1:1000), P-JAK1 (Immunoway, YP0424, 1:1000), STAT6 (Abcam, ab32520, 1:1000), P-STAT6 (Abcam, ab263947, 1:1000), and β-catenin (Proteintech, 51067-2-AP, 1:4000).
Materials
LPS (from Escherichia coli, serotype 0111: B4), PMA (Phorbol-12-myristate-13-acetate) (79,346), CCK8 reagent (CK04) purchased from Dojindo (Shanghai, China); RIPA lysis (P0013B) buffer purchased from Beyotime (Shanghai, China); Dexamethasone phosphate (2,103,152,212) was purchased from Cisen, Inc. (Shandong, Jinin, China).
Data and Statistical Analysis
Data analysis was performed in a blinded manner. The data are expressed as the mean ± SEM unless indicated otherwise. The sample size was 8 per group for the animal experiments and 3 per group for the phosphoproteomics analysis. ELISA was repeated 5 times, with at least 2 replicates per experiment; and signalling pathway verification by Western blotting was repeated 3–5 times. One-way ANOVA was performed using GraphPad Prism 8.0 (GraphPad Prism, RRID: SCR_002798), and a value of P < 0.05 was considered statistically significant.
Results
α-MMC Sample Verification
A schematic diagram of the tertiary structure of α-MMC is shown in Figure 1A, and the HPLC purity of α-MMC was >97% (Figure 1B). The results of native PAGE analysis of α-MMC homogeneity and SDS–PAGE analysis of its purity and relative size are shown in Figure 1C and D. The purity of α-MMC as determined by SDS–PAGE was also >97%.
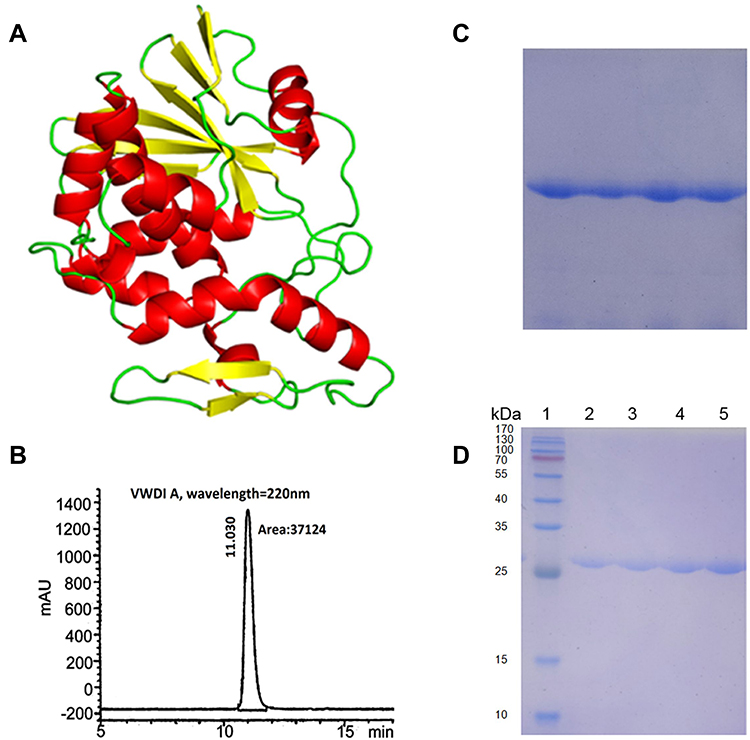 |
Figure 1 Diagram of the tertiary structure of α-MMC and results of the quality inspection of α-MMC protein samples. (A) Schematic diagram of the tertiary structure of α-MMC; (B) HPLC chromatogram of α-MMC protein samples confirming >97% α-MMC purity; (C) analysis of α-MMC homogeneity by native PAGE; (D) analysis of α-MMC purity and relative size by SDS–PAGE. Lane 1 is a protein molecular weight marker; lanes 2, 3, 4, and 5 are four consecutive batches of α-MMC samples, showing a molecular weight of approximately 28 kDa. |
Polarized Macrophages of the M1 and M2 Phenotypes
M1- and M2-polarized macrophages were identified using flow cytometry, and the results are shown in Figure 2. When CD86 was used as a marker to measure the percentages of different cells, the percentages of M0, M1, and M2 parent cells were 12.79%, 50.62%, and 29.69%, respectively (Figure 2A). The percentage of CD86-expressing M1 macrophages was much higher than that of CD86-expressing M0 and M2 macrophages (P<0.05). When CD206 was used as a marker to measure the percentage of cells, the percentages of M0, M1, and M2 parent cells were 16.43%, 19.92%, and 51.83%, respectively (Figure 2B). The percentage of CD206-expressing M2 macrophages was much higher than that of CD206-expressing M0 and M1 macrophages (P<0.05). Since CD86 and CD206 are characteristic cell surface markers of M1-type macrophages and M2-type macrophages, respectively, the experimental results showed that the M1- and M2-type macrophage models had been successfully established.
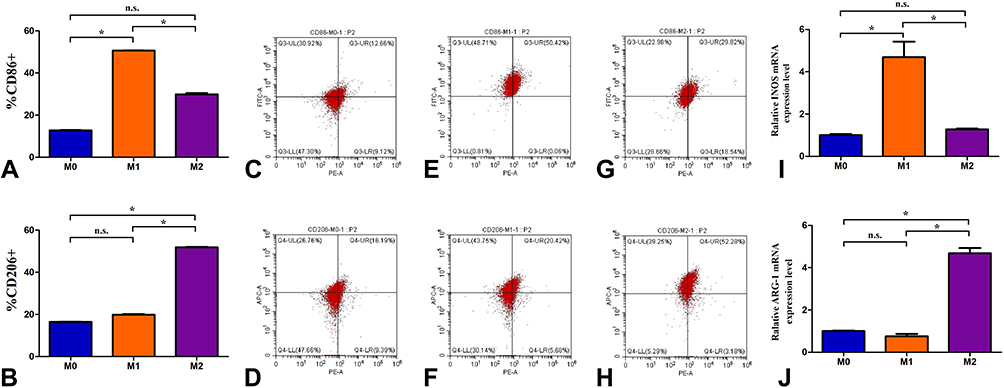 |
Figure 2 The identified results of identified M1- and M2-polarized macrophages by flow cytometry and qPCR technology. (A) The percentages of CD86+ cells in M0, M1, and M2 parent cells; (B) The percentages of CD206+ cells in M0, M1, and M2 parent cells; (C, E and G) A flow cytometry chart of CD86-expressing cells in M0, M1, and M2 parent cells; (D, F and H) A flow cytometry chart of CD206-expressing cells in M0, M1, and M2 parent cells; (I) Relative INOS mRNA expression level (2−ΔΔCT value) in M0, M1, and M2 parent cells; (J) Relative ARG-1 mRNA expression level (2−ΔΔCT value) in M0, M1, and M2 parent cells. The data shown are individual values with the mean ± SEM; n = 3. *P < 0.05 significantly different from the control group; n.s. No significant difference from the control group. One-way analysis of variance, Tukey’s multiple comparison tests. |
The M1- and M2-polarized macrophages were identified using qPCR technology, and the results are shown in Figure 2. In this experiment, GAPDH was used as the internal reference, the amplification efficiency of the target gene and the reference gene was 100%, and the deviation of the mutual efficiency was within 5%. The 2−ΔΔCT values of the INOS mRNA expression level were M0 (1.003±0.093), M1 (4.687±1.282), and M2 (1.273±0.069) (Figure 2I); the 2−ΔΔCT values of the ARG-1 mRNA expression level were M0 (1.001±0.050), M1 (0.760±0.189), and M2 (4.675±0.441) (Figure 2J). Relative INOS mRNA expression level (2−ΔΔCT value) of M1 macrophages was much higher than that of M0 and M2 macrophages (P<0.05); Relative ARG-1 mRNA expression level (2−ΔΔCT value) of M2 macrophages was much higher than that of M0 and M1 macrophages (P<0.05). Since iNOS and ARG-1 are characteristic enzyme markers of M1 and M2 macrophages, respectively, the experimental results again showed that the M1 and M2 macrophage models had been successfully established.
Noncytotoxic Dose of α-MMC in M1 and M2 Macrophages
The early apoptosis results after treatment of M0, M1, and M2 macrophages with α-MMC for 8 h are shown in Figure 3. When the doses of α-MMC were 0 μg/mL, 0.1 μg/mL, 0.5 μg/mL, 2.5 μg/mL and 12.5 μg/mL, the rates of α-MMC-induced early apoptosis of M0 macrophages were 6.77%±0.45%, 7.04%±0.52%, 7.50%±0.91%, 9.46%±0.32%, 12.69%±1.92%, respectively, those of M1 macrophages were 11.13%±2.17%, 11.90%±1.56%, 11.89%±1.76%, 18.71%±0.74%, 28.82%±0.74%, respectively, and those of M2 macrophages were 7.28%±0.58%, 7.68%±0.78%, 8.49%±0.44%, 10.83%±1.30%, 14.34%±0.69%, respectively. The results showed that at a dose of 12.5 μg/mL, α-MMC induced significant apoptosis in all three types of cells, and these results were significantly different from the respective blank control groups (p<0.05); at a dose of 2.5 μg/mL, α-MMC caused significant apoptosis only in M1 macrophages; at a dose of 0.5 μg/mL, α-MMC did not cause significant apoptosis in the three cell lines (p>0.05).
 |
Figure 3 The early apoptosis results of M0, M1, and M2 macrophages after treatment with α-MMC for 8 h. (A) α-MMC-induced early apoptosis of M0 macrophages at the doses of 0 μg/mL, 0.1 μg/mL, 0.5 μg/mL, 2.5 μg/mL and 12.5 μg/mL; (A1–A5) An apoptosis detection chart of flow cytometry in M0 macrophages at different doses of α-MMC; (B) α-MMC-induced early apoptosis of M1 macrophages at the doses of 0 μg/mL, 0.1 μg/mL, 0.5 μg/mL, 2.5 μg/mL and 12.5 μg/mL; (B1–B5) An apoptosis detection chart of flow cytometry in M1 macrophages at different doses of α-MMC; (C) α-MMC-induced early apoptosis of M2 macrophages at the doses of 0 μg/mL, 0.1 μg/mL, 0.5 μg/mL, 2.5 μg/mL and 12.5 μg/mL; (C1–C5) An apoptosis detection chart of flow cytometry in M0 macrophages at different doses of α-MMC. The data shown are individual values with the mean ± SEM; n = 5. *P < 0.05 significantly different from the 0 μg/mL group; n.s. No significant difference from the control group. One-way analysis of variance, Tukey’s multiple comparison tests. |
Inflammatory Cytokine Expression in M1-Type Macrophages and Anti-Inflammatory Cytokine Expression in M2-Type Macrophages
M0 macrophages, M1 macrophages and M2 macrophages were treated with a safe, nonapoptotic dose of α-MMC (0.3 μg/mL). At 0 h of α-MMC treatment, that is, in the untreated model state, we found that the expression levels of the inflammatory cytokines TNF-a, IL-1β, IL-6, IL-8, MCP-1, and MIP-1α in M0 macrophages were 60.97±6.38 pg/mL, 85.89± 16.14 pg/mL, 115.62±6.28 pg/mL, 383.98±45.05 pg/mL, 123.30±62.61 pg/mL, and 109.35±20.82 pg/mL, respectively. In M1 macrophages, due to stimulation with LPS, the expression levels of these inflammatory cytokines increased sharply to 1871.08±147.20 pg/mL, 639.86±20.94 pg/mL, 778.19±28.30 pg/mL, 8698.74 pg/mL±395.70 pg/mL, 1754.30±107.87 pg/mL, and 1590.90±136.65 pg/mL, respectively, and there were extremely significant differences compared with the corresponding expression levels in M0 macrophages. There was no increased expression in M2 macrophages; the expression levels of TNF-a, IL-1β, IL-6, IL-8, MCP-1, and MIP-1α in these cells were 73.92±9.55 pg/mL, 117.33±12.11 pg/mL, 136.91±14.26 pg/mL, 435.82±47.30 pg/mL, 239.97±26.73 pg/mL, and 142.33±15.29 pg/mL, respectively, and there was no significant difference compared with the expression levels in M0 macrophages. After 2 h, 8 h, 24 h, and 48 h of α-MMC administration, the expression levels of these inflammatory cytokines did not change significantly in M0 macrophages and M2 macrophages, while in M1 macrophages, as the treatment time increased, the expression levels of these inflammatory cytokines exhibited a significant gradient decrease, as shown in Figure 4A–F. Compared with 0 h, the expression levels of these inflammatory cytokines decreased significantly at 2 h, 8 h, 24 h, and 48 h after α-MMC administration, showing a significant inhibitory effect of α-MMC on the expression of the inflammatory cytokines TNF-α, IL-1β, IL-6, IL-8, MCP-1 and MIP-1α.
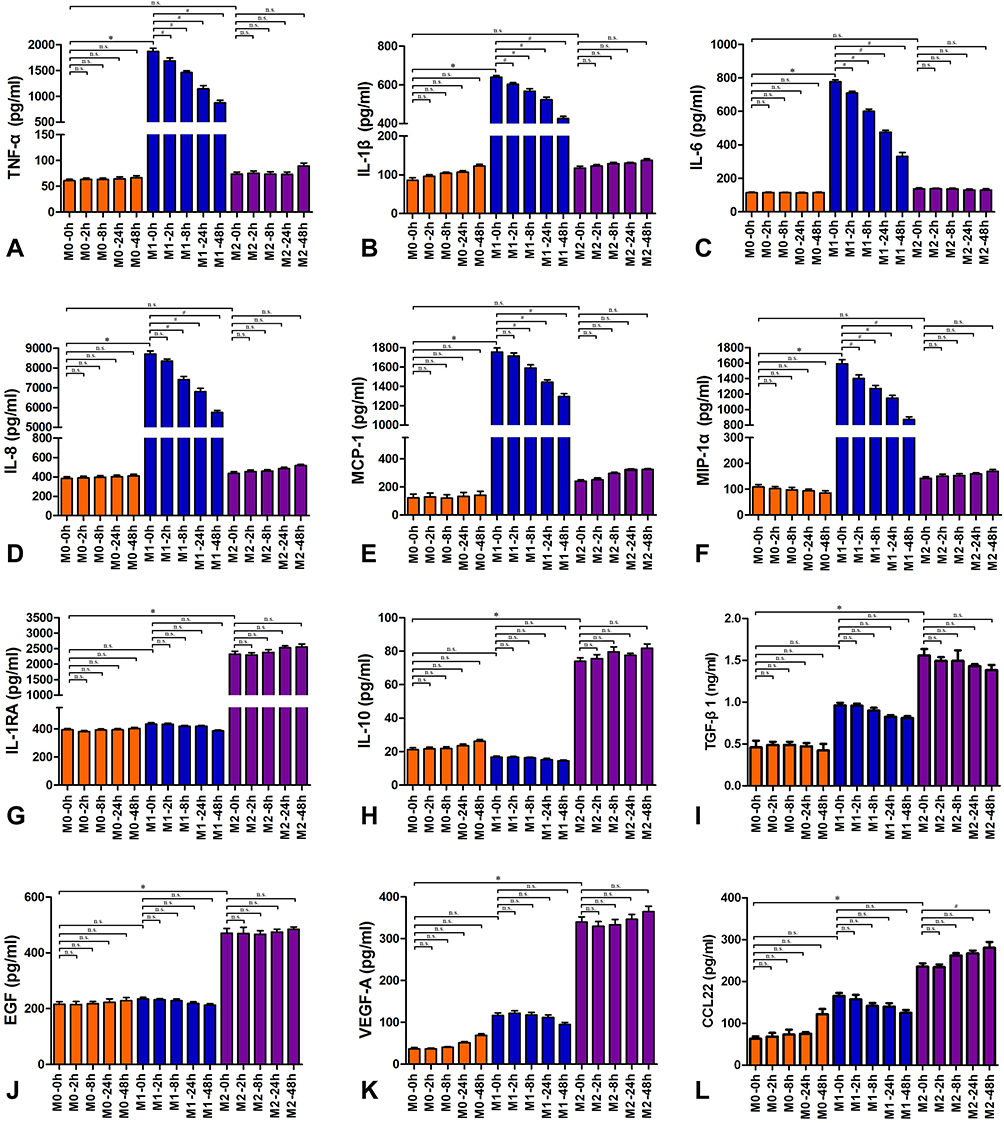 |
Figure 4 Inflammatory cytokines and anti-inflammatory cytokines expression in M0, M1 and M2 macrophages. (A) TNF- α; (B) IL-1β; (C) IL-6; (D) IL-8; (E) MCP-1; (F) MIP-1α; (G) IL-RA; (H) IL-10; (I) TGF-β1; (J) EGF; (K) VEGF-A; (L) CCL22. The Orange-red columns are the M0-type macrophage groups, which was not treated with LPS; the blue columns are the M1-type macrophage groups; the purple columns are the M2-type macrophage groups. These macrophages were treated with 0.3 μg/mL α-MMC for 0 hours, 2 hours, 8 hours, 24 hours, or 48 hours. The data shown are individual values with the mean ± SEM; n = 5. *P < 0.05 significantly different from the M0 macrophage group of 0 hours; #P < 0.05 significantly different from the M1 macrophage group of 0 hours; n.s. No significant difference from the control group. One-way analysis of variance, Tukey’s multiple comparison tests. |
We observed a completely different effect when we measured anti-inflammatory cytokine levels. Our experimental results showed that at 0 h of α-MMC treatment, the expression levels of the anti-inflammatory cytokines IL-1RA, IL-10, TGF-β, EGF, VEGF-A and CCL22 in M0 macrophages were 393.78±22.40 pg/mL, 21.22±2.86 pg/mL, 0.46±0.14 ng/mL, 216.22±22.13 pg/mL, 36.83±7.76 pg/mL, and 69.74±18.77 pg/mL, respectively. However, these expression levels were not increased in M1 macrophages. The expression levels of these anti-inflammatory cytokines in M1 macrophages were 433.82±22.83 pg/mL, 16.73±1.52 pg/mL, 0.87±0.19 ng/mL, 235.47±12.37 pg/mL, 116.63±14.40 pg/mL, and 179.44±18.34 pg/mL, respectively, and there was no significant difference compared with the expression levels in M0 macrophages. However, in M2 macrophages, due to stimulation with IL-4, the expression levels of these anti-inflammatory cytokines were sharply increased, and the expression levels of IL-1RA, IL-10, TGF-β, EGF, VEGF-A, and CCL22 were 2321.88±233.66 pg/mL, 73.94±5.27 pg/mL, 1.55±0.19 ng/mL, 470.71±41.56 pg/mL, 339.65±30.92 pg/mL, and 255.28±28.26 pg/mL, respectively, and there is a significant difference compared with the expression levels in M0 macrophages. After 2 h, 8 h, 24 h, and 48 h of α-MMC administration, the expression levels of these anti-inflammatory cytokines did not change significantly in M0 macrophages or M1 macrophages. In M2 macrophages, the expression levels of these inflammatory cytokines also did not change with increasing treatment time, as shown in Figure 4G–L. Compared with 0 h, there was no significant difference in the expression levels of these inflammatory cytokines at 2 h, 8 h, 24 h, and 48 h after α-MMC administration, showing that α-MMC did not inhibit the expression of the anti-inflammatory cytokines IL-1RA, IL-10, TGF-β, EGF, VEGF-A or CCL22.
Inhibition of Proinflammatory Cytokine Expression and Anti-Inflammatory Effects in an LPS-Induced Pneumonia Mouse Model
In an LPS-induced pneumonia mouse model, compared with the sham group, the expression levels of inflammatory cytokines, ie, TNF-α, IL-1β, IL-6, MCP-1 and MIP-1α, in lung tissue were markedly increased after 2 intrapulmonary injections of LPS at a 24 h interval, as shown in Figure 5A–E. These cytokines were absorbed by the blood in the lungs, and higher levels were also observed in blood throughout the whole body, as shown in Figure 5F–J. In mice with pneumonia treated with dexamethasone or α-MMC, the expression of the five inflammatory cytokines mentioned above in lung tissue homogenates and plasma was significantly inhibited, and there was a significant difference in the levels of these inflammatory cytokines between the dexamethasone-treated group and the model group. Low and high doses of α-MMC (0.1 mg/kg and 0.3 mg/kg) exerted obvious dose-dependent effects inhibiting the levels of these five cytokines, with the high dose having a similar inhibitory effect to dexamethasone. The trend of the changes in the levels of the five cytokines in plasma was essentially the same as the trends observed in lung tissue.
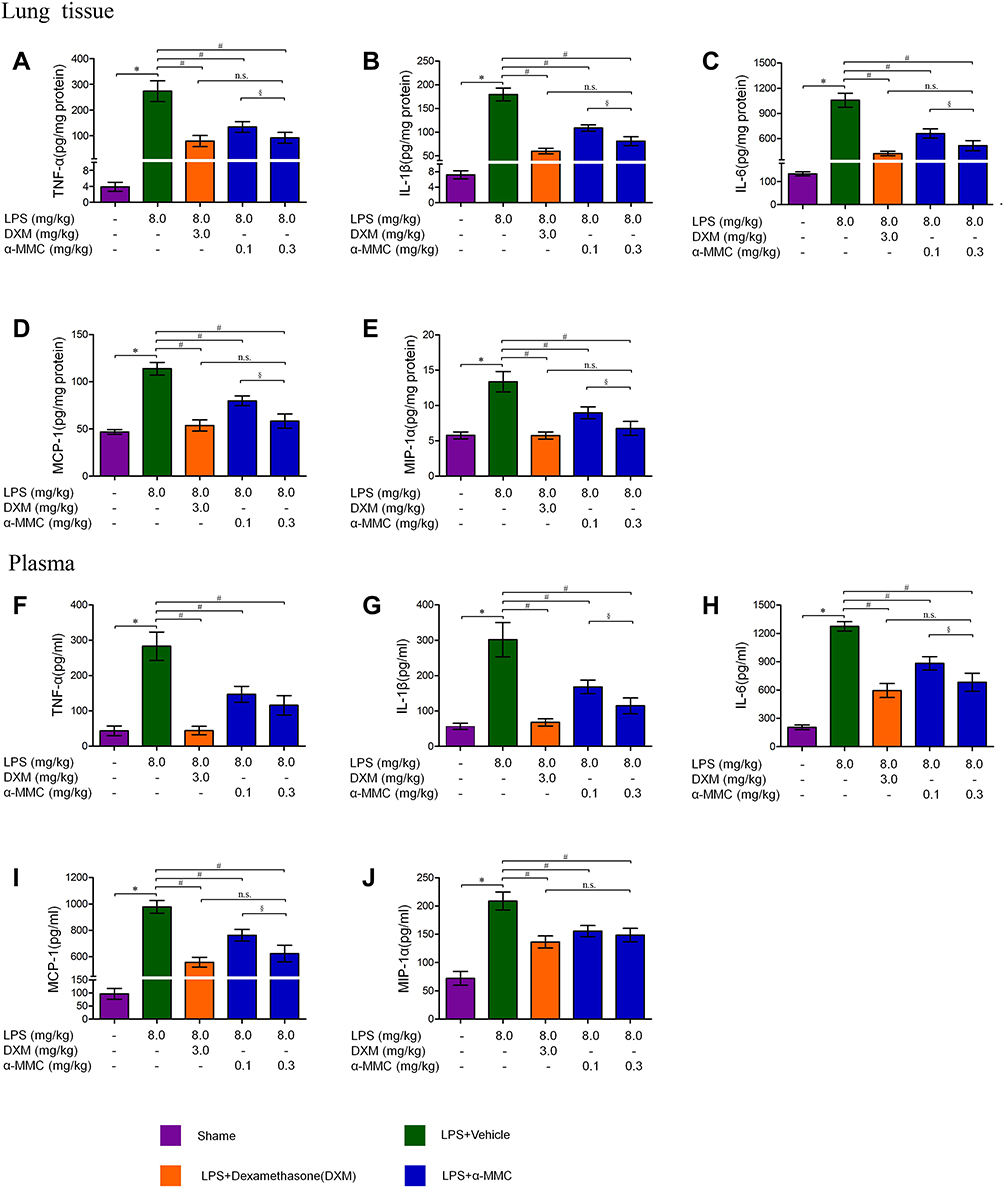 |
Figure 5 The expression levels of the inflammatory cytokines TNF-α, IL-1β, IL-6, MIP-1α and MCP-1 in lung tissues and plasma. (A–E) TNF-α, IL-1β, IL-6, MIP-1α and MCP-1 levels in lung tissues; (F–J) TNF-α, IL-1β, IL-6, MIP-1α and MCP-1 levels in plasma. The data shown are individual values with the mean ± SEM; n = 8. *P < 0.05 significantly different from the sham group; #P < 0.05 significantly different from the LPS-induced model group; §P < 0.05 significantly different from the control group; n.s. No significant difference from the control group. One-way analysis of variance, Tukey’s multiple comparison tests. |
The results of histopathological analysis (H&E staining) of the lung tissues from the mice in each group are shown in Figure 6. In Figure 6A, the lung tissues of the mice in the sham group showed a complete alveolar structure and an alveolar cavity that was separated by a single layer of alveolar epithelial cells and was transparent and clear. In Figure 6B, the lung tissues of the mice in the LPS-induced model group showed severe pneumonia, characterized by a reduced alveolar cavity size, a significantly thickened alveolar space, a large number of infiltrating neutrophils, macrophages and other inflammatory cells, and a large number of diffuse red blood cells. Some exudates were also observed in the alveolar cavity. The microscopic injury severity index of this group was 3.44±0.56, which was significantly different from that of the sham group (0.13±0.23) (Figure 6F). In the LPS and dexamethasone treatment groups, only mild inflammation, such as alveolar wall thickening and inflammatory cell infiltration, was observed (Figure 6C), and the microscopic injury severity index was 1.64±0.85. In the LPS and α-MMC treatment groups, different degrees of alveolar cavity shrinkage and deformation, mild thickening of the alveolar compartment, bleeding and inflammatory cell infiltration were observed (Figure 6D and E). However, the inflammatory lesions in those two groups were significantly less severe than those in the LPS model group, and there was no exudate in the alveolar cavity. The microscopic injury severity indices were 2.06±0.76 (0.1 mg/kg) and 1.71±0.81 (0.3 mg/kg), as shown in Figure 6F.
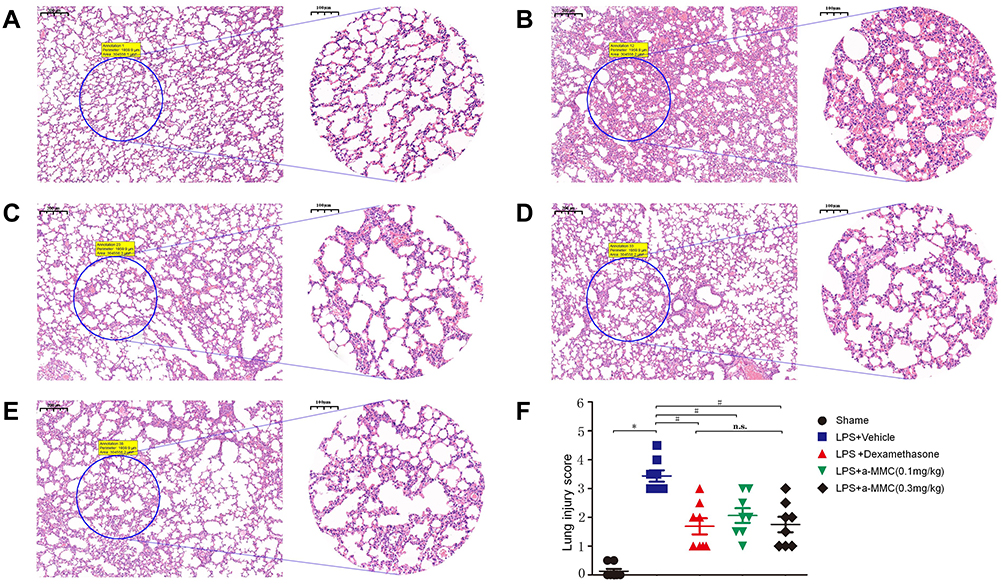 |
Figure 6 Histopathological evaluations (H&E staining) of ALI in LPS-treated mice. (A) The sham group; (B) LPS-induced model group; (C) LPS and dexamethasone treatment group; (D) LPS and α-MMC treatment group (0.1 mg/kg); (E) LPS and α-MMC treatment group (0.3 mg/kg); (F) Lung injury score. The data shown are individual values with the mean ± SEM; n = 8. *P < 0.05 significantly different from the sham group; # P < 0.05 significantly different from the LPS-induced model group; n.s. no significant difference from the control group. One-way analysis of variance, Tukey’s multiple comparison tests. Scale bar, 200 μm for 5× magnification images and 100 μm for 10× magnification images. |
Omics Screening of Associated Signalling Pathways
TMT-based quantitative proteomics and TMT-based quantitative phosphoproteomics were used to compare changes in protein levels and protein phosphorylation before and after LPS treatment (M0/M1) and at two time points after α-MMC administration (0 h and 4 h). The differentially expressed proteins were compared with the proteins of the reference species and subjected to KEGG pathway annotation. The significance of the difference between the levels of the differentially expressed proteins and those of the proteins of the reference species was determined by Fisher’s exact test to identify all the pathways in which the differentially expressed proteins were enriched (p<0.05). The results are shown in Figure 7. The red boxes in the figure indicate proteins or modified proteins whose levels were increased (according to the criteria described above), and the green boxes indicate modified proteins whose levels were decreased. Figure 7A shows that the TLR signalling pathway (proteomic analysis) was activated in the inflammatory macrophage model 48 h after LPS induction. (1) The TLR receptor signalling pathway was significantly activated, and the expression of the signalling proteins MyD88, IRF5, and IRF7 was upregulated (FC=1.241, 1.624, and 1.878, respectively). (2) The expression of the inhibitory signalling protein IkBα, which is involved in the NF-κB pathway, was downregulated (FC=0.764), indicating that the NF-κB signalling pathway was activated. (3) The expression of the signalling protein AP-1, which is associated with the MAPK signalling pathway, was upregulated (FC=1.99), indicating that the MAPK signalling pathway was activated. Additionally, the expression of the signalling proteins MEK1/2 and p38 was downregulated (FC=0.801 and 0.784, respectively). It seems that the activation of the MAPK signalling pathway was mediated by the JNK signalling pathway. (4) The expression of effector proteins of the TLR signalling pathway, such as the proinflammatory cytokine IL-1β and the chemokines IL-8, RANTS and MIP-1α, was also significantly upregulated (FC=1.368, 2.291, 3.381 and 2.040, respectively). Figure 7B shows the results of the analysis of differentially expressed phosphorylated proteins analysis (phosphoproteomics analysis) in the TLR signalling pathway in M1 macrophages 4 h after α-MMC administration. The results showed that α-MMC only significantly inhibited the phosphorylation of the signal protein TAK1, which is located upstream of the TLR signalling pathway, and its phosphorylation level was decreased by 0.582 times. This finding indicates that α-MMC inhibits the NF-κB and MAPK signalling pathways downstream of TAK1 but does not regulate signalling pathways such as the IRF5, IRF7, and IRF3 pathways.
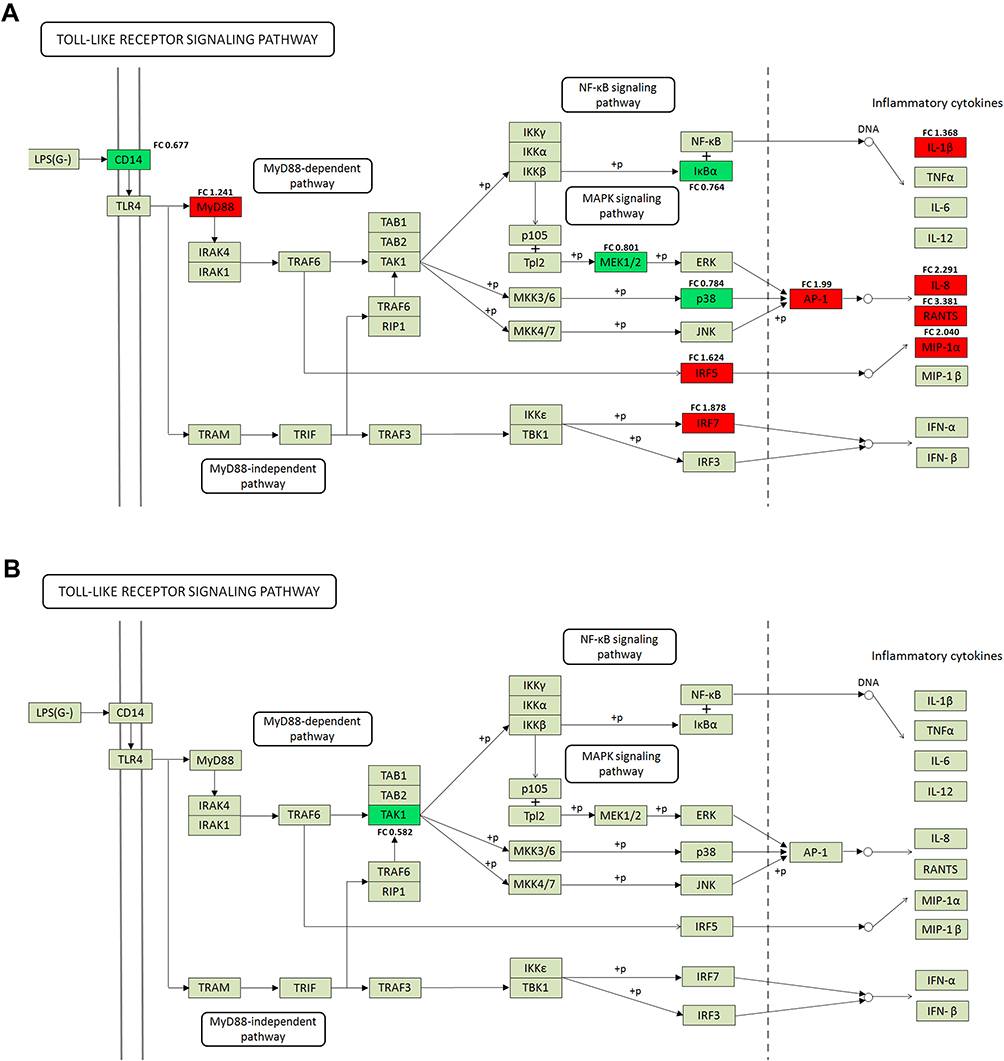 |
Figure 7 KEGG pathway annotation of the Toll-like receptor signalling pathway after LPS and α-MMC treatment. (A) TLR signalling pathway in M1 macrophages by proteomic analysis. In the figure, a red box indicates that a differentially expressed protein was upregulated, a green box indicates that a differentially expressed protein was downregulated, and a grey box indicates that a protein showed no difference in expression. (B) TLR signalling pathway in M1 macrophages 4 h after α-MMC administration by phosphoproteomics analysis. A green box in the figure indicates that the differentially modified protein had decreased modification, and a grey box indicates that a protein was not differentially modified. |
Validation of the Associated Signalling Pathways in M1 Macrophages and M2 Macrophages by Western Blotting
According to KEGG pathway analysis of the proteins that were differentially regulated by α-MMC, we selectively verified changes in the expression of the TLR4/JNK and TLR4/NF-κB signalling pathway-related proteins TRAF6, TAK1/P-TAK1, p65/p-p65, JNK/P-JNK and AP1/P-AP-1 by Western blotting. The results are shown in Figure 8A. A dense, dark and uniform TRAF6 protein band was observed in M1 macrophages at 0 h, 4 h and 8 h after α-MMC administration (the relative densities of TRAF6/β-ACTIN have no significant difference, as shown in Figure 8B), indicating that α-MMC had no regulatory effect on TRAF6 protein expression. However, the density of the TAK1 and p-TAK1 protein bands was slightly decreased at 4 h and 8 h after α-MMC treatment, and the decrease in band density was more obvious at 8 h after the administration of α-MMC, and it was visualized as a light and fuzzy band. The relative densities of the TAK1 and p-TAK1 proteins at 8 h were 0.36±0.20 and 0.18±0.04, respectively, which were significantly different from those at 0 h (1.31±0.19 and 1.24±0.19), as shown in Figure 8C and D. This result shows that α-MMC exerted a significant inhibitory effect on TAK1 protein expression and significantly reduced TAK1 phosphorylation, which is completely consistent with the results of phosphoproteomics analysis.
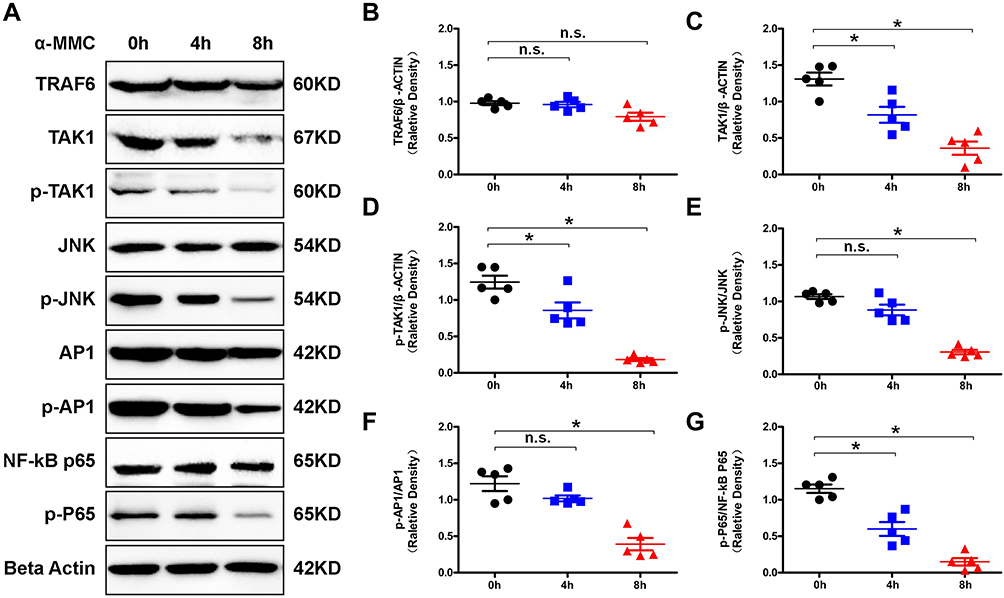 |
Figure 8 Western blotting analysis of signalling proteins related to the TLR signalling pathway in M1 microphages. (A) Western blotting analysis of changes in the levels of the signalling proteins TRAF6, TAK1/p-TAK1, p65/p-p65, JNK/p-JNK and AP1/p-AP-1 in M1 macrophages after α-MMC treatment. (B–G) Relative density of TRAF6/β-actin, TAK1/β-actin, p-TAK1/β-actin, p-JNK/JNK, p-AP-1/AP1 and p-p65/p65. The data shown are individual values with the mean ± SEM; n = 5. *P < 0.05 significantly different from the control group (0 μg/mL α-MMC); n.s. no significant difference from the control group (0 μg/mL α-MMC). One-way analysis of variance, Tukey’s multiple comparison tests. |
As the proteomics analysis showed that LPS did not activate the inflammatory MAPK pathway via the MEK signalling pathway and p38 signalling pathway, we selected only the signalling proteins JNK and AP-1 for verification by Western blotting. The results clearly showed that α-MMC indeed inhibited the JNK signalling pathway, as shown in Figure 8A. The density of the JNK and AP-1 protein bands was not significantly different at 0 h, 4 h and 8 h after administration; however, the density of the p-JNK and p-AP-1 bands decreased significantly with increasing α-MMC treatment time, indicating that α-MMC exerted a significant inhibitory effect on the phosphorylation of JNK and AP-1. Alpha-MMC was also found to have an inhibitory effect on the NF-κB signalling pathway. The density of the p-p65 protein band gradually decreased from 0 h to 4 h to 8 h after administration, although the density of the p65 protein band, which was dense and uniform, did not change. Similarly, these results demonstrated that α-MMC exerted a significant inhibitory effect on NF-κB phosphorylation. These changes were confirmed by the analysis of significant differences in the relative density observed in 5 separate repeated experiments, as shown in Figure 8E–G.
The results of associated signalling pathways in M2 macrophages were shown in Figure 9. Our experiments showed that, the expression of the p-JAK1 and p-STAT6 levels were significantly elevated in M2 macrophages than that of M0 macrophages, and the difference was extremely significant, as shown in Figure 9A. These changes were confirmed by the analysis of significant differences in the relative density observed in 3 separate repeated experiments (P<0.05) (Figure 9D–F). Additionally, the β-catenin protein levels were also significantly increased. These results indicated JAK1/STAT6/β-catenin signalling pathway was significantly activated in M2 macrophages. However, after α-MMC treatment for 8 hours, neither the total protein levels of JAK1, STAT6 and β-catenin nor the phosphorylation of JAK1 and STAT6 were significantly changed (Figure 9B), showing that α-MMC did not exert any regulatory effect on this signalling pathway. The relative density results were shown in Figure 9G–I.
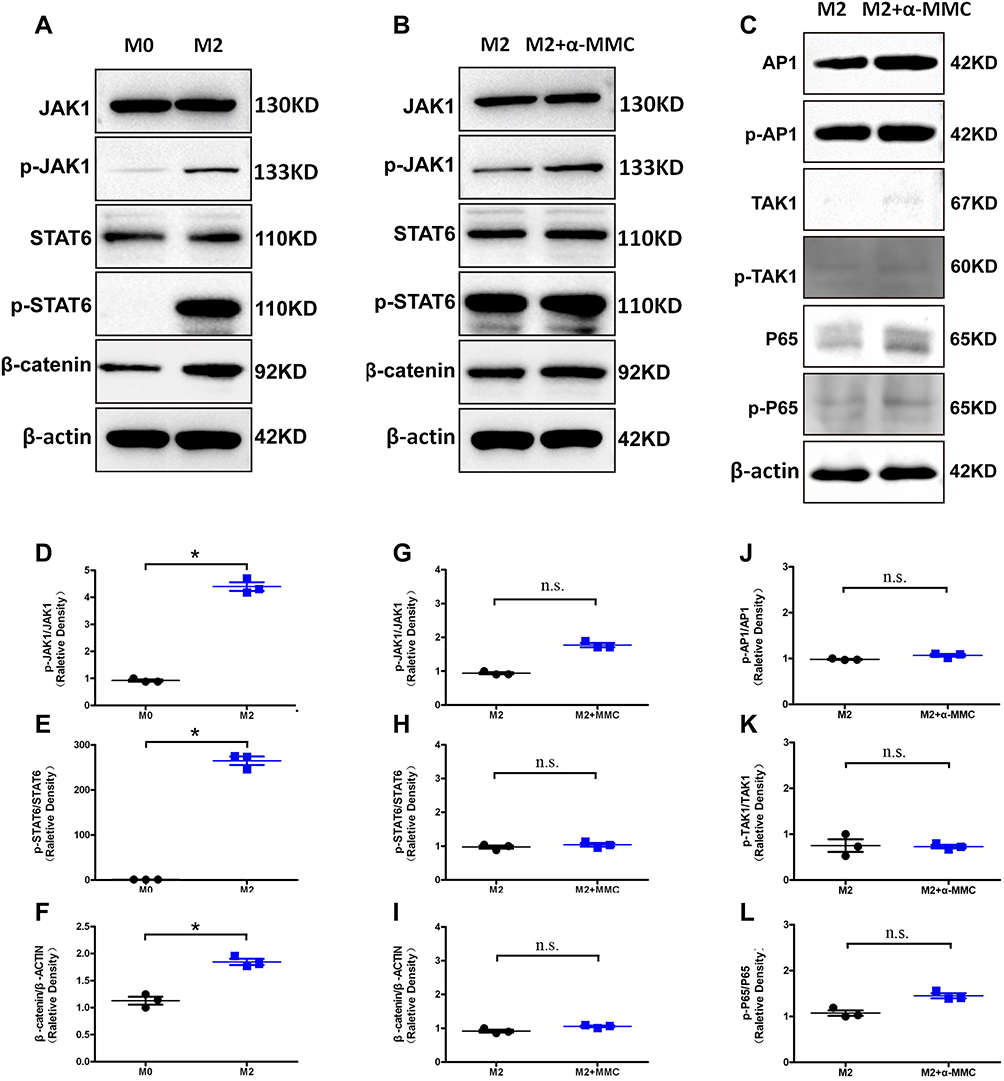 |
Figure 9 Western blotting analysis of signalling proteins related to the JAK1/STAT6 and TLR signalling pathway in M2 microphages. (A) The levels of the signalling proteins JAK1/p-JAK1, STAT6/p-STAT6 and β-catenin in M0 macrophages and M2 macrophages; (B) the levels of the signalling proteins JAK1/p-JAK1, STAT6/p-STAT6 and β-catenin in M2 macrophages after α-MMC treatment; (C) the levels of the signalling proteins AP1/p-AP-1, TAK1/p-TAK1, p65/p-p65 in M2 macrophages after α-MMC treatment; (D–F) Relative density of p-JAK1/ JAK1, p-STAT6/ STAT6 and β-catenin/β-actin in M0 macrophages and M2 macrophages; (G–I) Relative density of p-JAK1/ JAK1, p-STAT6/ STAT6 and β-catenin/β-actin in M2 macrophages after α-MMC treatment; (J–L) relative density of p-AP1/AP-1, p-TAK1/TAK1, p-p65/p65 in M2 macrophages after α-MMC treatment. The data shown are individual values with the mean ± SEM; n = 3. *P < 0.05 significantly different from the control group; n.s. no significant difference from the control group. One-way analysis of variance, Tukey’s multiple comparison tests. |
Since the TLR4-JNK/NF-κB signalling pathway was not activated in IL-4-treated M2 macrophages, except for AP1/p-AP1, the expression levels of TAK1/p-TAK1 and p65/p-p65 were low, and WB analysis showed only slight bands (Figure 9C). And also, after 8 h of treatment of M2 macrophages with α-MMC, neither the phosphorylation of AP1, TAK1 and p65 nor the total levels of these proteins changed significantly, showing that α-MMC indeed did not exert any regulatory effect on this signalling pathway. The relative density results were shown in Figure 9J–L.
Discussion
In vivo, macrophages have functional plasticity and can change their functional characteristics in response to changes in the internal environment.18,19 Two states of macrophage polarization are known, namely, the M1 and M2 phenotypes. When macrophages are exposed to lipopolysaccharide (LPS) and IFN-γ, they differentiate into M1-type polarized macrophages;18 when exposed to Th2 cytokines such as IL-4 and IL-13, they differentiate into M2 macrophages. M1-like macrophages express high levels of MHC class II molecules and CD86 and potently stimulate CD4 T cells to drive strong proinflammatory responses. The main effector molecule of M1 macrophages is NO, which is synthesized by inducible NO synthase (nitric oxide synthase, iNOS) of arginine (arginase 1, ARG-1), and M1 macrophages secrete numerous proinflammatory cytokines, such as IL-1b, IL-6 and TNF-α, whose function is mainly to promote inflammation to kill microbial infections. M2 macrophages express specific markers, such as ARG-1, Fizz1 (cysteine-rich secreted protein) and Ym1 (extracellular matrix-binding lectin), as well as CD206 and CD204. Compared with M1 macrophages, M2-like macrophages produce more anti-inflammatory cytokines, such as IL-1RA, IL-10, and TGFb1, and their function is mainly to promote tissue repair during the resolution phase of inflammation.9
In this study, we generated M1- and M2-polarized macrophage models through treatment with different stimuli to observe whether α-MMC exerts anti-inflammatory immunomodulatory effects.8 In the experiment, we first used PMA to induce the monocyte THP-1 cell line to differentiate into macrophages (M0 type) and then continued to treat the cells with LPS or IL-4 to polarize them toward the M1 and M2 phenotypes. We used flow cytometry to identify M1-polarized and M2-polarized macrophages by measuring the levels of the cell surface markers CD86 (M1 macrophages) and CD206 (M2 macrophages). Additionally, we used qPCR technology to identify M1-polarized macrophages and M2-polarized macrophages by measuring the expression of the M1-polarized marker iNOS and the M2-polarized marker ARG-1. The results showed that the percentage of CD86-expressing M1 macrophages was much higher than that of CD86-expressing M0 and M2 macrophages, the percentage of CD206-expressing M2 macrophages was much higher than that of CD206-expressing M0 and M1 macrophages, the INOS expression of M1 macrophages was much higher than that of M0 and M2 macrophages, and the ARG-1 expression of M2 macrophages was much higher than that of M0 and M1 macrophages. All these results were statistically significantly different (P value<0.05). The experimental results demonstrated that the establishment of the M1 and M2 macrophage models was successful.
It is known from our previous experiments that α-MMC can inactivate the ribosome and induce apoptosis via its glycosidase activity and can regulate cell function via signal transduction.4–6 At high doses, α-MMC induces cell cytotoxicity, while at nontoxic doses, it exerts immunomodulatory effects on monocytes. Therefore, we used flow cytometry (Annexin-V-FITC single staining method) to assess the early apoptotic effects of α-MMC on M0, M1, and M2 macrophages at 8 h to identify a reliable noncytotoxic dose. The results showed that at a dose of 2.5 μg/mL, α-MMC caused significant apoptosis only in M1 macrophages, while at a dose of 0.5 μg/mL, α-MMC did not induce significant apoptosis in any of the three cell types (P value >0.05). Therefore, we determined the noncytotoxic dosage of α-MMC to be <0.5 μg/mL. We chose a safer dose of 0.3 μg/mL as the experimental dose to observe the immunomodulatory effect of α-MMC on the expression of cytokines in M1- and M2-polarized macrophages. The measurement of each cytokine was performed using a commercial quantitative ELISA kit produced by Immunoway. The results showed that α-MMC exerted a significant inhibitory effect on the inflammatory cytokines that are highly expressed in M1 macrophages, namely, IL-1β, IL-6, IL-8, MCP-1, MIP-1α, and TNF-α. The effect showed a significant time-dependence (decreased as the treatment times increased to 2 h, 8 h, 24 h, and 48 h). However, α-MMC exerted no inhibitory effect on the levels of the anti-inflammatory cytokines CCL22, IL-1RA, IL-10, TGF-β, EGF and VEGF-A, which are highly expressed by M2 macrophages, and there was no significant difference in the expression levels after α-MMC treatment for 2 h, 8 h, 24 h, and 48 h.
The selective immunomodulatory effect of α-MMC, by which it inhibited the inflammatory cytokine expression of M1 macrophages but not the anti-inflammatory cytokine expression of M2 macrophages, is of great significance for inhibiting inflammation and promoting the recovery of inflammatory tissue. We know that some pathogenic microorganisms, such as cytomegalovirus, Epstein–Barr virus, group A Streptococcus, influenza virus, H5N1 influenza virus infection and SARS-CoV and SARS-CoV-2, are prone to causing cytokine storms in the body, leading to excessive inflammation or inflammatory storms.20,21 The inability to inhibit this inflammatory reaction causes severe pathological damage to the infected organs and induces multiple organ failure, leading to patient death.22,23 In addition to acute infection, cytokine storms are also a common endpoint of autoimmune diseases, such as rheumatoid and systemic lupus erythematosus, as well as various diseases, such as cancer and AIDS.24–26 Therefore, the efficacy of α-MMC in selectively inhibiting inflammatory cytokine expression renders it particularly suitable for the treatment of viral infections and severe autoimmune diseases characterized by cytokine storms.
Furthermore, the inhibitory effect of α-MMC on the expression of proinflammatory cytokines was also verified in an LPS-induced acute pneumonia mouse model.27,28 We injected a high dose of LPS (8 mg/kg) directly into the lungs of mice through the trachea twice at a 24-h interval to induce a strong response. The results showed that α-MMC administration also significantly inhibited the expression of the inflammatory cytokines TNF-α, IL-1β, IL-6, MIP-1α and MCP-1, which were highly expressed in mice with acute pneumonia, and that the inhibitory effect of α-MMC (0.3 mg/kg) was not significantly different from that of dexamethasone. Furthermore, histopathological examination showed that α-MMC administration significantly ameliorated pulmonary inflammation-related manifestations, such as alveolar septum thickening and inflammatory cell infiltration caused by LPS, indicating that α-MMC can inhibit inflammation by inhibiting the release of inflammatory cytokines.
In a follow-up study of the mechanism and target of α-MMC, we used TMT-based quantitative proteomics and TMT-based quantitative phosphoproteomics and performed KEGG pathway annotation.29,30 After macrophages were stimulated with LPS, activation of the TLR4 receptor pathway and an increase in the expression of inflammatory cytokines were the most prominent changes observed. By using a successful model of inflammation, we found that α-MMC significantly inhibited the TAK1 protein and the phosphorylation of TAK1 upstream of the TLR4 signalling pathway. Subsequent verification by Western blotting confirmed the results of the omics analysis. We found that the grey values of the TAK1 and p-TAK1 protein bands were significantly decreased and that the grey values of the protein bands of p-JNK and p-AP-1, which are associated with the MAPK pathway, and p-p65, which is associated with the NF-κB pathway, were also significantly decreased. Alpha-MMC clearly targeted the signalling protein TAK1 to exert an inhibitory effect on the inflammatory TLR4-MAPK/NF-κB signalling pathway in M1 macrophages. In M2 macrophages, α-MMC did not have any regulatory effect on either the TLR4-MAPK/NF-κB signalling pathway or the JAK1/STAT6/β-catenin signalling pathway, showing no regulatory effect on the expression of anti-inflammatory cytokines.
In this study, although we found that α-MMC inhibited M1-type inflammatory cytokine expression and failed to promote M2-type anti-inflammatory cytokine expression, it had no inhibitory effect on anti-inflammatory cytokines. This is an advantage over the glucocorticoid dexamethasone. We know that dexamethasone exerts anti-inflammatory effects at low doses but appears to be proinflammatory at high doses and for prolonged periods of time. Additionally, our previous study found that α-MMC selectively acts on monocytes.4 It exerts a significant effect on cytokine release by THP-1 cells but has no effect on normal WIL2-s B cells and H9 T cells, and this effect is dependent on the LRP1 receptor.5 Because α-MMC exerts selective immunosuppressive effects on monocytes/macrophages, it has good potential for treating inflammatory cytokine storms, also called macrophage activation syndrome (MAS) in the clinic.24–26,31 However, the glucocorticoid dexamethasone can not only inhibit the activation of macrophages but also inhibit the functions of T cells and B cells.32,33 It also exerts an inhibitory effect on other immune cells, including neutrophils and dendritic cells.34 Therefore, it exerts different pharmacological effects, causing side effects such as insulin resistance, obesity, glaucoma, osteoporosis, wound healing difficulties and even Cushing’s syndrome.35,36
Limits
Our previous study found that α-MMC mediated its immunoregulatory effect on monocytes through the LRP1 receptor.4,6 Therefore, we hypothesize that the regulatory effect of α-MMC on the expression of inflammatory cytokines by M1 macrophages is also mediated through the LRP1 receptor. Although this study proves that α-MMC inhibits the expression of inflammatory cytokines by inhibiting the TAK1 signalling protein of the TLR signalling pathway, it is still unknown what signalling pathway connects the LRP1 receptor and TAK1, resulting in crosstalk with the TLR4-MAPK/NF-κB signalling pathway. This is a very interesting topic; perhaps there is an unknown LRP1 receptor signalling pathway that deserves further exploration.
Conclusion
In this study, we confirmed that (1) at noncytotoxic doses of <0.5 μg/mL, α-MMC inhibits the LPS-induced synthesis of inflammatory cytokines (TNF-α, IL-1β, IL-6, IL-8, MIP-1α and MCP-1) by M1 macrophages in a time-dependent manner but does not inhibit the IL-4-induced synthesis of anti-inflammatory cytokines (IL-10, IL-1RA, EGF, VEGF, TGF-β and CCL22) by M2 macrophages; (2) α-MMC can significantly inhibit inflammatory cytokine expression in the lung tissues of mice with LPS-induced acute pneumonia; and (3) α-MMC inhibits TAK1 of the TLR4 signalling pathway, thereby inhibiting its downstream NF-κB and JNK/MAPK pathways and exerting an inhibitory effect on the synthesis of inflammatory cytokines. The efficacy of α-MMC in selectively inhibiting inflammatory cytokines renders it particularly suitable for the treatment of viral infections and severe autoimmune diseases characterized by cytokine storms. Given that the cell membrane-specific receptor of α-MMC is LRP1, α-MMC may exert an anti-inflammatory immunomodulatory effect on M1 macrophages through the LRP1 receptor signalling pathway. How the LRP1 receptor signalling pathway inhibits the TLR inflammatory signalling pathway through crosstalk needs further study.
Abbreviations
α-MMC, α-momorcharin; RIPs, ribosome-inactivating proteins; iNOS, nitric oxide synthase; ARG-1, Arginase 1; PMA, phorbol 12-myristate 13-acetate; LPS, lipopolysaccharide; DXM, dexamethasone; ALI, acute lung injury; TAK1, transforming growth factor-β (TGF-β)-activated kinase 1; MAPK, mitogen-activated protein kinase; TLR4, toll-like receptor 4; NF-κB, nuclear factor-κB; LC-MS/MS, liquid chromatography-tandem mass spectrometry; TMT, tandem mass tags; KEGG, Kyoto Encyclopedia of Genes and Genomes; SEM, standard error of the mean.
Ethics Approval and Consent to Participate
Ethical approval was obtained from the Ethics Committee of Service bio (Wuhan, China). All methods and experimental protocols were carried out in accordance with the guidelines and regulations of the Care and Use of Laboratory Animals of Service bio (Wuhan, China).
Acknowledgments
We’d like to show our great appreciation to Shanghai Applied Protein Technology Co., Ltd. for technical support of proteomics. And also thanks to Shuangfen Liu, Jiacong Cheng, Linxin He, Mengling Liu, Dai Shen, Suhang Tan, Yingxin Tian, Chang Liao, Xing Huang and Cheng Li for their contributions to this paper. This work was supported by the Natural Science Foundation of the Department of Science and Technology of the Sichuan Province under Grant (2018SZ0016, 2019YFS0307, and 2021YFS0053), Collaborative Innovation Centre of Sichuan for Elderly Care and Health (19Z03), Natural science Foundation of China (31600269), Science and Technology Program of Sichuan Province (19YYJC1242), Health Commission of Sichuan Province (17PJ577), Natural Science Project of Chengdu Medical College (CYZ17-18) and the Provincial College Students Innovation and Entrepreneurship Project (S201913705100).
Author Contributions
All authors made a significant contribution to the work reported, whether that is in the conception, study design, execution, acquisition of data, analysis and interpretation, or in all these areas; took part in drafting, revising or critically reviewing the article; gave final approval of the version to be published; have agreed on the journal to which the article has been submitted; and agree to be accountable for all aspects of the work.
Disclosure
The authors report no conflicts of interest in this work.
References
1. Puri M, Kaur I, Kanwar RK, et al. Ribosome inactivating proteins (RIPs) from Momordica charantia for antiviral therapy. Curr Mol Med. 2009;9(9):1080–1094. doi:10.2174/156652409789839071
2. Ng TB, Wong JH, Wang H. Recent progress in research on ribosome inactivating proteins. Curr Protein Pept Sci. 2010;11(1):37–53. doi:10.2174/138920310790274662
3. Leung SO, Yeung HW, Leung KN. The immunosuppressive activities of two abortifacient proteins isolated from the seeds of bitter melon (Momordica charantia). Immunopharmacology. 1987;13(3):159–171. doi:10.1016/0162-3109(87)90054-3
4. Deng N, Li M, Shen D, et al. LRP1 receptor-mediated immunosuppression of α-MMC on monocytes. Int Immunopharmacol. 2019;70:80–87. doi:10.1016/j.intimp.2019.01.036
5. Deng N, Sun Y, Liu M, et al. Alpha-momorcharin regulates cytokine expression and induces apoptosis in monocytes. Immunopharmacol Immunotoxicol. 2019;41(2):258–266. doi:10.1080/08923973.2019.1610430
6. Wang L, Shen F, Zhang M, et al. Cytotoxicity mechanism of α-MMC in normal liver cells through LRP1 mediated endocytosis and JNK activation. Toxicology. 2016;357–358:33–43. doi:10.1016/j.tox.2016.05.025
7. Chen YJ, Zhu JQ, Fu XQ, et al. Ribosome-inactivating protein α-momorcharin derived from edible plant momordica charantia induces inflammatory responses by activating the NF-kappaB and JNK pathways. Toxins. 2019;11(12):694. doi:10.3390/toxins11120694
8. Veremeyko T, Yung AWY, Anthony DC, et al. Early growth response gene-2 is essential for M1 and M2 macrophage activation and plasticity by modulation of the transcription factor CEBPβ. Front Immunol. 2018;9:2515. doi:10.3389/fimmu.2018.02515
9. Khallou-Laschet J, Varthaman A, Fornasa G, et al. Macrophage plasticity in experimental atherosclerosis. PLoS One. 2010;5(1):e8852. doi:10.1371/journal.pone.0008852
10. Cherry JD, Olschowka JA, O’Banion MK. Neuroinflammation and M2 microglia: the good, the bad, and the inflamed. J Neuroinflammation. 2014;11:98. doi:10.1186/1742-2094-11-98
11. Lu YC, Yeh WC, Ohashi PS. LPS/TLR4 signal transduction pathway. Cytokine. 2008;42(2):145–151. doi:10.1016/j.cyto.2008.01.006
12. Peri F, Piazza M, Calabrese V, et al. Exploring the LPS/TLR4 signal pathway with small molecules. Biochem Soc Trans. 2010;38(5):1390–1395. doi:10.1042/BST0381390
13. He Y, Gao Y, Zhang Q, et al. IL-4 switches Microglia/macrophage M1/M2 polarization and alleviates neurological damage by modulating the JAK1/STAT6 pathway following ICH. Neuroscience. 2020;437:161–171. doi:10.1016/j.neuroscience.2020.03.008
14. Li M, Chen Y, Liu Z, et al. Anti-tumor activity and immunological modification of ribosome-inactivating protein (RIP) from Momordica charantia by covalent attachment of polyethylene glycol. Acta Biochim Biophys Sin. 2009;41(9):792–799. doi:10.1093/abbs/gmp068
15. Meng Y, Lin S, Liu S, et al. A novel method for simultaneous production of two ribosome-inactivating proteins, α-MMC and MAP30, from Momordica charantia L. PLoS One. 2014;9(7):e101998. doi:10.1371/journal.pone.0101998
16. Percie du Sert N, Hurst V, Ahluwalia A, et al. The ARRIVE guidelines 2.0: updated guidelines for reporting animal research. PLoS Biol. 2020;18(7):e3000410. doi:10.1371/journal.pbio.3000410
17. Tanino Y, Makita H, Miyamoto K, et al. Role of macrophage migration inhibitory factor in bleomycin-induced lung injury and fibrosis in mice. Am J Physiol Lung Cell Mol Physiol. 2002;283(1):L156–62. doi:10.1152/ajplung.00155.2001
18. Shapouri-Moghaddam A, Mohammadian S, Vazini H, et al. Macrophage plasticity, polarization, and function in health and disease. J Cell Physiol. 2018;233(9):6425–6440. doi:10.1002/jcp.26429
19. Locati M, Curtale G, Mantovani A. Diversity, mechanisms, and significance of macrophage plasticity. Annu Rev Pathol. 2020;15:123–147. doi:10.1146/annurev-pathmechdis-012418-012718
20. Behrens EM, Koretzky GA. Review: cytokine storm syndrome: looking toward the precision medicine era. Arthritis Rheumatol. 2017;69(6):1135–1143. doi:10.1002/art.40071
21. Fajgenbaum DC, June CH. Cytokine Storm. N Engl J Med. 2020;383(23):2255–2273. doi:10.1056/NEJMra2026131
22. Song P, Li W, Xie J, et al. Cytokine storm induced by SARS-CoV-2. Clin Chim Acta. 2020;509:280–287. doi:10.1016/j.cca.2020.06.017
23. Hu B, Huang S, Yin L. The cytokine storm and COVID-19. J Med Virol. 2021;93(1):250–256. doi:10.1002/jmv.26232
24. Sen ES, Clarke SL, Ramanan AV. Macrophage Activation Syndrome. Indian J Pediatr. 2016;83(3):248–253. doi:10.1007/s12098-015-1877-1
25. Crayne CB, Albeituni S, Nichols KE, et al. The immunology of macrophage activation syndrome. Front Immunol. 2019;10:119. doi:10.3389/fimmu.2019.00119
26. McGonagle D, Sharif K, O’Regan A, et al. The role of cytokines including interleukin-6 in COVID-19 induced pneumonia and macrophage activation syndrome-like disease. Autoimmun Rev. 2020;19(6):102537. doi:10.1016/j.autrev.2020.102537
27. Finkin-Groner E, Moradov D, Shifrin H, et al. Indoline-3-propionate and 3-aminopropyl carbamates reduce lung injury and pro-inflammatory cytokines induced in mice by LPS. Br J Pharmacol. 2015;172(4):1101–1113. doi:10.1111/bph.12982
28. Hu X, Tian Y, Qu S, et al. Protective effect of TM6 on LPS-induced acute lung injury in mice. Sci Rep. 2017;7(1):572. doi:10.1038/s41598-017-00551-8
29. Kanehisa M, Goto S, Sato Y, et al. KEGG for integration and interpretation of large-scale molecular data sets. Nucleic Acids Res. 2012;40(Database issue):D109–14. doi:10.1093/nar/gkr988
30. McAlister GC, Huttlin EL, Haas W, et al. Increasing the multiplexing capacity of TMTs using reporter ion isotopologues with isobaric masses. Anal Chem. 2012;84(17):7469–7478. doi:10.1021/ac301572t
31. Ravelli A, Davì S, Minoia F, et al. Macrophage activation syndrome. Hematol Oncol Clin North Am. 2015;29(5):927–941. doi:10.1016/j.hoc.2015.06.010
32. Akdis CA, Blesken T, Akdis M, et al. Glucocorticoids inhibit human antigen-specific and enhance total IgE and IgG4 production due to differential effects on T and B cells in vitro. Eur J Immunol. 1997;27(9):2351–2357. doi:10.1002/eji.1830270933
33. Rupprecht R, Wodarz N, Kornhuber J, et al. In vivo and in vitro effects of glucocorticoids on lymphocyte proliferation in man: relationship to glucocorticoid receptors. Neuropsychobiology. 1991;24(2):61–66. doi:10.1159/000119462
34. Vandewalle J, Luypaert A, De Bosscher K, et al. Therapeutic mechanisms of glucocorticoids. Trends Endocrinol Metab. 2018;29(1):42–54. doi:10.1016/j.tem.2017.10.010
35. Hartmann K, Koenen M, Schauer S, et al. Molecular actions of glucocorticoids in cartilage and bone during health, disease, and steroid therapy. Physiol Rev. 2016;96(2):409–447. doi:10.1152/physrev.00011.2015
36. Escoter-Torres L, Caratti G, Mechtidou A, et al. Fighting the fire: mechanisms of inflammatory gene regulation by the glucocorticoid receptor. Front Immunol. 2019;10:1859. doi:10.3389/fimmu.2019.01859
 © 2022 The Author(s). This work is published and licensed by Dove Medical Press Limited. The
full terms of this license are available at https://www.dovepress.com/terms
and incorporate the Creative Commons Attribution
- Non Commercial (unported, 3.0) License.
By accessing the work you hereby accept the Terms. Non-commercial uses of the work are permitted
without any further permission from Dove Medical Press Limited, provided the work is properly
attributed. For permission for commercial use of this work, please see paragraphs 4.2 and 5 of our Terms.
© 2022 The Author(s). This work is published and licensed by Dove Medical Press Limited. The
full terms of this license are available at https://www.dovepress.com/terms
and incorporate the Creative Commons Attribution
- Non Commercial (unported, 3.0) License.
By accessing the work you hereby accept the Terms. Non-commercial uses of the work are permitted
without any further permission from Dove Medical Press Limited, provided the work is properly
attributed. For permission for commercial use of this work, please see paragraphs 4.2 and 5 of our Terms.