Back to Journals » Drug Design, Development and Therapy » Volume 19
Allicin Aplealleviates Gouty Arthritis by Regulating the Gut-Joint Axis, Reducing XOD Activity, Inhibiting Oxidative Stress, and Suppressing NLRP3 Inflammasome Activation
Authors Wu H, Pang MM, Li YL, Hong JH, Liu PM, Bian M, Yang JJ
Received 13 May 2025
Accepted for publication 26 August 2025
Published 8 September 2025 Volume 2025:19 Pages 7887—7907
DOI https://doi.org/10.2147/DDDT.S540116
Checked for plagiarism Yes
Review by Single anonymous peer review
Peer reviewer comments 2
Editor who approved publication: Professor Anastasios Lymperopoulos
Hao Wu,1,* Mi-mi Pang,2,* Yao-lei Li,3 Jia-hui Hong,1 Pan-miao Liu,1 Meng Bian,4 Jian-jun Yang1
1Department of Anesthesiology, Pain and Perioperative Medicine, The First Affiliated Hospital of Zhengzhou University, Zhengzhou, 450000, People’s Republic of China; 2Henan Key Laboratory of Chronic Disease Prevention and Therapy & Intelligent Health Management, The First Affiliated Hospital of Zhengzhou University, Zhengzhou, 450000, People’s Republic of China; 3National Institutes for Food and Drug Control, Beijing, 102629, People’s Republic of China; 4Department of Chinese Medicine, The First Affiliated Hospital of Zhengzhou University, Zhengzhou, 450000, People’s Republic of China
*These authors contributed equally to this work
Correspondence: Jian-jun Yang; Meng Bian, First Affiliated Hospital of Zhengzhou University, East Jian-She Road, Er-Qi District, Zhengzhou, 450000, People’s Republic of China, Email [email protected]; [email protected]
Background: Gouty arthritis (GA) is a common joint inflammation closely related to hyperuricemia and urate crystal deposition, and its incidence is on the rise worldwide. Allicin, the primary biologically active component found in freshly crushed garlic extracts, has been reported to possess many beneficial biological functions.
Methods: An animal model was used to evaluate the efficacy of allicin on GA rats, and 16S rRNA sequencing and metabolomics were used to explore changes in the gut microbiota and metabolites. Fecal microbiota transplantation (FMT) and fibroblast-like synoviocytes (FLS) used to explore the mechanism of allicin treating GA.
Results: The results showed that allicin effectively improved the general state of GA rats, inhibited XOD activity, and significantly reduced ROS production and activation of the NLRP3 inflammasome, thereby exerting therapeutic efficacy to protect the kidneys and joints. Examination of the gut microbiota showed that the composition of the gut microbiota of GA rats improved after allicin treatment (increase in Lactobacillus). Metabolomic analysis revealed a significant increase in gut microbial short-chain fatty acid metabolites (butyric acid) following allicin treatment. Furthermore, FMT confirmed that allicin significantly alleviated GA and increased butyric acid content in a gut microbe-dependent manner. Finally, the role of butyric acid in inhibiting ROS generation and NLRP3 inflammasome activation in FLS was elucidated.
Conclusion: This study highlights allicin as a promising therapeutic candidate for GA, emphasizing its potential to inhibit oxidative stress and inflammatory responses by regulating the gut-joint axis.
Keywords: gouty arthritis, allicin, oxidative stress, nlrp3 inflammasome, gut microbiome, metabolites
Introduction
Gouty arthritis (GA) is a common inflammatory condition that is progressive and can lead to significant disability. It is closely associated with hyperuricemia and the deposition of urate crystals, and its incidence is rising, particularly among younger individuals worldwide.1–3 Epidemiological data on GA indicates that the prevalence is increasing annually, with a global prevalence of 1–4% and an incidence of 0.1–0.3%. Additionally, GA affects 3.9% of adults and 8.7% of people over the age of 80.4,5 As living standards improve, the consumption of processed foods increases, and the use of medications that elevate uric acid levels becomes more widespread, the annual incidence of GA continues to rise. This trend results in substantial health losses, disabilities, and economic burdens, placing significant strain on global healthcare systems.6–8
Modern medicine for GA treatment mainly includes febuxostat, benzbromarone, allopurinol, nonsteroidal drugs, and glucocorticoids, and each treatment stage is targeted.9–12 However, it is more challenging for existing pharmaceutical agents to target inflammatory lesions and rapidly inactivate the systemic circulation, resulting in reduced efficacy, drug side effects, and adverse drug reactions.13–16 Therefore, there is an urgent clinical need to find a safe, effective, and economical new drug for uric acid-lowering anti-inflammatory treatment of GA.
Garlic is widely used as a flavoring agent because of its intense and distinctive flavor. Allicin is a biologically active component of garlic. Several studies have explored the potential health benefits of allicin. Allicin possesses antioxidant,17,18 anti-inflammatory,19,20 antidiabetic,21,22 cardioprotective.23,24 Previous studies have shown that allicin inhibits XOD activity, suggesting that allicin may exert a urate-lowering effect.25 It has also been shown that allicin regulates NLRP3 inflammasomes and inflammatory responses.26,27 As a drug with urate-lowering and anti-inflammatory activities, the effects of allicin on GA are an exciting research topic.
In recent years, increasing evidence has suggested that the gut microbiota and its metabolites play a significant role in GA, including purine metabolism, uric acid excretion, protection of the intestinal barrier, and regulation of immune function.28–32 Our previous studies have also indicated that the gut microbiota is closely associated with GA, and regulating the gut microbiota may be an effective method for treating GA.33 Dietary organic sulfur compounds are known for their low bioavailability, and the therapeutic effects of allicin on GA may be closely related to the remodeling of the gut microbiota and its metabolites. Recent studies have shown that changes in the gut microbiota are associated with the development of GA, suggesting its potential for monitoring the onset, progression, and recovery of GA, and implying the existence of an gut-joint axis.34–37 Therefore, the therapeutic effects of allicin on GA may be closely related to the gut-joint axis.
This study first identified the anti-GA effect of allicin in rats and then evaluated changes in the gut microbiome and metabolome. Furthermore, fecal microbiota transplantation (FMT) confirmed that allicin alleviated GA in a gut microbiota-dependent manner. Finally, the inhibitory effect of butyric acid, a microbial metabolite of allicin, on ROS production and NLRP3 inflammasome activation in fibroblast-like synovial cells (FLS) was identified. Overall, the aim of this study was to demonstrate that allicin may be an effective therapeutic agent for GA by reducing oxidative stress and inflammatory responses through regulation of the gut-joint axis.
Materials and Methods
Antibodies and Reagents
Allicin (purity > 99%) was obtained from Shanghai Macklin Biochemical Co. Ltd. (Shanghai, China). Potassium oxonate and monosodium urate were sourced from Sigma-Aldrich (St. Louis, MO, USA). Yeast powder (LP0021B) was purchased from Oxoid (Basingstoke, United Kingdom). Antibodies against NLRP3 (27458-1-AP) and β-actin (20536-1-AP) were sourced from Proteintech (Rosemont, IL). Antibodies against vimentin were obtained from Bioss (Beijing, China). Allopurinol (purity > 99%) and colchicine (purity > 99%) were also purchased from Shanghai Macklin Biochemical Co. Ltd. (Shanghai, China). The reagents for detecting MDA, GSH, SOD, and DCHF-DA were obtained from Solarbio (Beijing, China). Reagent test kits for TNF-α, IL-8, IL-18, IL-1β, ASC, and Caspase-1 were sourced from Jianglai (Shanghai, China). The reagents for measuring serum and fecal uric acid (UA), serum creatinine (Cre), serum urea nitrogen (BUN), and butyric acid test kits were purchased from Jiancheng Biological Technology Co., Ltd. (Nanjing, China). Collagen I was obtained from Santa Cruz Biotechnology (Dallas, TX, USA). DMSO and all other chemicals were sourced from Sigma-Aldrich (St. Louis, MO, USA).
Animals
Male Sprague-Dawley rats, specifically pathogen-free, weighing between 200 and 220 g, were acquired from SPF Biotechnology Co., Ltd. in Beijing, China. Prior to the formal experiments, the rats were given food and water to acclimatize to their new environment for one week. The temperature was maintained between 21°C and 25°C, with humidity levels kept between 50% and 70%. A light/dark cycle of 12 hours was also established. All laboratory procedures were carried out in accordance with the UK Animals (Scientific Procedures) Act 1986 and relevant guidelines.38 And it received approval from the Welfare and Ethics Committee of the Zhengzhou University Laboratory Animal Centre (approval number: NO. 202206290101).
Animal Treatment with Allicin
A flowchart outlining the in vivo experiments is presented in Figure 1A. Sixty rats were randomly divided into six groups (SPSS version 23.0), each containing ten rats (n = 10): a normal control group (Con), a model group treated with potassium oxonate (GA group, Mod), a low-dose allicin group (All-L, 15 mg/kg), a high-dose allicin group (All-H, 30 mg/kg), an allopurinol-positive drug group (Alr, 10 mg/kg), and a colchicine group (Col, 0.35 mg/kg). To establish hyperuricemia models, we administered 750 mg/kg potassium oxonate, 10 g/kg yeast, and 0.5% CMC-Na in the Mod, All-L, All-H, Alr, and Col groups. The Con group received an equal volume of 0.5% CMC-Na solution. Four hours after this administration, the treatment groups were given their respective doses of allicin, allopurinol, and colchicine via intragastric administration, while the Con and Mod groups received 0.5% CMC-Na. All treatments were conducted daily for seven consecutive days. On the fifth day of the experiment, a 25 mg/mL monosodium urate suspension (0.15 mL) was injected into the ankle joint cavity of rats in the model group and each treatment group using a sterile syringe. In contrast, rats in the normal control group received the same volume of saline in the same manner. On Day 7, 24-hour urine samples were collected from metabolic cages. All rats were sacrificed at the end of Day 8, and blood samples were collected. The liver, kidney, and joint tissues were quickly harvested using an ice disc. After weighing and recording the tissues, a portion was used for biochemical analysis, Western blotting, and ROS detection. The remaining tissues were fixed in 4% paraformaldehyde for histopathological analysis.
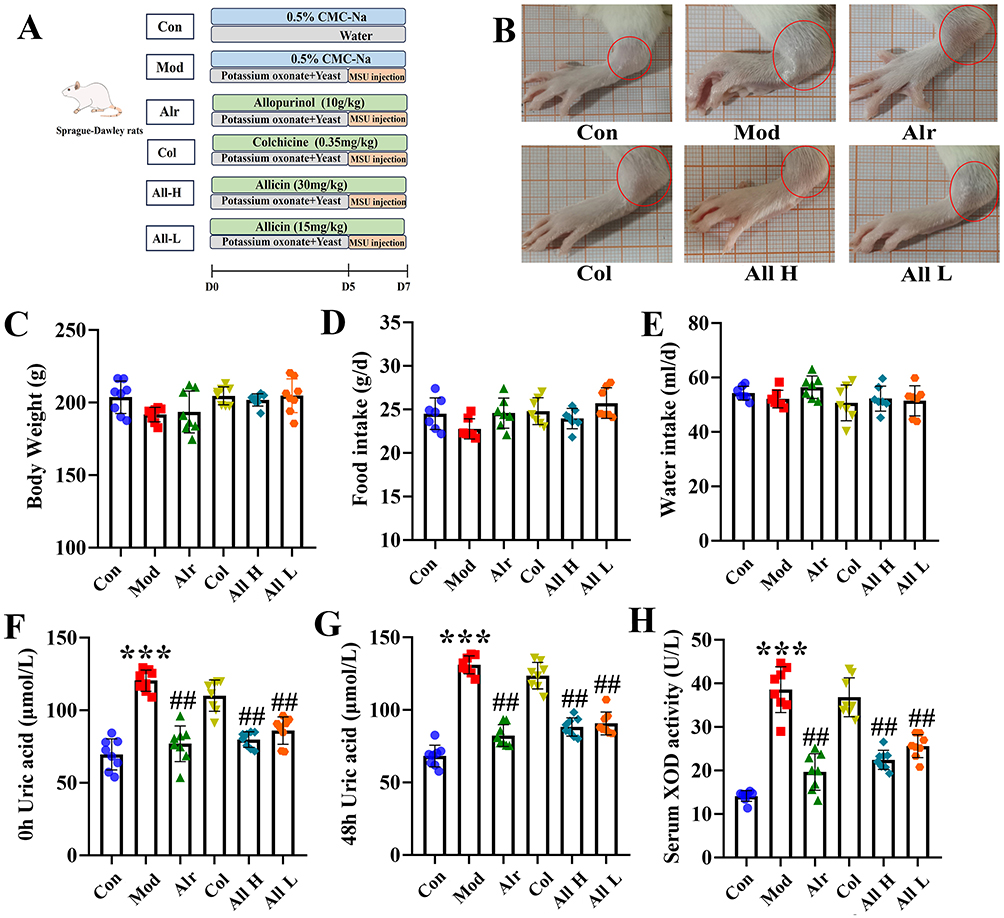 |
Figure 1 The general state of GA rats after allicin treatment. (A) The flowchart of the part in vivo experiments. (B) Swelling degree of joints in each group. (C) The body weight of rats in each group. (D) The food intake. (E) The water intake. (F) The serum uric acid level was 0 h before the joint MSU injection. (G) The serum uric acid level was 48 h after the joint MSU injection. (H) The XOD activity in the serum in each group. Data are expressed as mean ± SEM for 8 rats in each group. ***P < 0.001 versus Con group, ##P < 0.01 versus Mod group. |
Allicin for GA Rats by Fecal Microbiota Transplantation Treatment
The rats were randomly assigned to three groups (SPSS version 23.0): Con, Mod, and All, with 10 rats in each group. The modeling method for each group followed the same procedure as described previously. All groups of rats received allicin orally at a dosage of 30 mg/kg once daily (a high-dose allicin group). Feces from the donor rats were collected daily for seven days in a laminar flow fume hood under sterile conditions. Feces from each group were suspended in 1 mL of sterile saline, and the supernatant was collected as the transplant material. To prevent changes in bacterial composition, fresh graft material was prepared within 10 minutes before tube feeding on the day of transplantation. Recipient rats were randomly divided into FT-Con, FT-Mod, and FT-All groups. The recipient groups were administered fresh fecal transplant material (corresponding to the donor groups Con, Mod, and All) orally every day for 7 days.
Assessment of Skin Temperature and Ankle Edema After Allicin Treatment
The skin temperature of the ankle joint was measured using thermometers at 4, 8, 12, 24, and 48 hours after the injection of monosodium urate (MSU). An increase in ankle circumference was used to evaluate the formation of ankle edema. Ankle circumference was measured 0.5 mm below the ankle using a digital caliper before the injection and at 4, 8, 12, 24, and 48 hours afterward. Each measurement was repeated three times to obtain an average value. The degree of ankle swelling (ASD) was calculated using the following formula:3
Ankle Swelling Degree (%) = [(ankle circumference after modeling (mm) - ankle circumference before modeling (mm)) / ankle circumference before modeling (mm)] × 100.
Assessment of Autonomous Activity After Allicin Treatment
The posture score, gait score, and inflammatory index of the rats in each group were assessed at 12 and 24 h after ankle MSU injection. The evaluation was conducted by three testers, each based on the following criteria:39,40
Posture Score: Each group of rats was placed in a plexiglass chamber with a mirror at the bottom and was allowed to move freely for 5 min. The scoring criteria for posture were as follows: level 0, normal; the weight of both hind paws was the same, score 0; level 1, slightly abnormal, the back paws were entirely on the ground, but the toes were curled up, 2 points; level 2, moderate abnormality, with the toes curled up and the hind paws partially on the ground, 4 points; level 3, severe abnormality, back paws entirely off the ground, score 6 points.
Gait Score: The same posture score was observed for 5 min. The gait grading criteria were as follows: level 0, normal gait; the weight of both hind paws was the same, score 0; grade 1: slight claudication, excessive crouching of the foot after injection during walking, score 2; level 2: claudication, short foot landing after injection while walking; 4 points; level 3: severe claudication, three feet on the ground, score 6 points.
Inflammatory Activity: 0 points: the ankle joint has obvious bone signs; 3 points: slight swelling of the ankle joint, visible bone signs; 4 points: the ankle joint is severely swollen, and the bony signs are not visible; and 6 points: edema of limbs except the ankle joints.
Detection of Uric Acid, Creatinine, and Blood Urea Nitrogen in Serum and Urine After Allicin Treatment
Blood and urine samples were centrifuged at 3500 rpm for 15 minutes at 4 °C to separate the supernatant from any precipitate. The uric acid level was measured using enzyme colorimetry, following the manufacturer’s instructions. The urea nitrogen assay was conducted using the urea enzyme method, and the creatinine level was assessed using the sarcosine oxidase method, also in accordance with the manufacturer’s guidelines.
Histopathological Examination in GA Rats After Allicin Treatment
The rats were sacrificed 48 hours after the injection of MSU, and both kidney and joint tissues were preserved for analysis. The kidney tissue was fixed in standard paraffin and sliced into 4-micrometer-thick sections for H&E staining. The ankle samples were fixed in 4% paraformaldehyde for 24 hours, then decalcified using EDTA-2Na. Afterward, the ankle samples were dehydrated through a graded series of alcohol, embedded in paraffin, and sliced into 3-micrometer sections, which were then H&E stained.
Measurement of Biochemical Indicators in GA Rats After Allicin Treatment
Blood samples were centrifuged at 3500 rpm for 15 minutes at 4°C. The serum was then collected, and the expression levels of XOD, TNF-α, IL-1β, IL-8, and IL-18 were measured according to the manufacturer’s instructions. Subsequently, the joints of the rats were dissected, and the synovial tissue was collected and homogenized. The expression levels of SOD, MDA, and GSH were also determined following the manufacturer’s guidelines.
Acquisition and Culture of Primary Fibroblast-Like Synoviocytes
In this study, fibroblast-like synoviocytes (FLS) were extracted from the synovial tissues of rat joints. To begin, the rats were soaked in 75% ethanol for 20 minutes. Both stifle joints were then excised, washed with PBS, and transferred to PBS dishes containing 100 μg/mL penicillin and 100 mg/mL streptomycin. This process was conducted on a super clean bench under sterile conditions, with the samples kept in an ice bath and soaked in PBS. The synovial tissues were cut into small pieces measuring 1 mm × 1 mm × 1 mm. After low-speed centrifugation, the supernatant was discarded. One milliliter of 0.2% Collagenase type I was added to resuspend the synovial tissues, which were then transferred to a culture flask to ensure even distribution. The tissue was digested for 4 hours at 37 °C in a 5% CO2 environment. The morphology of the tissues was observed to resemble cotton wool, and digestion was terminated by adding 10% FBS. Following this, the synovial tissues were collected and subjected to low-speed centrifugation again. The supernatant was collected and added to a complete culture medium. The cell growth and morphology were observed daily.
Immunofluorescence Staining
Third-generation synovial cells were cultured and passaged, then fixed in 4% paraformaldehyde for 20 minutes. After fixing, the cells were washed twice with phosphate-buffered saline (PBS) and permeabilized with 0.2% Triton X-100 at 37 °C for 20 minutes. Subsequently, a mouse anti-vimentin antibody (1:200) was added and incubated overnight at 4 °C. Following this, a fluorescent anti-mouse IgG (1:500) was applied and incubated for 1 hour. The nuclei were stained with DAPI for 15 minutes, and the cells were mounted with an anti-fluorescent quencher. Fluorescence microscopy was performed, and images of the cells were captured. The purity of the FLS was assessed based on vimentin staining, with more than 98% of the synoviocytes exhibiting vimentin positivity, confirming that over 98% were FLS.
Cell Treatment
Cells were cultured in DMEM (HyClone) medium supplemented with 10% fetal bovine serum (Gibco) at 37 °C in an atmosphere of 5% CO2. Subculturing was performed when cell confluence exceeded 70%. The cells used for experimentation were in passages three to seven and exhibited stable growth. They were reseeded in 6-well plates and stimulated with MSU in the model group, while the treatment group received both MSU and allicin (20 mM). After 24 hours of culture, the cells were collected for detection and analysis. All in vitro experiments were repeated three times to ensure reliability.
Reactive Oxygen Species (ROS) Assay
Total reactive oxygen species (ROS) levels were measured using DCFH-DA staining. The cells were incubated in a DCFH-DA staining solution at a concentration of 10 µmol/L for 20 minutes at 37°C. After incubation, the cells were washed three times with phosphate-buffered saline (PBS) to stop the reaction. Finally, the mean fluorescence intensity was compared using flow cytometry.
Western Blot Analysis
Rat synovial tissue samples were collected for tissue homogenization and cell lysis. The fibroblast-like synoviocytes (FLS) were washed three times with phosphate-buffered saline (PBS), and protein samples were obtained through cell lysis. Protein concentrations were measured using the BCA protein assay kit from Beyotime Biotech Inc. in Shaanxi, China. The protein samples were then separated using sodium dodecyl sulfate-polyacrylamide gel electrophoresis (SDS-PAGE) at a voltage of 70 V for 120 minutes. Following this, the protein bands were transferred to polyvinylidene fluoride (PVDF) membranes from Bio-Rad in Hercules, CA, USA. The membranes were incubated overnight at 4 °C with diluted primary antibodies. After a 2-hour incubation with horseradish peroxidase (HRP)-labeled secondary antibodies, protein signals were measured using an enhanced chemiluminescence (ECL) visualization system from Pierce Biotechnology. The intensity of the protein bands was analyzed using Image Lab analysis software from Bio-Rad.
16S rRNA Sequencing
The total genomic DNA of the microbial community was extracted from each set of rat fecal samples following the instructions provided in the PF Mag-Bind Stool DNA Kit (Omega Bio-tek, Georgia, USA). The integrity of the extracted genomic DNA was assessed using 1% agarose gel electrophoresis, while the concentration and purity of the DNA were determined with a NanoDrop 2000 (Thermo Scientific, USA). PCR amplification of the V3-V4 variable region of the 16S rRNA gene was performed using the upstream primer 338F (5′-ACTCCTACGGGGGAGGCAGCAG-3′) and the downstream primer 806R (5′-GGACTACHVGGGGTWTCTAAT-3′). The amplified products were analyzed for 16S rRNA using the barcode sequence. The purified PCR products were then used to construct libraries with the NEXTFLEX Rapid DNA-Seq Kit (Bioo Scientific, Austin, Texas, USA) and were sequenced using the PE300/PE250 platform (Illumina, Shanghai, China).
Non-Targeted Metabolomics
Metabolite extraction was conducted by placing 200 mg of fecal sample into a 2 mL centrifuge tube along with 6 mm-diameter grinding beads. For the extraction, 400 μL of an extraction solution (methanol:water in a 4:1 ratio, v:v) containing 0.02 mg/mL of an internal standard (L-2-chlorophenylalanine) was added. The sample was ground in a frozen tissue mill for 6 minutes at −10 °C and 50 Hz, followed by a cryo-extraction at 5 °C for 30 minutes at 40 kHz. After being allowed to stand at −20 °C for 30 minutes, the samples were centrifuged for 15 minutes at 4 °C and 13,000 g. The supernatant was then pipetted into a syringe vial equipped with an internal cannula for analysis. The samples were separated using an HSS T3 column (100 mm × 2.1 mm i.d., 1.8 µm) and analyzed through mass spectrometry. Mobile phase A consisted of 95% water and 5% acetonitrile (with 0.1% formic acid), while mobile phase B contained 47.5% acetonitrile, 47.5% isopropanol, and 5% water (also with 0.1% formic acid). For the mass spectrometry conditions, the Ion Spray voltage was set to 3500 V for positive ion mode and 2800 V for negative ion mode. The sheath gas was maintained at 40 psi, with the auxiliary heating gas at 10 psi. The ion source heating temperature was set to 400 °C, and the cyclic collision energy ranged from 20 to 60 V. The MS1 resolution was 70,000, while the MS2 resolution was 17,000.
Statistical Analysis
All experimental results were analyzed using IBM SPSS version 23.0 for Windows (USA). One-way ANOVA was employed when the variance was consistent across the data. In cases where variance was inconsistent, non-parametric tests were utilized. Data are presented as mean ± standard deviation (SD), and statistical significance was determined at a level of P < 0.05.
Results
General State and Expression Level of Uric Acid in GA Rats After Allicin Treatment
Experimental flowchart of allicin in the treatment of GA rats (Figure 1A). Observation of the joints revealed that 24 hours after the injection, the level of joint swelling in the Mod group was significantly higher than in the other groups. In contrast, joint swelling decreased in both the All H and All L groups (Figure 1B). Analysis of the body weight, food intake, and water intake of the rats showed no significant differences among the groups (Figure 1C–E). Serum uric acid levels were measured both before and 48 hours after the joint injection in each group. The results suggest that allicin effectively alleviated joint swelling and reduced serum uric acid levels, as well as the expression levels of the uric acid-producing enzyme (XOD) (Figure 1F–H).
The Therapeutic Effect of Allicin on Joints in GA Rats
The results indicated that the degree of joint swelling in the Mod group was significantly higher than that in the Con group at 4, 8, 12, 24, and 48 hours following MSU injection (P < 0.01), with the peak swelling occurring at 12 hours post-injection. In comparison to the Mod group, the swelling in the tested joints of the Col, All H, and All L groups showed significant reduction (P < 0.05, P < 0.01) at 8, 12, 24, and 48 hours after MSU injection into the ankle joint suspension (Table 1). The skin temperatures of the joints in each group were measured. The results indicated that the skin temperature of the joints in the Mod group was significantly higher than that in the Con group at 4, 8, 12, 24, and 48 hours after the joint injection of the MSU suspension (P < 0.01), peaking at 12 hours post-injection. In comparison to the Mod group, the skin temperatures of the joints in the Col and All H groups were significantly lower at 4, 8, 12, 24, and 48 hours after the MSU suspension (P < 0.05, P < 0.01) (Table 2). The posture, inflammatory, and gait scores of the Mod group were significantly higher than those of the Con group at both 12 and 24 hours after the joint injection of MSU suspension (P < 0.01). In comparison to the Mod group, the postural, inflammatory, and gait scores of the Col, All H and All L groups were significantly reduced (P < 0.05, P < 0.01) (Table 3).
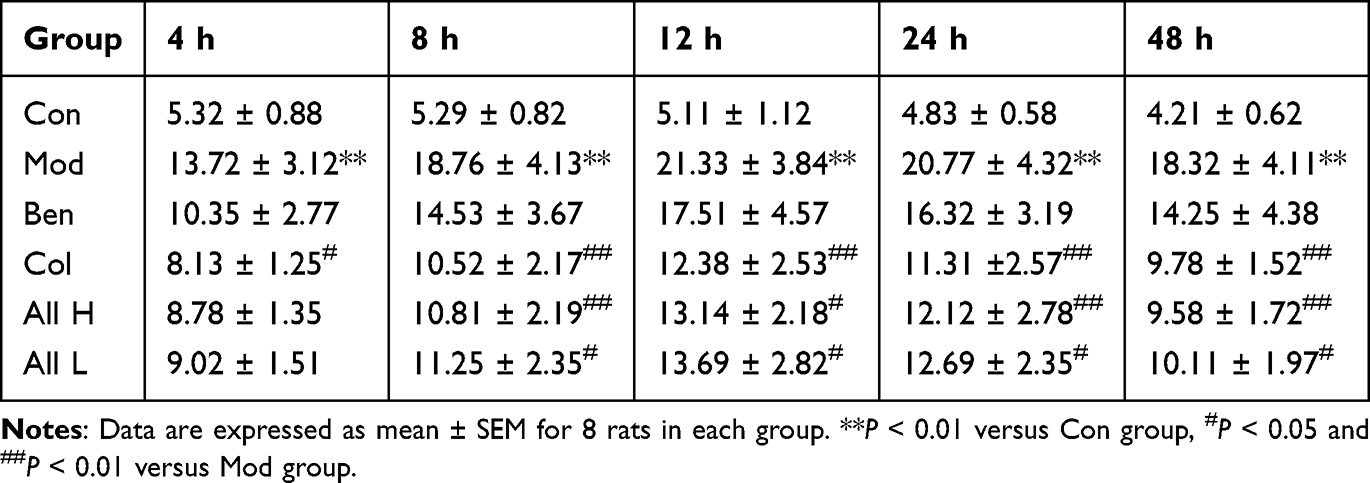 |
Table 1 Effect of Allicin on Joint Swelling Degree at Different Time After MSU Injection in Rats with Gout |
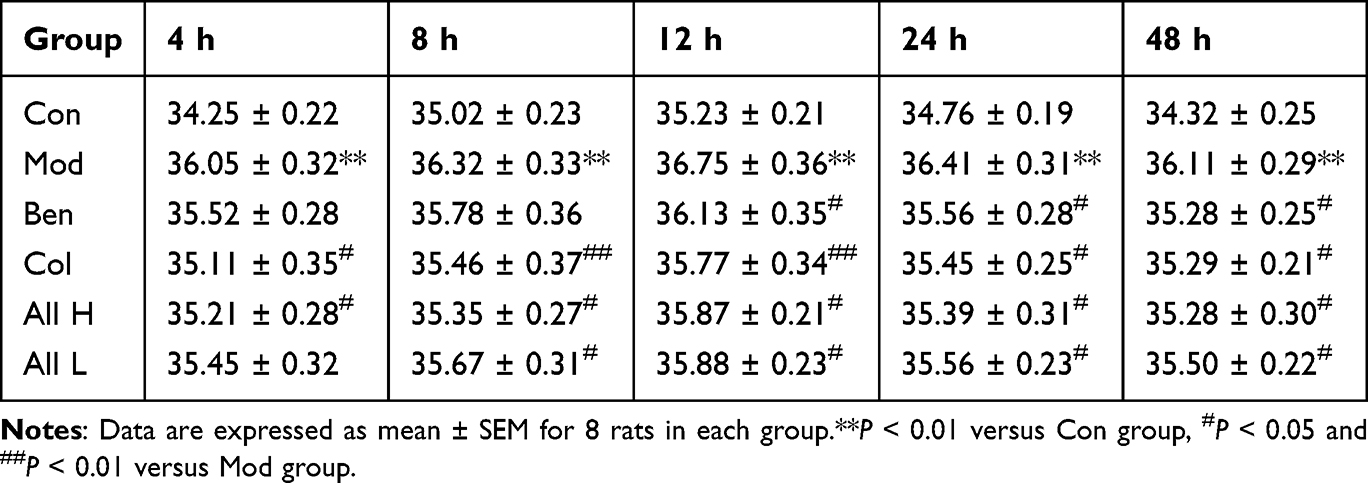 |
Table 2 Effect of Allicin on Joint Skin Temperature at Different Time After MSU Injection in Rats with Gout |
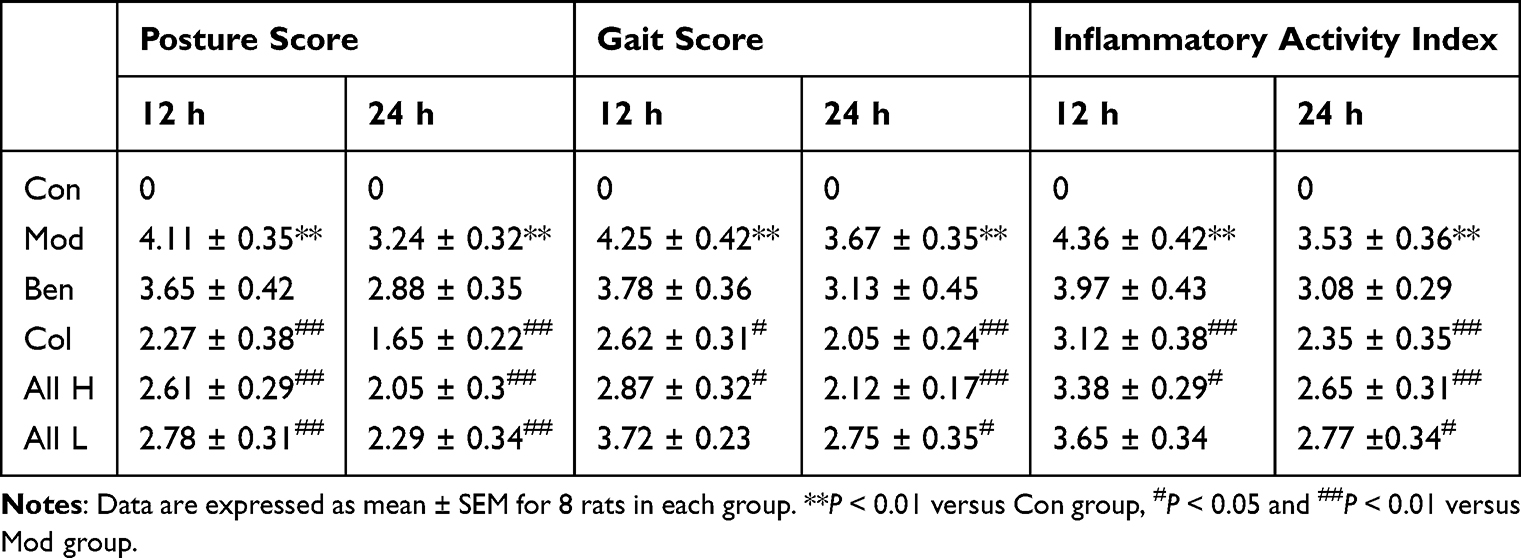 |
Table 3 Effect of Allicin on Spontaneous Activity at Different Time After MSU Injection in Rats with Gout |
Renal Function Level and Staining of HE in GA Rats After Allicin Treatment
The effects of allicin on renal function and histopathology in rats were studied. Compared with the Con group, the levels of serum urea nitrogen and creatinine in the Mod group significantly increased after 7 days of the experiment, the renal excretion fraction significantly decreased, and the renal index significantly increased (P < 0.01). Compared with the Mod group, the levels of serum urea nitrogen and creatinine in the All H and All L groups were significantly decreased (P < 0.05), and the renal excretion fraction and renal index were significantly improved (Figure 2A–D). HE staining of rat renal tissue revealed distinct differences between groups. In the Con group, the renal structure appeared normal, with clear boundaries between glomeruli and tubules. In contrast, the Mod group exhibited significant renal damage, characterized by extensive glomerular atrophy, tubular dilation, tissue edema, infiltration by inflammatory cells, epithelial cell necrosis, and shedding. The renal tissue of rats in the All and Col groups also showed signs of glomerular atrophy and severe tubular luminal dilation, along with disorganized cell demarcation. Additionally, the kidney tissues of rats in All H and All L groups displayed tubular vacuolar degeneration, occasional edema, and some inflammatory cell infiltration (Figure 2E).
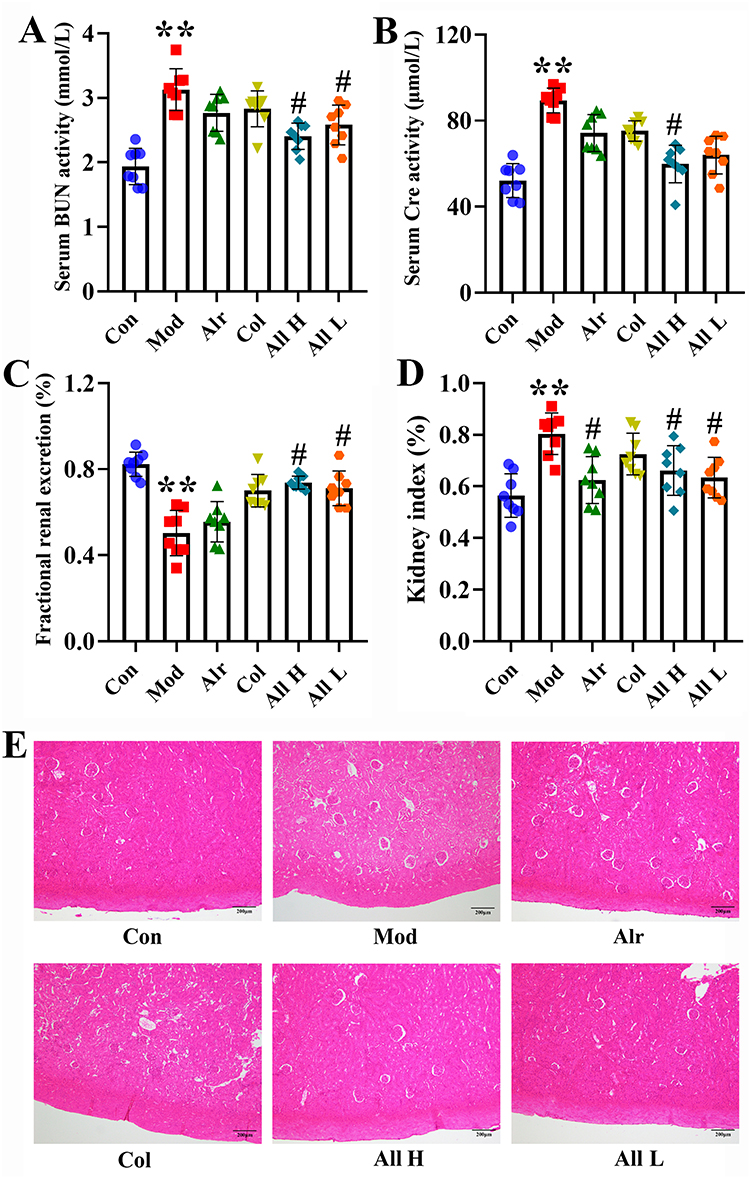 |
Figure 2 Serum kidney function, HE staining of rats in different groups. (A) The activity of BUN in the serum. (B) The activity of Cre in the serum. (C) The fractional renal uric acid excretion of the rats. (D) Kidney index. (E) HE staining. **P < 0.01 versus Con group, #P < 0.05 versus Mod group. |
The Effect of Allicin Treatment on Cytokine Expression Levels and Uric Acid Level in Synovial Fluid, Polarized Light Observation, and HE Staining in GA Rats
The ELISA assay kits detected changes in the cytokines TNF-α, IL-8, IL-18, and IL-1β. The results indicated that, compared to the Con group, the expression levels of TNF-α, IL-8, IL-18, and IL-1β in the synovial tissue of the Mod group were significantly increased (P < 0.01 or P < 0.001). In contrast, the expression levels of these cytokines in the All H and All L groups were significantly lower than those in the Mod group (P < 0.01) (Figure 3A–D). The ankle joint fluid of rats in each group was examined. The results showed that allicin treatment could reduce the uric acid content in the joint fluid. Observe uric acid deposition under a 200x polarizing microscope. No urate crystals were observed in the synovial fluid of rats in the Con group. On the contrary, different degrees of fine rod-shaped or needle-shaped urate crystals were observed in other groups. Compared with the Mod group, the degree and quantity of uric acid deposition in the All H group were significantly reduced (Figure 3E and F).
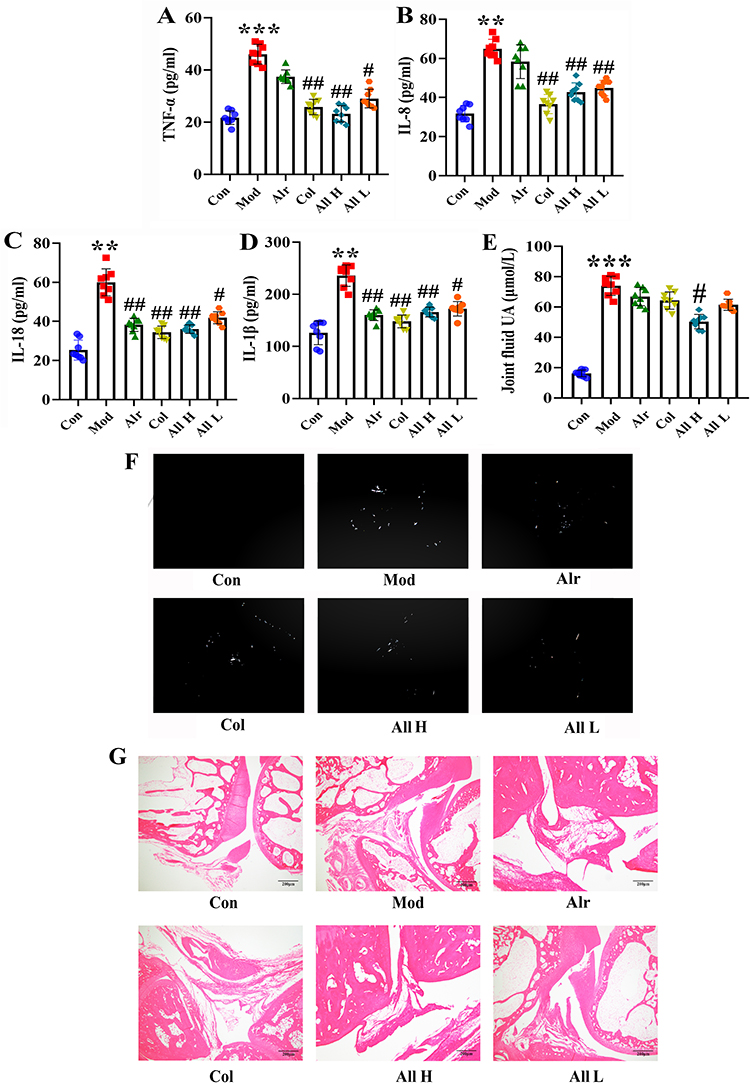 |
Figure 3 Expression of inflammatory factors and the levels of uric acid in joint fluid and HE staining of joints of rats in each group after allicin treatment. (A) The expression levels of TNF-α. (B) The expression levels of IL-8. (C) The expression levels of IL-18. (D) The expression levels of IL-1β. (E) The joint fluid uric acid level of the rats. (F) The urate crystals appeared in the synovial fluid of rats. (G) HE staining of ankle joint (200×). Data are expressed as mean ± SEM for 8 rats in each group. **P < 0.01 and ***P < 0.001 versus Con group, #P < 0.05 and ##P < 0.01 versus Mod group. |
HE staining was performed on the ankle joint tissues of rats in each group to assess histomorphological changes. The results revealed that the synovial cells in the ankle joints of the Con group were neatly arranged with no evidence of inflammatory cell infiltration. In the Mod group, there was proliferation of some synovial tissues, along with edema and numerous inflammatory cell infiltrations in the ankle joints. The Alr group also exhibited inflammation, edema, and proliferation of synovial tissue. In the Col group, only a small amount of inflammatory cell infiltration was noted in the synovial tissue of the ankle joint, accompanied by some tissue edema. Across All H and All L groups, a mild presence of inflammatory cell infiltration, occasional edema, and synovial hyperplasia were observed in the ankle joint’s synovial tissue (Figure 3G).
The Oxidative Stress and NLRP3 Inflammasome Levels After Allicin Treatment in GA Rats
To clarify the role of oxidative stress in GA, we measured the expression levels of ROS, SOD, MDA, and GSH in the synovial tissues of rat joints. The results indicated that the rats in the Mod group experienced an oxidative stress response, leading to increased ROS production. Following treatment with allicin, the ROS levels in the synovial tissue of all groups were significantly lower than the Mod group (P < 0.01 or P < 0.001) (Figure 4A and B). In comparison to the Con group, the Mod group displayed significantly lower levels of SOD and GSH in the synovial tissue (P < 0.01), while the level of MDA was significantly higher (P < 0.001). Allicin treatment can improve the expression of oxidative stress factors (Figure 4C–E).
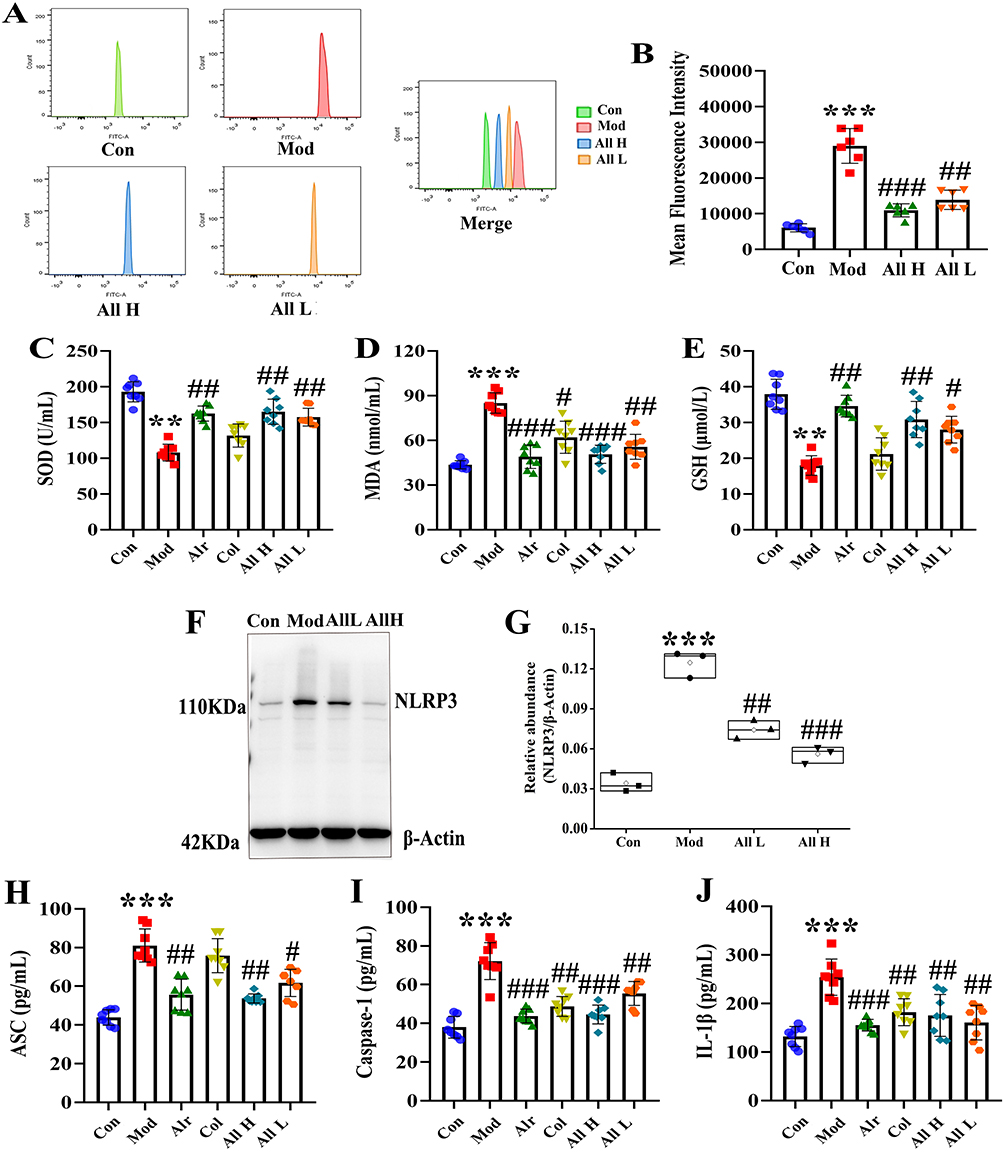 |
Figure 4 The level of oxidative stress and NLRP3 inflammasome in the joint synovial tissue of rats after allicin treatment. (A) Detection of ROS expression levels in the joint synovial tissue by flow cytometry. (B) The mean fluorescence intensity of the joint synovial tissue in each group. (C) The content of SOD in the joint synovial tissue. (D) The content of MDA in the joint synovial tissue. (E) The content of GSH in the joint synovial tissue. (F) Western blot was conducted to evaluate the protein level of NLRP3 and β-Actin in synovial tissue. (G) Box plot showing the densitometry analysis of NLRP3 normalized by β-Actin. (H) The expression level of ASC in synovial tissue. (I) The expression level of Caspase-1 in synovial tissue. (J) The expression level of IL-1β in synovial tissue. Data are expressed as mean ± SEM for 8 rats in each group. **P < 0.01 and ***P < 0.001 versus Con group, #P < 0.05, ##P < 0.01 and ###P < 0.001 versus Mod group. |
To investigate the effect of allicin on NLRP3 inflammasomes, the expression levels of NLRP3, ASC, caspase-1, and IL-1β were measured in the synovial tissues of rats from each group. It was found that when GA occurred, the NLRP3 inflammasome was activated, and the expression levels of ASC, caspase-1, and IL-1β were significantly increased. After allicin treatment, it could exert an anti-inflammatory effect by inhibiting the NLRP3 inflammasome (Figure 4F–J).
Effect of Allicin on Gut Microbial Diversity in GA Rats
The effects of allicin treatment on gut microorganisms were examined by measuring gut microbial diversity. Initially, the species profiles of the Pan and Core groups were analyzed for each sample set, revealing that both the number of gut microbial species and the sequencing sample size in each group were adequate for further analysis (Figure 5A and B). Next, the α-diversity of the samples was assessed using several indices: Sobs, Shannon, Chao, and Ace, which correspond to the number of samples, sample diversity, sample homogeneity, and sample richness, respectively. The results indicated a significant increase in the α-diversity of gut microorganisms following allicin treatment (Figure 5C–F). Further analysis of β-diversity using PCA, PLS-DA, NMDS, and NCM indicated that the gut microbial composition of rats in the Con and All groups was significantly different from that of the rats in the Mod group. The analysis with the NCM revealed that the microbial community structure in this study was more influenced by deterministic processes and less affected by stochastic processes (Figure 5G–J). Additionally, the gut microflora dysbiosis index was used to assess the degree of microbial ecological dysbiosis. The results demonstrated that allicin treatment significantly modulated the gut microbial dysbiosis induced by GA (Figure 5K).
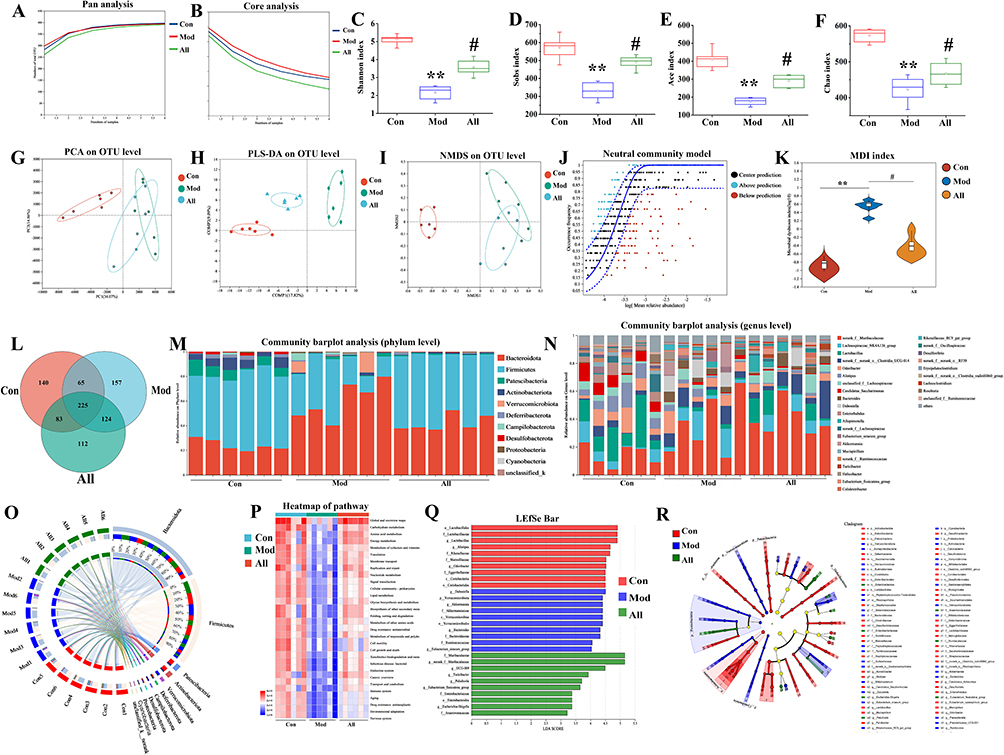 |
Figure 5 Allicin improved GA rats by restoring gut microbial diversity. (A) Pan analysis. (B) Core analysis. (C) Shannon index. (D) Sobs index. (E) Ace index. (F) Chao index. (G) PCA analysis. (H) PLS-DA analysis. (I) NMDS analysis. (J) NCM analysis. (K) Microbial dysbiosis index. (L) Venn diagram. (M) Community abundance analysis at the phylum level. (N) Community abundance analysis at the genus level. (O) Circos plots analysis at the phylum level. (P) Heat map. (Q) LDA discriminant histogram. (R) LEfSe multilevel species level tree. *P < 0.05, **P < 0.01 and ***P < 0.001 versus Con group, #P < 0.05, ##P < 0.01 and ###P < 0.001 versus Mod group. |
Analysis of the samples using Venn diagrams revealed the presence of unique or shared gut microbes in each group (Figure 5L). At the phylum level, community abundance analysis showed that the Mod group had an increased abundance of Bacteroidota and Verrucomicrobiota and a decreased abundance of Firmicutes, Patescibacteria, and Actinobacteriota and that allicin treatment reversed the effect of GA on these species (Figure 5M). We also examined the abundance of gut microorganisms at the genus level and observed differences in the dominant species among the three groups, with the Mod group being dominated by Muribaculaceae. In contrast, the Con and All groups were dominated by Lactobacillus (Figure 5N).
The circle graph shows the microorganisms and their relative abundance in each group of samples. The results suggested at the phylum level, there was a higher abundance of Firmicutes, Bacteroidota, and Patescibacteria (Figure 5O). Functional information on the microbial communities in each group of samples was predicted using the PICRUSt2 functional prediction method. Metabolic pathways in the disease processes were further predicted using functional composition and abundance (KEGG) (Figure 5P). Lefse Multilevel Species Difference Discriminant Analysis is used to test for differences among various species at multiple levels. This analysis identifies characteristic taxa with significant differences in abundance (Figure 5Q and R).
Effect of Allicin on Gut Microbial Metabolites in GA Rats
LC-MS was used to observe the changes in microbial metabolites after allicin treatment. The results showed that the QC samples were well-grouped, indicating good bioanalysis and data quality. All three groups of samples with positive and negative ions were separated using PCA (Figure 6A and B). PLS-DA showed that the intestinal metabolic profiles of rats treated with allicin differed significantly from those of rats in the Mod group (Figure 6C–E). Volcano plots illustrating changes in metabolite levels revealed that, compared to the Mod group, the Con group had 771 metabolites upregulated and 142 downregulated. When comparing the Mod group to the All group, 45 metabolites were upregulated and 108 were downregulated. Additionally, when the Con group was compared to the All group, 873 metabolites were upregulated, while 156 were downregulated (Figure 6F–H).
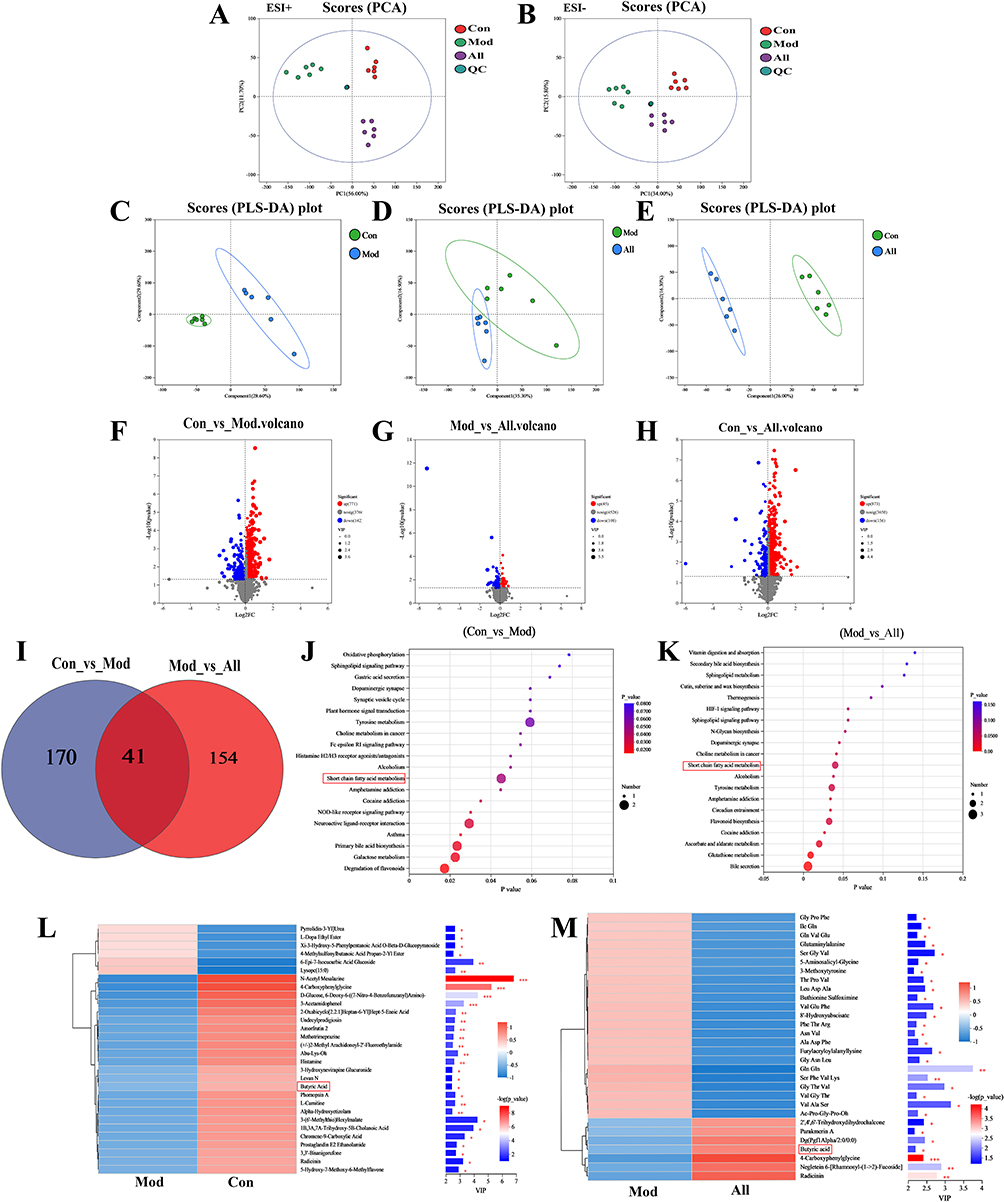 |
Figure 6 Effect of allicin on comparative analysis of gut microbial metabolites in GA rats. (A and B) PCA analysis under positive and negative ions. (C–E) PLSDA analysis under positive ions. (F–H) Volcano plots. (I) Venn diagram. (J and K) KEGG enrichment analysis. (L and M) VIP bar charts. *P < 0.05, **P < 0.01 and ***P < 0.001. |
Venn diagrams showed that 41 identical metabolites were altered after allicin treatment (Figure 6I). Short-chain fatty acids were found to be the most highly enriched pathway, indicating that the short-chain fatty acid pathway may be a key metabolic pathway in allicin-treated GA rats (Figure 6J and K).The VIP bar charts highlights the significance of the differential metabolites and their expression trends. Notably, butyric acid exhibited significantly lower expression in the Mod group but showed a marked increase in expression following allicin treatment (Figure 6L and M).
Exploring the Therapeutic Effect and Mechanism of Allicin in GA Rats by Fecal Microbiota Transplantation Model
To verify whether gut microbial metabolites mediate the protective effect of allicin in GA rats, we transplanted the gut microbiota of allicin-treated GA rats into recipient Mod rats via daily gavage (Figure 7A). There were no significant differences in body weight, food intake and water intake among the groups of rats (Figure 7B–D). The levels of serum XOD, uric acid, urea nitrogen and creatinine in the FT-Mod group were significantly higher than those in the FT-Con group. After treatment in the FT-All group, uric acid production in GA rats was reduced and renal indicators were improved (Figure 7E–I).
 |
Figure 7 Effect of allicin on GA rats after fecal microbiota transplantation. (A) The flowchart of the part in vivo experiments. (B) The body weight. (C) The food intake. (D) The water intake. (E) The XOD activity. (F) The serum uric acid level was 0 h before the joint MSU injection. (G) The serum uric acid level was 48 h after the joint MSU injection. (H) The activity of BUN in the serum. (I) The activity of Cre in the serum. (J) Detection of ROS expression levels in the joint synovial tissue by flow cytometry. (K) The mean fluorescence intensity. (L–N) The content of SOD, MDA, and GSH in the joint synovial tissue. (O–R) Inflammatory cytokines (TNF-α, IL-1β, IL-8, and IL-18) levels in joint synovial tissues. Data are expressed as mean ± SEM for 6 rats in each group. **P < 0.01 and ***P < 0.001 versus FT-Con group, #P < 0.05 and ##P < 0.01 versus FT-Mod group. |
Flow cytometry detection of ROS levels in the synovial tissue of rats in each group showed that the FT-All group had significantly reduced GA-induced ROS production, inhibited MDA expression, and increased SOD and GSH expression levels (Figure 7J–N). ELISA kits were utilized to measure the levels of TNF-α, IL-8, IL-18, and IL-1β in the synovial tissues of rats across different groups. The results indicated that the levels of pro-inflammatory cytokines in the synovial tissue of the FT-All group were significantly reduced (Figure 7O–R).
Effects of ROS and NLRP3 Inflammasome in FLS After Butyric Acid Treatment
The expression level of BA in the synovial tissues of rats in each group was detected. It was found that the BA content increased in both the allicin treatment group and the FT-All group. It suggested that butyric acid, a metabolite of gut microbes, may play a key role in the allicin treatment of GA (Figure 8A and B). To further confirm the role of BA in inhibiting oxidative stress and alleviating joint inflammation, we isolated and characterized FLS of rats. It cultured until the third passage, the cell morphology was spindle-shaped and grew well (Figure 8C). The third passage of synovial cells was used for immunofluorescent staining. Vimentin is a characteristic marker protein of FLS, and the positive rate of stained synoviocytes was > 98%, suggesting that the cultured synoviocytes were FLS (Figure 8D).
 |
Figure 8 Extraction and identification of FLS and butyric acid inhibits ROS and NLRP3 inflammasome in FLS after MSU stimulation. (A) The butyric acid content in synovial tissue of GA rats after allicin treatment. (B) The butyric acid content in synovial tissue of GA rats after allicin FMT treatment. (C) Morphology of the third-generation FLS. (D) Vimentin identifies FLS as a characteristic labeling protein. (E) Detection of ROS expression levels in FLS after adding MSU and butyric acid treatment by flow cytometry. (F) The mean fluorescence intensity of FLS in each group. (G) Western blot was conducted to evaluate the protein level of NLRP3 and β-Actin in cell lysates. (H) Box plot showing the densitometry analysis of NLRP3 normalized by β-Actin. (I) The expression level of ASC in cell supernatant. (J) The expression level of Caspase-1 in cell supernatant. (K) The expression level of IL-1β in cell supernatant. ***P < 0.001 versus Con group, ##P < 0.01 and ###P < 0.001 versus Mod group. |
FLS were further stimulated by MSU, and the effects of BA on ROS and NLRP3 inflammasomes in synovial cells following MSU stimulation were investigated. Based on preliminary research and cell viability tests, 8 μM BA was selected as the experimental drug concentration for analysis. The ROS fluorescence intensity in the BA group was substantially lower than that in the Mod group (P < 0.001). These results indicate that MSU-stimulated FLS significantly increased ROS production, while treatment with BA inhibited ROS production (Figure 8E and F). The expression levels of NLRP3, ASC, Caspase-1, and IL-1β in the cell lysates from each group were measured. The results indicated tha the expression level of NLRP3, ASC, Caspase-1, and IL-1β in the BA group was significantly decrease (Figure 8G–K).
Discussion
The incidence of GA has significantly increased worldwide due to changes in living standards and dietary habits. GA is a metabolic disease that poses serious threats to both physical and mental health.2,3 Currently, clinical treatments for GA primarily consist of small-molecule synthetic drugs that effectively target the reduction of blood uric acid levels and provide anti-inflammatory analgesia.4 Allicin is one of the many biologically active components of garlic and has significant anti-inflammatory, antioxidant, and other pharmacological effects.17–20 It has potential as an anti-GA agent. This study aims to explore the therapeutic effects of allicin on GA and clarify its mechanism through the gut-joint axis.
In the current study, it mostly used exogenous joint injection of MSU crystals to shape the GA model.41,42 Coderre used MSU crystals to inject the ankle joints of rats, which showed significant swelling at the tested joints after injection.39 There are clinical manifestations of limited mobility to establish a GA rat model, which has been widely used in the screening of anti-gout drugs. In this study, potassium oxonate and yeast gavage maintained the hyperuricemic state of rats for a long time, and MSU crystals were injected into the exogenous joints to shape the GA model in a hyperuricemic state. Simultaneously, referring to the diagnostic criteria of clinical GA, this experiment used the swelling degree of the tested joints, skin temperature of the tested joints, and spontaneous activity of the animals, including posture score, gait score, and inflammatory index, to assess the clinical characteristics of GA model animals.43,44 Clinical GA disease characteristics can be fully simulated by detecting serum uric acid levels in model animals and by pathological observation of synovial tissue at the tested joints. Based on this animal model, we found that allicin significantly reduced ankle swelling and skin temperature, and improved the limitation of spontaneous movement in rats with GA. Histopathological observations showed that allicin significantly inhibited the infiltration of inflammatory cells in the synovium of the tested ankles 48 h after joint injection and significantly improved synovial tissue edema, vascular proliferation, and other lesions, suggesting that allicin has an excellent anti-gout effect. Liver and kidney function indices were measured seven days after the administration of allicin, along with an observation of liver and kidney histopathology. And it showed that allicin had no significant effect on liver and kidney function. Histopathological analysis revealed that the liver and kidney tissue structures appeared normal, with epithelial cells arranged neatly, and no signs of inflammatory infiltration or pathological changes were observed (Supplementary Figure S1). These results suggest that allicin has therapeutic effects in improving the general condition of GA, without causing significant damage to the liver and kidneys, indicating its safety.
Current research indicates that oxidative stress and inflammatory responses are key pathological features of GA.45–47 XOD is a key enzyme in the uric acid synthesis process within the uric acid metabolism target group. XOD uses hypoxanthine or xanthine as substrates to produce superoxide. Uric acid is the end product of purine metabolism. Uric acid concentrations above physiological levels primarily precipitate as crystals in bodily tissues or organs, potentially causing mitochondrial damage, promoting the expression and release of ROS, and triggering inflammatory responses.48,49 Our research found that during GA attacks, XOD expression levels significantly increased, leading to increased ROS production, which further activated the NLRP3 inflammasome and exacerbated the inflammatory response. This study showed that allicin can further reduce XOD activity and ROS production, restore oxidative stress balance, inhibit the activation of the NLRP3 inflammasome, and regulate the expression of pro-inflammatory cytokines.
Dietary organosulfur compounds have low bioavailability and can function through metabolites fermented by gut microbiota.50–52 Therefore, this study examined the gut microbiota and metabolites in allicin-treated GA rats. This study found through 16S rRNA sequencing results that allicin significantly improved the α and β diversity of intestinal microbiota in GA rats. After allicin treatment, its species composition became more similar to that of normal rats. The MDI index also showed that allicin treatment significantly regulated the intestinal microbiota dysbiosis caused by GA. At the phylum level, AB4 increased the abundance of Firmicutes and Actinobacteriota, which are key dominant species in the gut microbiota. Further analysis of relative abundance at the genus level revealed that allicin significantly increased the abundance of Lactobacillus and decreased the abundance of Muribaculaceae. Lactobacillus is a probiotic that has been shown to alleviate various diseases and reduce inflammatory responses. Finally, after AB4 treatment, Lefse multi-level species difference discriminant analysis and PICRUSt2 functional prediction were used to analyze microbial taxonomic and functional information, indicating that gut microbiota may play a key role in the process of allicin inhibiting GA-induced inflammation. In this study, we analyzed the intestinal metabolites of GA rats treated with allicin using non-targeted metabolomics, and the results showed that the main metabolic pathways involved were SCFA metabolism. SCFAs are metabolites produced by gut microbiota in the intestine and can inhibit inflammatory responses.53,54 Further analysis revealed that allicin treatment primarily affects the levels of SCFA metabolites BA in the gut microbiota. This may be one of the key mechanisms through which allicin treatment modulates the gut-joint axis in GA.
Additionally, FMT confirmed that the protective effect of allicin on GA rats is mediated by SCFAs produced by the gut microbiota.55,56 When the gut microbiota from GA rats treated with allicin was transplanted into recipient Mod rats, BA levels significantly increased, effectively alleviating GA-related symptoms, reducing oxidative stress and inflammatory responses in rat joints, and effectively lowering uric acid levels. These findings suggest that allicin exerts its therapeutic effects on GA by regulating the gut microbiota and its metabolic products. Finally, the effects of BA on synovial cells stimulated by MSU were investigated in vitro by extracting FLS to explore the mechanism. We found that BA significantly inhibited ROS production and NLRP3 inflammasome activation, suggesting that BA is a key metabolite in the therapeutic effects of allicin on GA. These results indicate that allicin may treat GA by regulating the gut-joint axis and improving gut microbiota metabolites, thereby further inhibiting oxidative stress and inflammatory responses. At the same time, this study can further validate the therapeutic effect of GA by targeting specific microbiota and metabolites, and explore the effects of allopurinol and colchicine treatment on gut microbiota metabolites and therapeutic mechanisms. This will help clarify the potential of allicin as a therapeutic agent for GA.
Conclusions
In summary, the results of this study indicate that allicin may be a potential treatment for GA, effectively alleviating the pathological symptoms of GA attacks, reducing uric acid levels and inflammatory responses, and exerting protective effects on the kidneys and joints. Further research has found that allicin primarily reduces oxidative stress and NLRP3 inflammasome activation to improve GA by regulating intestinal microbiota (Lactobacillus) and metabolites (butyric acid). This study reveals a new mechanism for the protective effect of allicin on GA. Our data may provide a promising GA treatment method by targeting key metabolites or bacteria.
Data Sharing Statement
Data supporting the findings of this study are available on reasonable request to the correspondence author.
Ethics Approval and Consent to Participate
All laboratory procedures were performed according to the UK Animals (Scientific Procedures) Act 1986 and associated guidelines, and were approved by the Welfare and Ethics Committee of the Zhengzhou University Laboratory Animal Centre (approval number: NO. 202206290101).
Author Contributions
All authors made a significant contribution to the work reported, whether that is in the conception, study design, execution, acquisition of data, analysis and interpretation, or in all these areas; took part in drafting, revising or critically reviewing the article; gave final approval of the version to be published; have agreed on the journal to which the article has been submitted; and agree to be accountable for all aspects of the work.
Funding
This work was supported by the Joint Construction Project of Henan Province Medical Science and Technology Research Program (LHGJ20240249), the State-Sponsored Postdoctoral Researcher Program of China (GZC20232422), the National Natural Science Foundation of China (No. U23A20421, 82404944), and Natural Science Foundation of Henan Province (No. 242300420383, 252300420544).
Disclosure
The authors declare that they have no known competing financial interests or personal relationships that could influence the work reported in this study.
References
1. Rai SK, Aviña-Zubieta JA, McCormick N, et al. The rising prevalence and incidence of gout in British Columbia, Canada: population-based trends from 2000 to 2012. Semin Arthritis Rheum. 2017;46(4):451–456. doi:10.1016/j.semarthrit.2016.08.006
2. Kumar M, Manley N, Mikuls TR. Gout flare burden, diagnosis, and management: navigating care in older patients with comorbidity. Drugs Aging. 2021;38(7):545–547. doi:10.1007/s40266-021-00866-2
3. Perez-Ruiz F, Dalbeth N, Bardin T. A review of uric acid, crystal deposition disease, and gout. Adv Ther. 2015;32(1):31–41. doi:10.1007/s12325-014-0175-z
4. Song J, Jin C, Shan Z, Teng W, Li J. Prevalence and Risk Factors of Hyperuricemia and Gout: a Cross-sectional Survey from 31 Provinces in Mainland China. J Transl Int Med. 2022;10(2):134–145. doi:10.2478/jtim-2022-0031
5. Yang N, Sunb C, Dong C, Huang Y, Zhu Y, Gu Z. Emerging microfluidics for the modeling and treatment of arthritis. Engineered Regen. 2024;5(2):153–169. doi:10.1016/j.engreg.2024.02.002
6. Fisher MC, Rai SK, Lu N, Zhang Y, H.K C. The unclosing premature mortality gap in gout: a general population-based study. Ann Rheum Dis. 2017;76(7):1289–1294. doi:10.1136/annrheumdis-2016-210588
7. Rai SK, Burns LC, De Vera MA, Haji A, Giustini D, H.K C. The economic burden of gout: a systematic review. Arthritis Rheum. 2015;45:75–80. doi:10.1016/j.semarthrit.2015.02.004
8. Burke BT, Köttgen A, Law A, et al. Physical Function, Hyperuricemia, and Gout in Older Adults. Arthritis Care Res. 2015;67(12):1730–1738. doi:10.1002/acr.22648
9. Dalbeth N, Gosling AL, Gaffo A, Abhishek A. Gout. Lancet. 2021;397(10287):1843–1855. doi:10.1016/S0140-6736(21)00569-9
10. Stamp LK, Dalbeth N. Prevention and treatment of gout. Nature Reviews Rheumatology. 2019;15(2):68–70. doi:10.1038/s41584-018-0149-7
11. Keller SF, Mandell BF. Management and Cure of Gouty Arthritis. Med Clin North Am. 2021;105(2):297–310. doi:10.1016/j.rdc.2022.03.001
12. Dakkak M, Lanney H. Management of Gout: update from the American College of Rheumatology. Am Fam Physician. 2021;104(2):209–210.
13. Danve A, Sehra ST, Neogi T. Role of diet in hyperuricemia and gout. Best Pract Res Clin Rheumatol. 2021;35(4):101723. doi:10.1016/j.berh.2021.101723
14. Peng X, X L, Xie B, et al. Gout therapeutics and drug delivery. J Control Release. 2023;362:728–754. doi:10.1016/j.jconrel.2023.09.011
15. Schroder K, Tschopp J. The Inflammasomes. Cell. 2010;140(6):821–832. doi:10.1016/j.cell.2010.01.040
16. Terkeltaub R. Emerging Urate-Lowering Drugs and Pharmacologic Treatment Strategies for Gout: a Narrative Review. Drugs. 2023;83(16):1501–1521. doi:10.1007/s40265-023-01944-y
17. Farhat Z, Hershberger PA, Freudenheim JL, et al. Types of garlic and their anticancer and antioxidant activity: a review of the epidemiologic and experimental evidence. Eur J Nutr. 2021;60(7):3585–3609. doi:10.1007/s00394-021-02482-7
18. Hong Y, Nan B, Wu X, Yan H, Yuan Y. Allicin alleviates acrylamide-induced oxidative stress in BRL-3A cells. Life Sci. 2019;231:116550. doi:10.1016/j.lfs.2019.116550
19. Chen Y, Wang Y, Yang M, Guo MY. Allicin Inhibited Staphylococcus aureus -Induced Mastitis by Reducing Lipid Raft Stability via LxRα in Mice. J Agric Food Chem. 2019;67(39):10863–10870. doi:10.1021/acs.jafc.9b04378
20. Zhang L, Ma X, Shi R, et al. Allicin ameliorates imiquimodinduced psoriasis-like skin inflammation via disturbing the interaction of keratinocytes with IL-17A. Br J Pharmacol. 2023;180(5):628–646. doi:10.1111/bph.15983
21. Arellano Buendia AS, Tostado Gonzalez M, Sanchez Reyes O, et al. Immunomodulatory Effects of the Nutraceutical Garlic Derivative Allicin in the Progression of Diabetic Nephropathy. Int J Mol Sci. 2018;19(10):3107. doi:10.3390/ijms19103107
22. Li CL, Liu XH, Qiao Y, et al. Allicin alleviates inflammation of diabetic macroangiopathy via the Nrf2 and NF-kB pathway. Eur J Pharmacol. 2020;876:173052. doi:10.1016/j.ejphar.2020.173052
23. Cui T, Liu W, Yu C, et al. Protective Effects of Allicin on Acute Myocardial Infarction in Rats via Hydrogen Sulfide-mediated Regulation of Coronary Arterial Vasomotor Function and Myocardial Calcium Transport. Front Pharmacol. 2022;12:752244. doi:10.3389/fphar.2021.752244
24. Xu W, Li XP, Li EZ, et al. Protective Effects of Allicin on ISO-Induced Rat Model of Myocardial Infarction via JNK Signaling Pathway. Pharmacology. 2020;105(9−10):505–513. doi:10.1159/000503755
25. Li T, Ren L, Wang D, Song M, Li Q, Li J. Effect of allicin and its mechanism of action in purine removal in turbot. J Food Sci. 2020;85(10):3562–3569. doi:10.1111/1750-3841.15394
26. Nan B, Yang C, Li L, et al. Allicin alleviated acrylamide-induced NLRP3 inflammasome activation via oxidative stress and endoplasmic reticulum stress in Kupffer cells and SD rats liver. Food Chem Toxicol. 2021;148:111937. doi:10.1016/j.fct.2020.111937
27. Ye Y, Chao H, Bao Z. Allicin alleviates traumatic brain injury-induced neuroinflammation by enhancing PKC-δ-mediated mitophagy. Phytomedicine. 2025;139:156500. doi:10.1016/j.phymed.2025.156500
28. Shao T, Shao L, Li H, Xie Z, He Z, Wen C. Combined Signature of the Fecal Microbiome and Metabolome in Patients with Gout. Front Microbiol. 2017;8:268. doi:10.3389/fmicb.2017.00268
29. Shin W, Kim HJ. Intestinal barrier dysfunction orchestrates the onset of inflammatory host-microbiome cross-talk in a human gut inflammation-on-a-chip. Proc Natl Acad Sci U S A. 2018;115(45):E10539–E10547. doi:10.1073/pnas.1810819115
30. Chu Y, Sun S, Huang Y, et al. Metagenomic analysis revealed the potential role of gut microbiome in gout. NPJ Biofilms Microbiomes. 2021;7(1):66. doi:10.1038/s41522-021-00235-2
31. Yin H, Liu N, Chen J. The Role of the Intestine in the Development of Hyperuricemia. Front Immunol. 2022;13:845684. doi:10.3389/fimmu.2022.845684
32. Wang Z, Li Y, Liao W, Huang J, Tang J. Gut microbiota remodeling: a promising therapeutic strategy to confront hyperuricemia and gout. Front Cell Infect Microbiol. 2022;12:935723. doi:10.3389/fcimb.2022.935723
33. Bian M, Zhu C, Nie A, Zhou Z. Guizhi Shaoyao Zhimu Decoction ameliorates gouty arthritis in rats via altering gut microbiota and improving metabolic profile. Phytomedicine. 2024;131:155800. doi:10.1016/j.phymed.2024.155800
34. Wang Y, Lin Z, Zhang B, Nie A, Bian M. Cichorium intybus L. promotes intestinal uric acid excretion by modulating ABCG2 in experimental hyperuricemia. Nutrition & Metabolism. 2017;14(1). doi:10.1186/s12986-017-0190-6
35. Kuo YW, Hsieh SH, Chen JF, et al. Lactobacillus reuteri TSR332 and Lactobacillus fermentum TSF331 stabilize serum uric acid levels and prevent hyperuricemia in rats. PeerJ. 2021;9:e11209. doi:10.7717/peerj.11209
36. Surana NK, Kasper DL. Moving beyond microbiome-wide associations to causal microbe identification. Nature. 2017;552(7684):244–247. doi:10.1038/nature25019
37. Chen Z, Cai Z. Zhuang P,et al.Living probiotic biomaterials for osteoporosis therapy. Biomedical Technology. 2023. doi:10.1016/j.bmt.2022.11.007
38. Straughan DW. The UK Animals (Scientific Procedures) Act-Implications for the future of alternative toxicity tests. Toxicol In Vitro. 1994;8(4):841–843. doi:10.1016/0887-2333(94)90082-
39. Coderre TJ, Wall PD. Ankle joint urate arthritis in rats provides a useful tool for the evaluation of analgesic and anti-arthritic agents. Pharmacol Biochem Behav. 1988;29(3):461–466. doi:10.1016/0091-3057(88)90004-4
40. Rull M, Clayburne G, Sieck M. Intra-articular corticosteroid preparations: different characteristics and their effect during inflammation induced by monosodium urate crystals in the rat subcutaneous air pouch. Rheumatology. 2003;9:1093–1100. doi:10.1093/rheumatology/keg305
41. Yao TK, Lee RP, Wu WT, Chen IH, Yu TC, Yeh KT. Advances in Gouty Arthritis Management: integration of Established Therapies, Emerging Treatments, and Lifestyle Interventions. Int J Mol Sci. 2024;25(19):10853. doi:10.3390/ijms251910853
42. Liu P, Xu Y, Ye J, et al. Qingre Huazhuo Jiangsuan Decoction promotes autophagy by inhibiting PI3K/AKT/mTOR signaling pathway to relieve acute gouty arthritis. J Ethnopharmacol. 2023;302(Pt A):115875. doi:10.1016/j.jep.2022.115875
43. Li N, Chen S, Deng W, et al. Kaempferol Attenuates Gouty Arthritis by Regulating the Balance of Th17/Treg Cells and Secretion of IL-17. Inflammation. 2023;46(5):1901–1916. doi:10.1007/s10753-023-01849-8
44. Hao K, Jiang W, Zhou M, et al. Targeting BRD4 prevents acute gouty arthritis by regulating pyroptosis. Int J Biol Sci. 2020;16(16):3163–3173. doi:10.7150/ijbs.46153. Erratum in: Int J Biol Sci. 2025 Jan 1;21(2):473-474. doi: 10.7150/ijbs.107312.
45. Cheng JJ, Ma XD, Ai GX, et al. Palmatine Protects Against MSU-Induced Gouty Arthritis via Regulating the NF-κB/NLRP3 and Nrf2 Pathways. Drug Des Devel Ther. 2022;16:2119–2132. doi:10.2147/DDDT.S356307
46. Xu H, Zhang B, Chen Y, et al. Type II collagen facilitates gouty arthritis by regulating MSU crystallisation and inflammatory cell recruitment. Ann Rheum Dis. 2023;82(3):416–427. doi:10.1136/ard-2022-222764
47. Zhao X, Li M, Lu Y, et al. Sirt1 inhibits macrophage polarization and inflammation in gouty arthritis by inhibiting the MAPK/NF-κB/AP-1 pathway and activating the Nrf2/HO-1 pathway. Inflamm Res. 2024;73(7):1173–1184. doi:10.1007/s00011-024-01890-9
48. Wu H, Wang Y, Ren Z, et al. Overnutrition-induced gout: an immune response to NLRP3 inflammasome dysregulation by XOD activity increased in quail. Front Immunol. 2022;13:1074867. doi:10.3389/fimmu.2022.1074867
49. Wu H, Wang Y, Huang J, Li Y, Lin Z, Zhang B. Rutin ameliorates gout via reducing XOD activity, inhibiting ROS production and NLRP3 inflammasome activation in quail. Biomed Pharmacother. 2023;158:114175. doi:10.1016/j.biopha.2022.114175
50. Lu Y, Zhang M, Huang D. Dietary Organosulfur-Containing Compounds and Their Health-Promotion Mechanisms. Annu Rev Food Sci Technol. 2022;13(1):287–313. doi:10.1146/annurev-food-052720-010127
51. Gambari L, Grigolo B, Grassi F. Dietary organosulfur compounds: emerging players in the regulation of bone homeostasis by plant-derived molecules. Front Endocrinol. 2022;13:937956. doi:10.3389/fendo.2022.937956
52. Guillamón E, Andreo-Martínez P, Mut-Salud N, Fonollá J, Baños A. Beneficial Effects of Organosulfur Compounds from Allium cepa on Gut Health: a Systematic Review. Foods. 2021;10(8):1680. doi:10.3390/foods10081680
53. Martin-Gallausiaux C, Marinelli L, Blottière HM, Larraufie P, Lapaque N. SCFA: mechanisms and functional importance in the gut. Proc Nutr Soc. 2021;80(1):37–49. doi:10.1017/S0029665120006916
54. Tillett BJ, Dwiyanto J, Secombe KR, et al. SCFA biotherapy delays diabetes in humanized gnotobiotic mice by remodeling mucosal homeostasis and metabolome. Nat Commun. 2025;16(1):2893. doi:10.1038/s41467-025-58319-y
55. Tian D, Xu W, Pan W, et al. Fecal microbiota transplantation enhances cell therapy in a rat model of hypoganglionosis by SCFA-induced MEK1/2 signaling pathway. EMBO J. 2023;42(1):e111139. doi:10.15252/embj.2022111139
56. Xiao W, Su J, Gao X, et al. The microbiota-gut-brain axis participates in chronic cerebral hypoperfusion by disrupting the metabolism of short-chain fatty acids. Microbiome. 2022;10(1):62. doi:10.1186/s40168-022-01255-6
 © 2025 The Author(s). This work is published and licensed by Dove Medical Press Limited. The
full terms of this license are available at https://www.dovepress.com/terms
and incorporate the Creative Commons Attribution
- Non Commercial (unported, 4.0) License.
By accessing the work you hereby accept the Terms. Non-commercial uses of the work are permitted
without any further permission from Dove Medical Press Limited, provided the work is properly
attributed. For permission for commercial use of this work, please see paragraphs 4.2 and 5 of our Terms.
© 2025 The Author(s). This work is published and licensed by Dove Medical Press Limited. The
full terms of this license are available at https://www.dovepress.com/terms
and incorporate the Creative Commons Attribution
- Non Commercial (unported, 4.0) License.
By accessing the work you hereby accept the Terms. Non-commercial uses of the work are permitted
without any further permission from Dove Medical Press Limited, provided the work is properly
attributed. For permission for commercial use of this work, please see paragraphs 4.2 and 5 of our Terms.