Back to Journals » Neuropsychiatric Disease and Treatment » Volume 17
Algorithms to Predict Anxiety and Depression Among University Students in China After Analyzing Lifestyles and Sport Habits
Authors Zhang L, Zhao S, Lin Q, Song M ![]() , Wu S, Zheng H
, Wu S, Zheng H
Received 9 April 2021
Accepted for publication 5 June 2021
Published 21 June 2021 Volume 2021:17 Pages 2011—2025
DOI https://doi.org/10.2147/NDT.S315148
Checked for plagiarism Yes
Review by Single anonymous peer review
Peer reviewer comments 2
Editor who approved publication: Dr Jun Chen
Lirong Zhang,1 Shaocong Zhao,1 Qiong Lin,2 Minmin Song,3 Shouren Wu,2 Hua Zheng4
1Department of Physical Education, Xiamen University of Technology, Xiamen, Fujian, People’s Republic of China; 2Department of Physical Education, JiMei University, Xiamen, Fujian, People’s Republic of China; 3Department of Physical Education, Fujian Agriculture and Forestry University, Fuzhou, Fujian, People’s Republic of China; 4College of Physical Education and Health Sciences, Chongqing Normal University, Chongqing, People’s Republic of China
Correspondence: Shaocong Zhao
Department of Physical Education, Xiamen University of Technology, Xiamen, Fujian, People’s Republic of China
Tel +86-13806063882
Email [email protected]
Purpose: This study aims to identify potential risk factors associated with anxiety or depression and propose algorithms to predict anxiety and depression especially among university students.
Methods: We included and analyzed 881 university students from eight colleges in China in November 2020. Student’s basic information, lifestyles, sport habits, comorbidities, and mental health conditions were collected. Anxiety and depression were measured using the generalized anxiety disorder 7 (GAD-7) and the patient health questionnaire 9 (PHQ-9), respectively. A multiple linear regression analysis was used to assess the ability of 25 potential risk factors for predicting anxiety and depression, and significant risk factors were included in the algorithms.
Results: Of all the included students, 44.27% lived with mild or above anxious symptoms and 50.62% had mild or above depressive symptoms. According to the multiple linear regression model, grade levels (P< 0.01), member of college sports dance team (P=0.05), sedentary time (P=0.02), exercise frequency (P< 0.01), only child status (P=0.05), addiction of drinking (P< 0.01), and prefer eating vegetable (P< 0.01) were significantly associated with anxiety; grade levels (P< 0.01), member of college sports dance team (P< 0.01), sedentary time (P< 0.01), exercise frequency (P< 0.01), academic study period during free time (P=0.03), only child status (P< 0.01), addiction of drinking (P< 0.01), prefer eating vegetables (P< 0.01), and main types of drinking water (P< 0.01) were significantly associated with depression. Based on these significant factors, two algorithms were successfully developed, and two risk groups were created according to the algorithms.
Conclusion: The study proposed two algorithms to calculate anxiety and depression, respectively, which can be useful tools to identify students with different risk of anxiety or depression. Effective measures are warranted to improve student’s sport habits and healthy lifestyles in order to mitigate anxiety and depression, especially among students in the high risk group.
Keywords: students, public health, anxiety, depression, risk factors, algorithms
Introduction
Mental disorder poses a significant challenge which has become one of crucial public health problems among university students. According to epidemiological studies, 25.2–44.0% of college students suffered from anxiety symptoms,1,2 and 15.6–42.0% of college students had depression symptoms.1,3 University students were in an essential stage of transiting from adolescence to adulthood. At this stage, they were vulnerable to anxiety and depression possibly because of environmental changes, academic pressures, or obstacles to their life goals.4 Notably, anxiety and depression are of great harm, which are detrimental to their lives and academic performances and may become the major reasons for school dropout and even suicide.5 According the recent study, approximately 24% of college students were identified as having suicide risk.6 Therefore, it is extremely warranted to develop strategies so as to early identify anxiety and depression.
The identification of anxiety or depression can be realized with the help of risk factors. Studies have shown that gender, body image, years of study, and academic performances were associated with anxiety,7,8 while gender, exercise frequency,3 concern over mistakes,3 poor diet,9 sleep problems,9,10 alcohol abuse,11 and daytime sleepiness3 were significantly associated with depression. Furthermore, some prediction models have been proposed to predict anxiety and depression.12–14 However, those models were created based on varying populations, including patients with diabetes after limb amputation,12 chronic obstructive pulmonary diseases,13 and depression among undergraduate student under Coronavirus Disease 2019 (COVID-19).14 Technically, these prediction models may not be capable of being used to predict anxiety and depression especially among college students. Thus, it is of great necessity for us to develop prediction models among particular university students.
Therefore, in this study, we aim to propose algorithms to predict anxiety and depression among university students so as to identify those who are at a high risk of mental health disorders.
Materials and Methods
Samples
We included and analyzed 881 university students from eight colleges in China in November 2020. The eight universities included Xiamen University of Technology, Chengdu Sport University, Xiamen University, JiMei University, Fujian Agriculture and Forestry University, Southwest Jiaotong University, Shandong Sport University, and Chongqing Normal University. We performed a survey online and students voluntarily responded and filled in the survey based on their real conditions. Student’s basic information, lifestyles, sport habits, comorbidities, and mental health conditions were collected in the survey. A database was constructed based on the survey. Students were excluded in the analysis if he or she was reluctant to take part in the survey, had an age of less than 18 years old, or previously diagnosed with anxiety or depression in the hospital. This study was approved by the Academic Committee and Ethics Board of the Xiamen University of Technology (No. 2020.01). Formal consents were obtained from all participants and their personal information was all anonymized. This study was conducted in line with the Declaration of Helsinki.
Evaluation of Anxiety and Depression
Anxiety and depression were measured using generalized anxiety disorder 7 (GAD-7)15,16 and patient health questionnaire 9 (PHQ-9),17 respectively. The GAD-7 ranged from 0 to 21. A score of 5 to 9 was considered as mild anxiety, 10 to 14 was moderate anxiety, and 15 or above was severe anxiety. PHQ-9, ranging from 0 to 27, had the same classification to the GAD-7: participants who had a score of 4 or less was regarded as no depression, 5 to 9 was mild depression, 10 to 14 was moderate depression, and 15 or above was severe depression. GAD-7 and PHQ-9 were widely used measurement to assess anxiety and depression among university students. The reliabilities and validities of GAD-7 and PHQ-9 were good with the corresponding Cronbach alpha of 0.915 and 0.892, respectively.
Potential Risk Factors
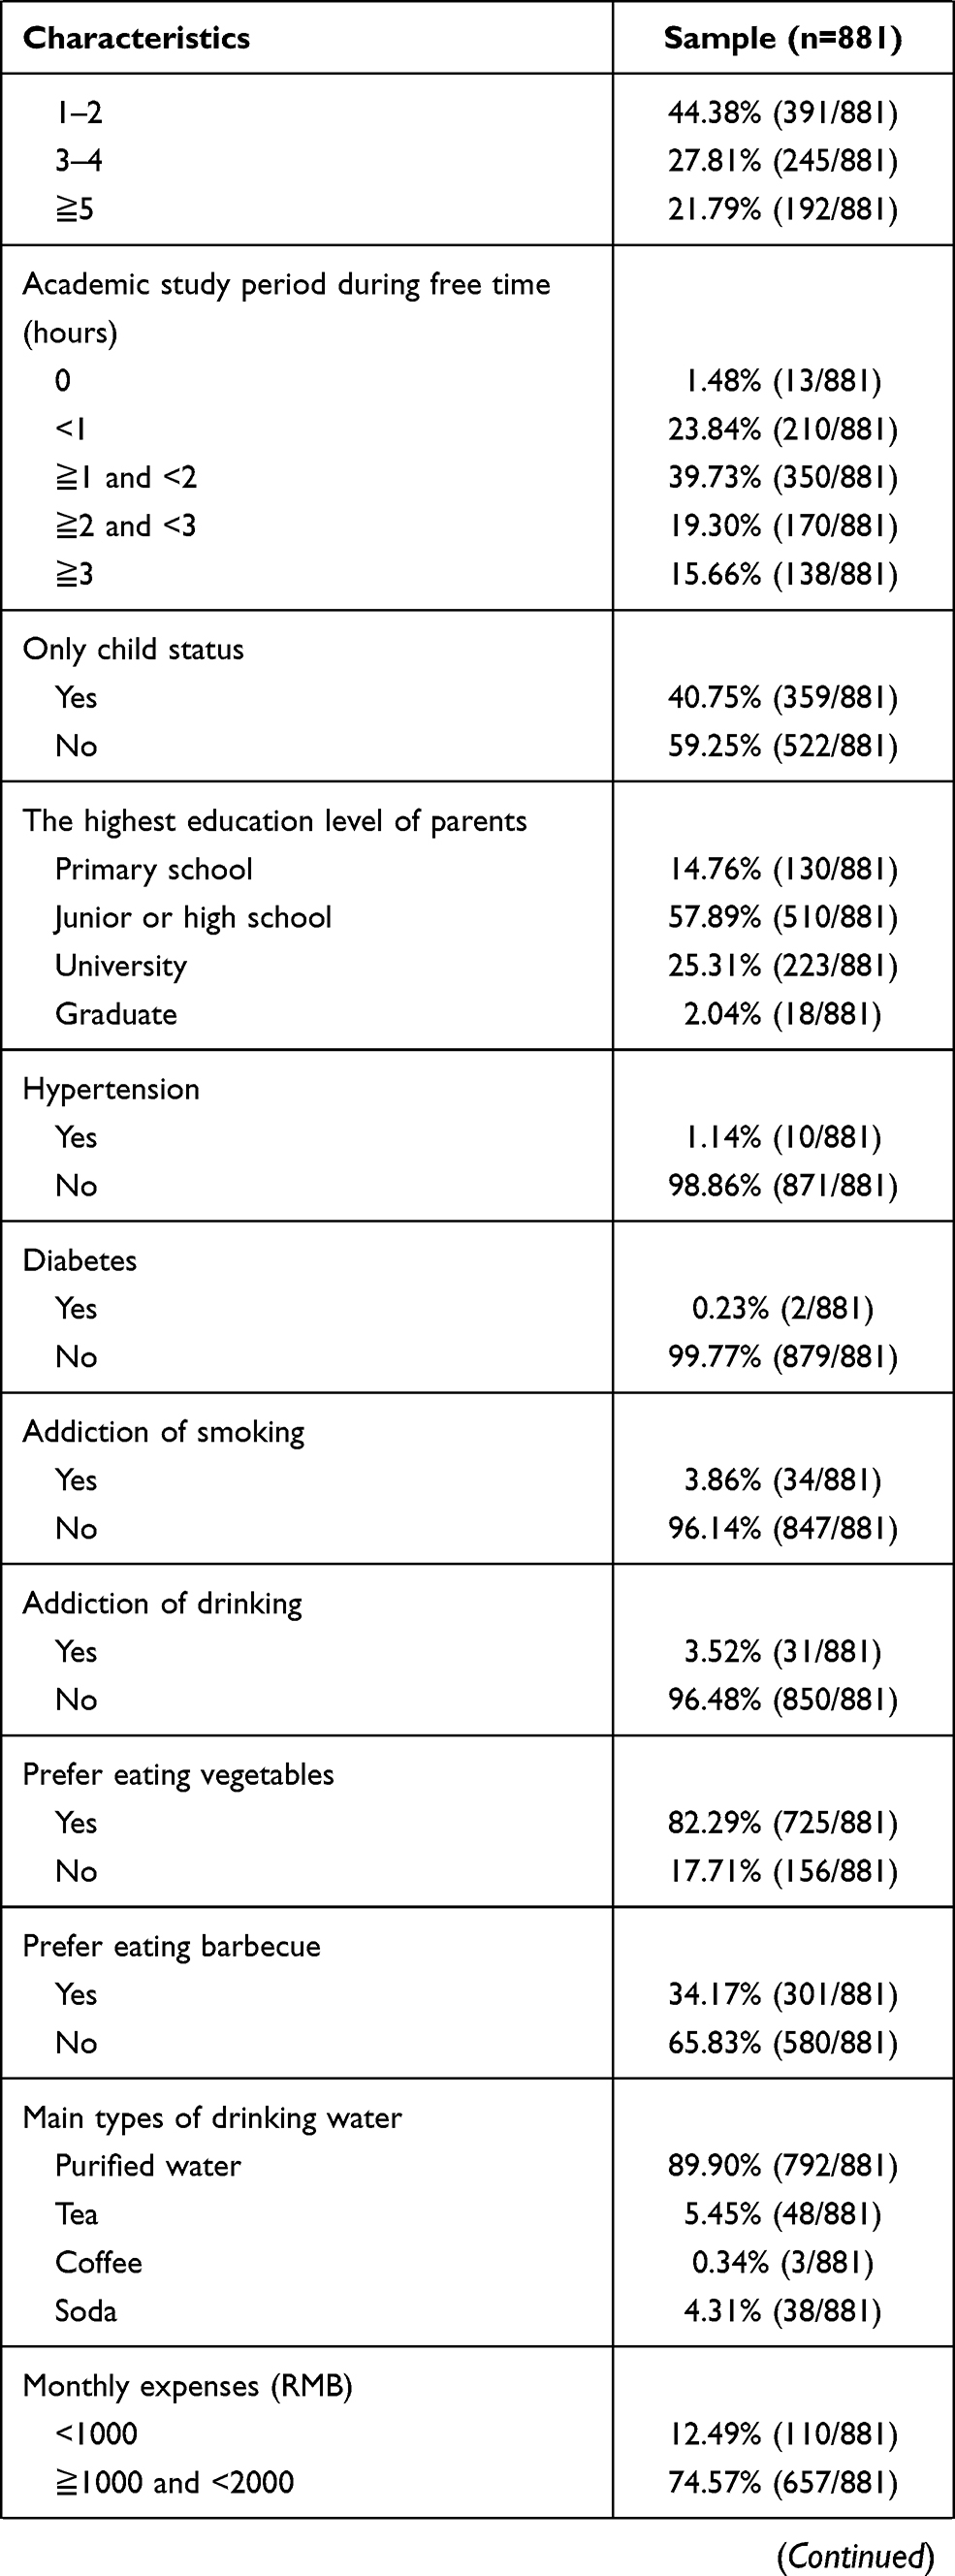
In terms of previous studies and data availabilities, we identified 25 potential risk factors which were used to assess their ability to predict anxiety or depression scores according to the multiple linear regression model. These risk factors included sex (female vs male), age (˂20 years vs ≥20 years), grade levels (first year vs second year vs third year vs fourth year vs delayed graduation), professional dancer (yes vs no), member of college sports dance team (yes vs no), physical education student (yes vs no), number of dance types (0 vs 1–2 vs ≥3), body mass index (BMI, kg/m2) (<18.5 vs ≥18.5 and <24 vs ≥24 and <28 vs ≥28), scholarship winner (yes vs no), time interval of 3 kilometers running (min) (<15 vs ≥15 and <20 vs ≥20 and <25 vs ≥25), sedentary time per day (hour) (<1 vs ≥1 and <3 vs ≥3 and <6 vs ≥6), exercise frequency per week (0 vs 1–2 vs 3–4 vs ≧5), academic study period during free time (hours/per day) (0 vs <1 vs ≧1 and <2 vs ≧2 and <3 vs ≧3), only child status (yes vs no), the highest education level of parents (primary school vs junior or high school vs university vs graduate), hypertension (yes vs no), diabetes (yes vs no), addiction of smoking (yes vs no), addiction of drinking (yes vs no), prefer eating vegetables (yes vs no), prefer eating barbecue (yes vs no), main types of drinking water (purified water vs tea vs coffee vs soda), monthly expenses (Renminbi, RMB) (<1000 vs ≧1000 and <2000 vs ≧2000 and <4000 vs ≧4000), marital status (single vs dating vs married vs fertilized), and anxiety or depression history of immediate family members (yes vs no). The member of college sports dance team was those who participated in college sport dance team and attended dance courses four times a week (90 min per course). The number of dance types was defined how many types of dance that student knew to dance, including Waltz, Tango, Foxtrot, Quickstep, Latin, and others. Exercise frequency per week was the number of exercise that students did every week and the time of each exercise should have a minimum of 30 min. Academic study period during free time meant that the time student spent to study by themselves during free time and it should not include formal class time. Only child status was defined that students had no sibling. All above-mentioned potential risk factors were reported by students according to their actual conditions.
Development of Algorithms to Predict Anxiety and Depression
The multiple linear regression model was used to analyze the ability of the 25 potential risk factors for predicting anxiety and depression and statistical significant risk factors were included in the algorithm to calculate anxiety and depression scores, respectively. The estimates of significant variables calculated and used to develop the algorithm when all significant risk factors re-entered the multiple linear regression model. The algorithm was shown as follows:  . In the algorithm, Y denoted anxiety or depression scores,
  indicated significant risk factors, and a, b, and c indicated corresponding estimates of each significant risk factor. The algorithms to predict anxiety and depression were developed respectively. Examples about how to use the algorithms to calculate anxiety and depression scores were shown in the results section. Development of risk groups among students according to the anxiety and depression algorithms was also achieved. Namely, there were low-risk group and high-risk group for anxiety or depression.
Evaluation of Algorithms to Predict Anxiety and Depression
Effectiveness of the two algorithms was evaluated by calibration slope and R square. The calibration ability meant the consistency between the predicted anxiety or depression scores and the actual observed anxiety or depression scores. Calibration slope was measure by plotting deciles of the mean predicted anxiety or depression scores against the observed mean anxiety or depression scores in each decile. A smooth line was fitted using linear regression analysis and calibration slope was obtained from the smooth line. If the calibration slope is close to 1 and the intercept was near to 0, the algorithm is effective. Regarding R square, the closer the value was to 1, the better the algorithms.
Statistical Analysis
All statistical analyses were performed using SAS 9.2 software. The differences among the continuous variables were analyzed using the t or rank test between groups. The multiple linear regression model was used to analyze potential risk factors for anxiety and depression. The difference of the observed scores between the low-risk group and the high-risk group was evaluated using the Wilcoxon rank test. A P-value of 0.05 or less was regarded as statistical significance (two-sided tests).
Results
Demographics
In the entire university students, 901 students completed the survey and 20 students were reluctant to participate in. Besides, 20 students were excluded due to previous diagnosis of anxiety or depression in the hospital. Therefore, the response rate was 97.83% (901/921) and finally 881 patients were included in the study. Of all the included students, 56.64% (499/881) were female. The majority of students had an age of less than 20 years old (63.00%, 555/881). Professional dancer, member of college sport dance team, and physical education student accounted for 5.68% (50/881), 11.69% (103/881), and 26.22% (231/881), respectively. Information about their family backgrounds, comorbidities, lifestyles, and sport habits are presented in Table 1. Regarding mental status, 44.27% lived with mild or above anxious symptoms and 50.62% had mild or above depressive symptoms. In detail, 9.54% (84/881) students suffered from moderate-to-severe anxiety; 14.19% (125/881) students had moderate-to-severe depression. The above-mentioned numbers indicated that anxiety and depression were common among university students.
 |
 |
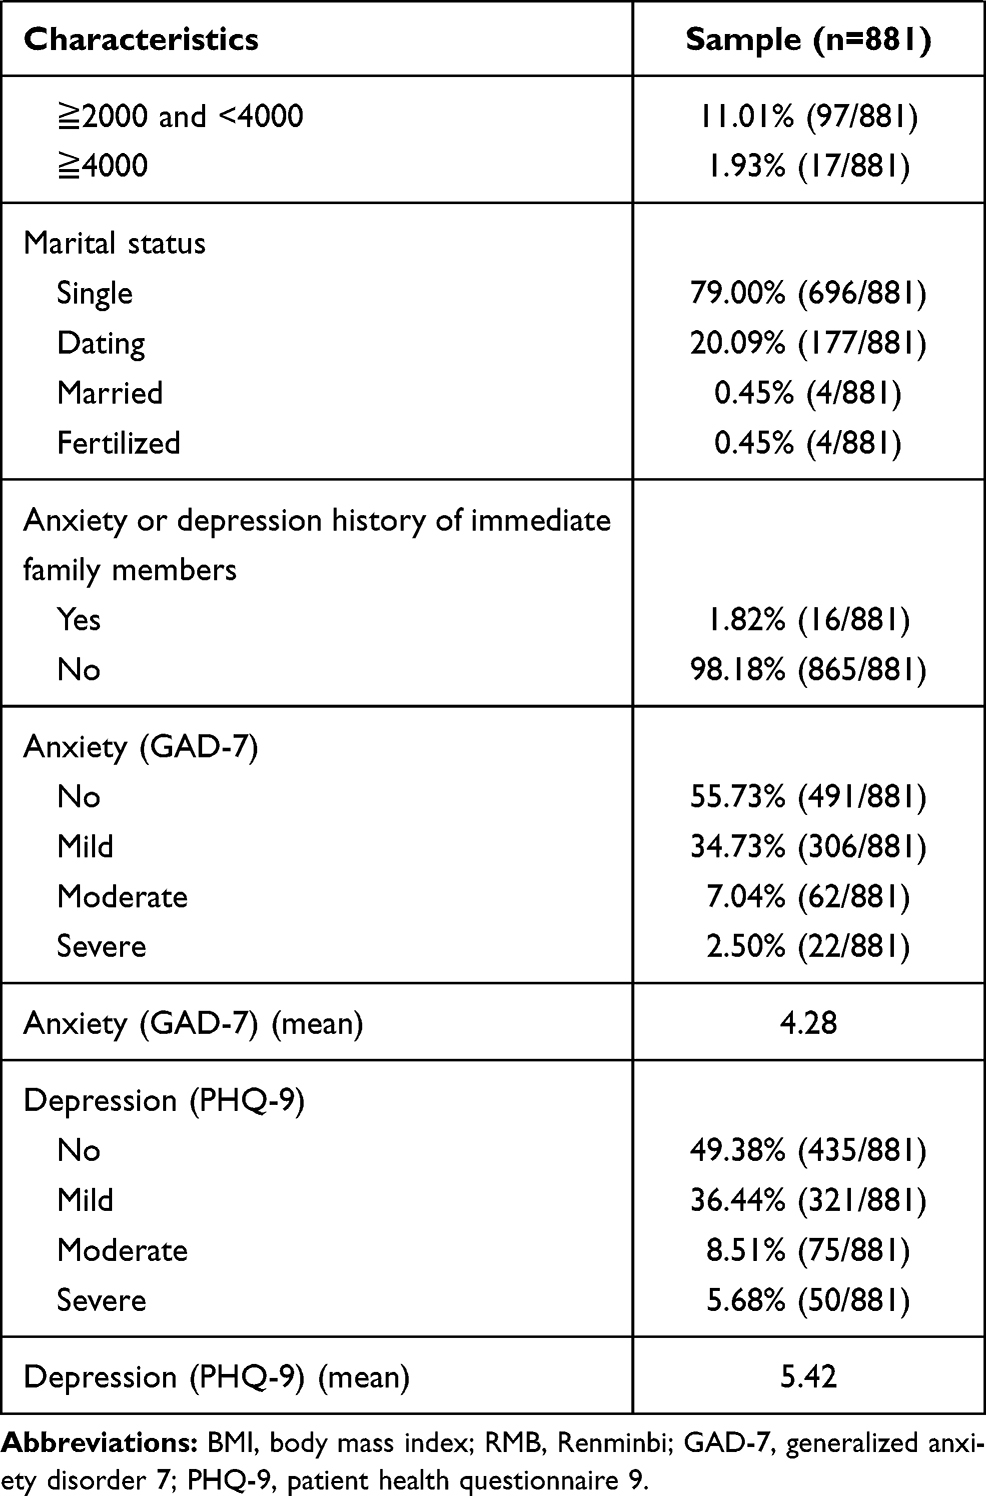 |
Table 1 Student’s Demographics |
Risk Factors for Anxiety
According to subgroup analysis, female students had significantly higher anxiety score as compared with male patients (4.51 vs 3.98, P<0.01) and higher age also showed significantly higher anxiety score (4.94 vs 3.89, P<0.01) (Table 2). Similar trends were observed in higher grade levels (P<0.01), non-physical education students (P<0.01), more sedentary time (P=0.04), less exercise frequency per week (P<0.01), less self-study time (P<0.01), having sibling (P=0.05), addiction of drinking (P<0.01), and prefer eating vegetables (P=0.01).
 |
 |
 |
Table 2 The Multiple Linear Regression Analysis of Characteristics for Anxiety |
According to the multiple linear regression model, grade levels (Estimate=0.84, 95% Confident interval (CI): 0.48–1.20, P<0.01), member of college sports dance team (Estimate=−0.88, 95% CI: −1.77–0.01, P=0.05), sedentary time (Estimate=0.37, 95% CI: 0.07–0.67, P=0.02), exercise frequency (Estimate=−0.71, 95% CI: −1.03–-0.40, P<0.01), only child status (Estimate=−0.57, 95% CI: −1.13–-0.01, P=0.05), addiction of drinking (Estimate=2.41, 95% CI: 0.89–3.92, P<0.01), and prefer eating vegetable (Estimate=−1.06, 95% CI: −1.79–-0.33, P<0.01) were significantly associated with anxiety. The results meant that lower grade levels, member of college sports dance team, less sedentary time, more exercise frequency, only child status, and prefer eating vegetable were protective independent factors for anxiety, while addiction of drinking was an independent risk factor for anxiety.
The Algorithm to Calculate Anxiety Score
The above seven significant risk factors were included in the algorithm to predict anxiety (Table 2). According to the multiple linear regression model, the anxiety model was developed as follows: Y= 4.98+0.84*grade levels-0.88*member of college sports dance team+0.37*sedentary time per day-0.71*exercise frequency per week-0.57*only child status+2.41*addiction of drinking-1.06*prefer eating vegetables. For example, if a senior student (4) who was member of college sport dance team (1), had a sedentary time of more than 6 hours per day (4), made exercise twice a week (2), had a sister (0), addicted to drinking (1), and not preferred to eat vegetable (0), then the predicted anxiety score was 4.98+0.84*4-0.88*1+0.37*4-0.71*2-0.57*0+2.41*1-1.06*0=9.93.
Risk Factors for Depression
Subgroup analysis showed that female (P=0.01), higher age (P<0.01), higher grade levels (P<0.01), lacking exercise, and imbalanced diets were significantly related to higher depression scores (Table 3). In detail, students in the subgroup of non-member of college sports dance team (P=0.03), non-physical education student (P<0.01), longer time interval of 3 kilometers running (P=0.04), less exercise frequency (P<0.01), less self-study time (P<0.01), having sibling (P=0.02), addiction of drinking (P<0.01), not prefer eating vegetables (P<0.01), prefer eating barbecue (P<0.01), and main source of drinking water (soda) (P<0.01) were more likely to possess higher depression scores.
 |
 |
 |
Table 3 The Multiple Regression Analysis of Characteristics for Depression |
According to the multiple linear regression model, grade levels (Estimate=1.00, 95% CI: 0.57–1.43, P<0.01), member of college sports dance team (Estimate=−1.53, 95% CI: −2.58–-0.47, P<0.01), sedentary time (Estimate=0.51, 95% CI: 0.15–0.87, P<0.01), exercise frequency (Estimate=−0.86, 95% CI: −1.23–-0.48, P<0.01), academic study period during free time (Estimate=−0.37, 95% CI: −0.70–-0.04, P=0.03), only child status (Estimate=−0.89, 95% CI: −1.56–-0.23, P<0.01), addiction of drinking (Estimate=3.19, 95% CI: 1.36–5.02, P<0.01), prefer eating vegetables (Estimate=−1.16, 95% CI: −2.04–-0.29, P<0.01), and main types of drinking water (Estimate=0.73, 95% CI: 0.21–1.24, P<0.01) were significantly associated with depression. The results meant that lower grade levels, member of college sports dance team, less sedentary time, more exercise frequency, appropriate self-study time, only child status, and prefer eating vegetable were protective independent factors for depression, while main types of drinking water (soda) and addiction of drinking was independent risk factor for depression.
The Algorithm to Calculate Depression Score
The above nine significant risk factors were used to develop the algorithm to calculate depression score. The algorithm was created as follows (Table 3): Y=6.51+1.00*grade levels-1.53*member of college sports dance team+0.51*sedentary time per day-0.86*exercise frequency per week-0.37*academic study period during free time-0.89*only child status+3.19*addiction of drinking-1.16*prefer eating vegetables+0.73*main types of drinking water. An example was shown in the following: If a senior student (4) who was member of college sport dance team (1), had a sedentary time of more than 6 hours per day (4), made exercise twice a week (2), had a self-study time of 0 (1), had a sister (0), preferred to eat vegetable (1), had the habit of being addicted to drinking (1), and had soda as the main source of drinking water (4), then the predicted score was 

 .
.
Evaluation of the Two Algorithms
The calibration slopes of the anxiety and depression algorithms were 0.91 (95% CI: 0.71–1.12, P<0.001, Figure 1), and 0.98 (95% CI: 0.77–1.18, P<0.001, Figure 2), respectively (Table 4). The corresponding X–intercepts were −0.43 (95% CI: −1.84–0.48) and −0.15 (95% CI: −1.70–0.88) and Y-intercepts were 0.39 (95% CI: −0.53–1.31) and 0.15 (95% CI: −1.03–1.32) in the two algorithms. The R-squares of the anxiety and depression algorithm were 0.93 and 0.94, respectively.
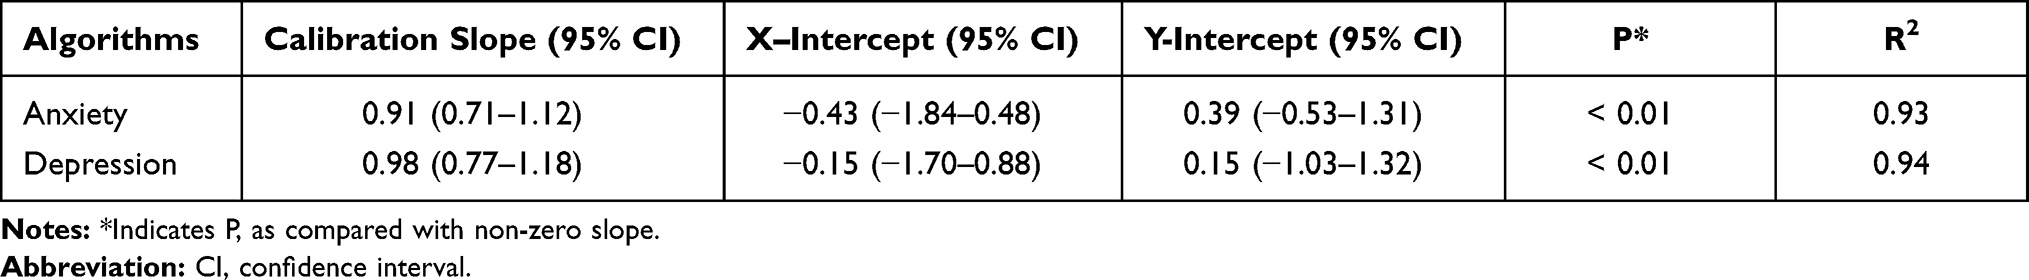 |
Table 4 Effectiveness Evaluation of the Two Algorithms |
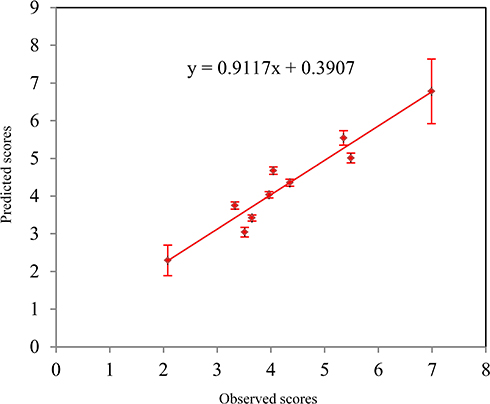 |
Figure 1 The calibration slope of the anxiety algorithm (Slope=0.91, 95% CI: 0.71–1.12, P<0.01). |
 |
Figure 2 The calibration slope of the depression algorithm (Slope=0.98, 95% CI: 0.77–1.18, P<0.01). |
Classification of Risk Groups
In the anxiety algorithm, students with a predicted anxiety score of less than 6 were classified as the low-risk group and a predicted score of 6 or more were regarded as the high-risk group (Table 5). The predicted anxiety scores and observed anxiety scores were similar in the both low- and high-risk groups. The difference of the observed scores between the low-risk group and the high-risk group was statistical significant (4.04±4.15 vs 6.68±5.39, P<0.01). In the depression algorithm, students who had a depression score of less than 8 were the risk group and a score of 8 or more were the high-risk group. A similar trend was also observed in terms of the depression algorithm.
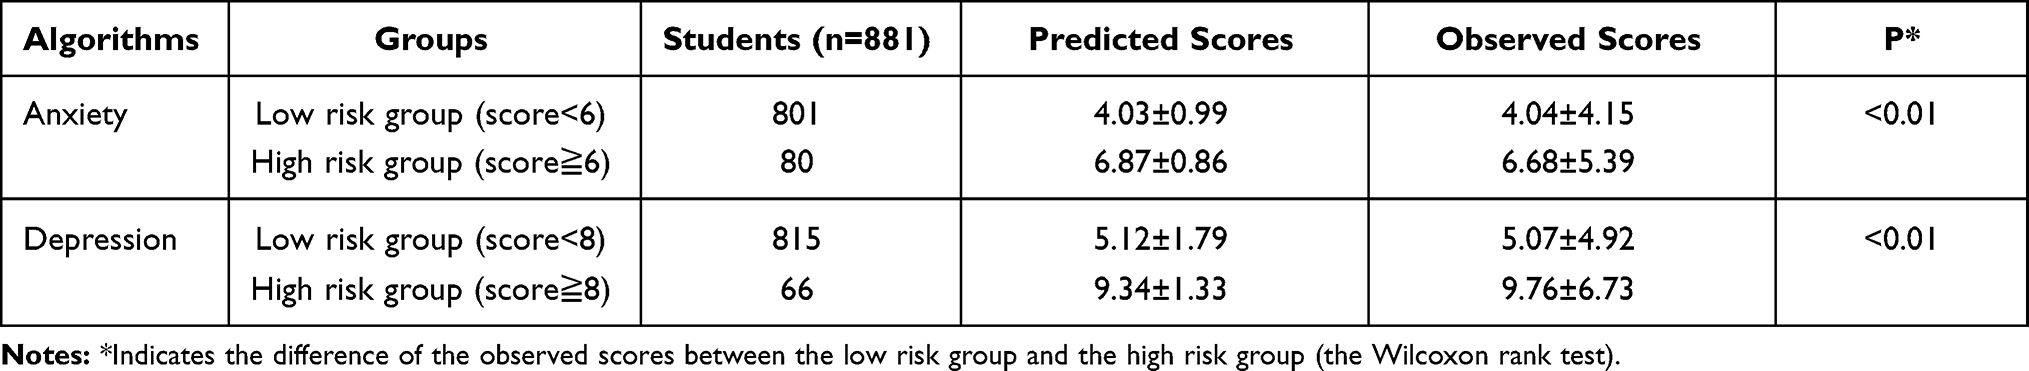 |
Table 5 Classification of Risk Groups in the Anxiety and Depression Algorithms |
Discussion
In the study, we found that 44.27% students lived with mild or above anxious symptoms and 50.62% of them suffered from depressive symptoms, which indicated that anxiety and depression were relatively common among university students. In detail, 9.54% of students had moderate-to-severe anxiety and 14.19% students had moderate-to-severe depression. Furthermore, we identified several factors significantly associated with anxiety or depression. The significant factors associated with anxiety included grade levels, member of college sports dance team, sedentary time, exercise frequency, only child status, addiction of drinking, and prefer eating vegetable More explicitly, the results indicated that lower grade levels, member of college sports dance team, less sedentary time, more exercise frequency, only child status, and prefer eating vegetable were protective independent factors for anxiety, while addiction of drinking was independent risk factor for anxiety. According to other studies, the incidence of anxiety ranged from 25.2% to 44.0%1,2 and depression varied from 15.6% to 42.0%.1,3 Different measurements and classifications could explain these differences. Other studies have also pointed out that gender,18 body image, years of study,7,8 academic performance,7,8 sedentary behavior,19 lack of exercises, and imbalanced diets20 were significantly with anxiety among college students. Our study also found that the students without siblings suffered from less anxiety this might be explained that the students in the only child status might obtain more attentions and cares from their parents and family members.
Regarding the factors significantly relating to depression, they composed of grade levels, member of college sports dance team, sedentary time, exercise frequency, academic study period during free time, only child status, addiction of drinking, prefer eating vegetables, and main types of drinking water. The results denoted that lower grade levels, member of college sports dance team, less sedentary time, more exercise frequency, appropriate self-study time, only child status, and prefer eating vegetable were protective independent factors for depression, while main types of drinking water (soda) and addiction of drinking was independent risk factor for depression. In other studies, gender, exercise frequency,3 concern over mistakes,3 poor diet,9 sleep problems,9,10 alcohol abuse,11 sedentary behavior,19 pain duration,21 and daytime sleepiness3 were identified as significant risk factors for depression.
According to the significant risk factors identified in the study, we further developed the two algorithms to predict anxiety and depression, respectively. Besides, the calibration slopes and R-square confirmed that the two algorithms were effective tools to calculate anxiety and depression scores. Other studies have already proposed models to predict anxiety and depression. Rodríguez-Hidalgo et al14 developed a predictive model for depression among undergraduate students in the COVID-19 pandemic in a series of 640 students. Pedras et al12 proposed a prediction model of anxiety and depression using 179 patients with diabetes and amputation. Ebert et al22 developed a risk model to predict major depressive disorder in a sample of 2519 freshmen students. The above-mentioned models were designed for special populations under particular conditions. In the present study, we created two algorithms to predict anxiety and depression, respectively. Besides, the two algorithms were relatively easy to use and the effectiveness of the two algorithms were confirmed in the study. Furthermore, students were classified into the low- and high-risk groups in terms of anxiety or depression algorithms. Students in the high-risk group had significant higher anxiety and depression scores as compared with student in the low-risk group.
In order to mitigate anxiety and depression, effective measures were warranted to improve student’s sport habits and healthy lifestyles,20 especially among students in the high-risk groups, such as exercising more, taking part in sport dance courses, abstaining from drinking, and avoiding greasy restaurant meals and processed foods. Besides, it would be of great help for the educational official authorities and administration of universities to design and implement school-based prevention programs or structural and organizational to cushion harmful effects on the mental health of college students.18,23 Moreover, cognitive, behavioral and mindfulness interventions contributed to decreased symptoms of anxiety.24 A university without the protection and promotion of the young’s mental health would put its immediate and long-term future in jeopardy.
Limitations
This study had several limitations. Firstly, Chinese students were relatively reluctant to seek assistances to alleviate mental health problems and sometimes deny anxiety or depression because of social or cultural pressure. Thus, the accuracy of the data in the study should be further confirmed. But, with the impact of western cultural and the introduction of mental healthcare, such situation has largely improved. Chinese students increasingly had an inclination to expressive their affection and problems relating to mental health, which could facilitate the collection of accurate data and the rate of anxiety and depression. Secondly, the anxiety and depression conditions were not evaluated by interviewing but by self-report. However, the scales to measure anxiety and depression were well validated in previous studies which showed good concordance with clinical diagnoses. Thirdly, COVID-19 pandemic occurred at the end of 2019 and spread China in the beginning of 2020. Though studies have shown the pandemic might have negative impacts on individuals,25 the pandemic largely alleviated at the end of 2020 in China. At that time, university students were relatively normally attending schools under COVID-19 preventive strategies and guidelines and we conducted the study at that time.
Conclusions
The study proposed two algorithms to calculate anxiety and depression, respectively, which can be useful tools to identify students with different risk of anxiety and depression. Effective measures are warranted to improve student’s sport habits and healthy lifestyles in order to mitigate anxiety and depression, especially among students in the high-risk group.
Funding
This study was founded by Fujian Young Teacher Education Research Project (No. JAS170328).
Disclosure
The authors report no conflicts of interest in this work.
References
1. Eisenberg D, Gollust SE, Golberstein E, Hefner JL. Prevalence and correlates of depression, anxiety, and suicidality among university students. Am J Orthopsychiatry. 2007;77(4):534–542. doi:10.1037/0002-9432.77.4.534
2. Saravanan C, Wilks R. Medical students’ experience of and reaction to stress: the role of depression and anxiety. ScientificWorldJournal. 2014;2014:737382. doi:10.1155/2014/737382
3. Song Y, Liu Z, Chen H, Guo Q, Huang Y. Incidence and risk factors of depressive symptoms in Chinese college students. Neuropsychiatr Dis Treat. 2020;16:2449–2457. doi:10.2147/NDT.S264775
4. Bayram N, Bilgel N. The prevalence and socio-demographic correlations of depression, anxiety and stress among a group of university students. Soc Psychiatry Psychiatr Epidemiol. 2008;43(8):667–672. doi:10.1007/s00127-008-0345-x
5. Lew B, Huen J, Yu P, et al. Associations between depression, anxiety, stress, hopelessness, subjective well-being, coping styles and suicide in Chinese university students. PLoS One. 2019;14(7):e0217372. doi:10.1371/journal.pone.0217372
6. Becker SP, Dvorsky MR, Holdaway AS, Luebbe AM. Sleep problems and suicidal behaviors in college students. J Psychiatr Res. 2018;99:122–128. doi:10.1016/j.jpsychires.2018.01.009
7. Mahroon ZA, Borgan SM, Kamel C, Maddison W, Royston M, Donnellan C. Factors associated with depression and anxiety symptoms among medical students in Bahrain. Acad Psychiatry. 2018;42(1):31–40. doi:10.1007/s40596-017-0733-1
8. Gao W, Ping S, Liu X. Gender differences in depression, anxiety, and stress among college students: a longitudinal study from China. J Affect Disord. 2020;263:292–300. doi:10.1016/j.jad.2019.11.121
9. Doom JR, Haeffel GJ. Teasing apart the effects of cognition, stress, and depression on health. Am J Health Behav. 2013;37(5):610–619. doi:10.5993/AJHB.37.5.4
10. Wallace DD, Boynton MH, Lytle LA. Multilevel analysis exploring the links between stress, depression, and sleep problems among two-year college students. J Am Coll Health. 2017;65(3):187–196. doi:10.1080/07448481.2016.1269111
11. Rosenthal SR, Clark MA, Marshall BDL, et al. Alcohol consequences, not quantity, predict major depression onset among first-year female college students. Addict Behav. 2018;85:70–76. doi:10.1016/j.addbeh.2018.05.021
12. Pedras S, Carvalho R, Pereira MG. A predictive model of anxiety and depression symptoms after a lower limb amputation. Disabil Health J. 2018;11(1):79–85. doi:10.1016/j.dhjo.2017.03.013
13. Gonzalez-Gutierrez MV, Guerrero Velazquez J, Morales Garcia C, Casas Maldonado F, Gomez Jimenez FJ, Gonzalez Vargas F. Predictive model for anxiety and depression in Spanish patients with stable chronic obstructive pulmonary disease. Arch Bronconeumol. 2016;52(3):151–157. doi:10.1016/j.arbr.2016.01.009
14. Rodriguez-Hidalgo AJ, Pantaleon Y, Dios I, Falla D. Fear of COVID-19, stress, and anxiety in university undergraduate students: a predictive model for depression. Front Psychol. 2020;11:591797. doi:10.3389/fpsyg.2020.591797
15. Mossman SA, Luft MJ, Schroeder HK, et al. The generalized anxiety disorder 7-item scale in adolescents with generalized anxiety disorder: signal detection and validation. Ann Clin Psychiatry. 2017;29(4):227–234A.
16. Tiirikainen K, Haravuori H, Ranta K, Kaltiala-Heino R, Marttunen M. Psychometric properties of the 7-item Generalized Anxiety Disorder Scale (GAD-7) in a large representative sample of Finnish adolescents. Psychiatry Res. 2019;272:30–35. doi:10.1016/j.psychres.2018.12.004
17. Borghero F, Martinez V, Zitko P, Vohringer PA, Cavada G, Rojas G. Screening depressive episodes in adolescents. validation of the Patient Health Questionnaire-9 (PHQ-9). Rev Med Chil. 2018;146(4):479–486. doi:10.4067/s0034-98872018000400479
18. Santangelo OE, Provenzano S, Firenze A. Anxiety, depression and risk consumption of alcohol in a sample of university students. Riv Psichiatr. 2018;53(2):88–94. doi:10.1708/2891.29157
19. Lee E, Kim Y. Effect of university students’ sedentary behavior on stress, anxiety, and depression. Perspect Psychiatr Care. 2019;55(2):164–169. doi:10.1111/ppc.12296
20. Ramon-Arbues E, Martinez Abadia B, Granada Lopez JM, et al. Eating behavior and relationships with stress, anxiety, depression and insomnia in university students. Nutr Hosp. 2019;36(6):1339–1345. doi:10.20960/nh.02641
21. Lee SH, Ko MJ, Nam TK, Kwon JT, Park YS. Impact of adolescent complex regional pain syndrome on the psychopathology of young men ahead of military service: a retrospective cohort analysis of Korean conscription data. Mil Med Res. 2020;7(1):62. doi:10.1186/s40779-020-00294-0
22. Ebert DD, Buntrock C, Mortier P, et al. Prediction of major depressive disorder onset in college students. Depress Anxiety. 2019;36(4):294–304. doi:10.1002/da.22867
23. Werner-Seidler A, Perry Y, Calear AL, Newby JM, Christensen H. School-based depression and anxiety prevention programs for young people: a systematic review and meta-analysis. Clin Psychol Rev. 2017;51:30–47. doi:10.1016/j.cpr.2016.10.005
24. Regehr C, Glancy D, Pitts A. Interventions to reduce stress in university students: a review and meta-analysis. J Affect Disord. 2013;148(1):1–11. doi:10.1016/j.jad.2012.11.026
25. Wathelet M, Duhem S, Vaiva G, et al. Factors associated with mental health disorders among university students in France confined during the COVID-19 pandemic. JAMA Netw Open. 2020;3(10):e2025591. doi:10.1001/jamanetworkopen.2020.25591
 © 2021 The Author(s). This work is published and licensed by Dove Medical Press Limited. The
full terms of this license are available at https://www.dovepress.com/terms
and incorporate the Creative Commons Attribution
- Non Commercial (unported, 3.0) License.
By accessing the work you hereby accept the Terms. Non-commercial uses of the work are permitted
without any further permission from Dove Medical Press Limited, provided the work is properly
attributed. For permission for commercial use of this work, please see paragraphs 4.2 and 5 of our Terms.
© 2021 The Author(s). This work is published and licensed by Dove Medical Press Limited. The
full terms of this license are available at https://www.dovepress.com/terms
and incorporate the Creative Commons Attribution
- Non Commercial (unported, 3.0) License.
By accessing the work you hereby accept the Terms. Non-commercial uses of the work are permitted
without any further permission from Dove Medical Press Limited, provided the work is properly
attributed. For permission for commercial use of this work, please see paragraphs 4.2 and 5 of our Terms.