Back to Journals » Journal of Asthma and Allergy » Volume 15
Airway Inflammation Before and After Bronchial Thermoplasty in Severe Asthma
Authors Wijsman PC ![]() , Goorsenberg AWM, Ravi A, d'Hooghe JNS, Dierdorp BS, Dekker T, van Schaik CCLM, ten Hacken NHT, Shah PL
, Goorsenberg AWM, Ravi A, d'Hooghe JNS, Dierdorp BS, Dekker T, van Schaik CCLM, ten Hacken NHT, Shah PL ![]() , Weersink EJM, Bel EH, Annema JT, Lutter R, Bonta PI
, Weersink EJM, Bel EH, Annema JT, Lutter R, Bonta PI
Received 27 July 2022
Accepted for publication 30 September 2022
Published 16 December 2022 Volume 2022:15 Pages 1783—1794
DOI https://doi.org/10.2147/JAA.S383418
Checked for plagiarism Yes
Review by Single anonymous peer review
Peer reviewer comments 2
Editor who approved publication: Dr Amrita Dosanjh
Pieta C Wijsman,1,* Annika WM Goorsenberg,1,* Abilash Ravi,1,2,* Julia NS d’Hooghe,1 Barbara S Dierdorp,2 Tamara Dekker,2 Charlotte CLM van Schaik,1 Nick HT ten Hacken,3 Pallav L Shah,4– 6 Els JM Weersink,1 Elisabeth H Bel,1 Jouke T Annema,1 René Lutter,1,2 Peter I Bonta1
1Department of Pulmonary Medicine, Amsterdam UMC, University of Amsterdam, Amsterdam, the Netherlands; 2Department of Experimental Immunology, Amsterdam Infection and Immunity Institute, Amsterdam UMC, University of Amsterdam, Amsterdam, the Netherlands; 3Department of Pulmonology, University Medical Center Groningen, University of Groningen, Groningen, the Netherlands; 4Department of Pulmonology, Royal Brompton Hospital, London, UK; 5National Heart & Lung Institute, Imperial College, London, UK; 6Department of Pulmonology, Chelsea & Westminster Hospital, London, UK
*These authors contributed equally to this work
Correspondence: Peter I Bonta, Email [email protected]
Background: Bronchial thermoplasty (BT) is a bronchoscopic treatment for severe asthma, of which the working mechanism and responder profile are partly unknown. The aim of this study is to analyse whether BT alters airway inflammation by epithelial gene expression, inflammatory cell counts and cytokines, and whether this relates to treatment response.
Methods: In this clinical trial, 28 severe asthma patients underwent bronchoscopy before and after treatment to obtain bronchial brushes and bronchoalveolar lavage fluid (BALF) from treated and untreated airways. RNA was extracted from bronchial brushes for transcriptome analysis, and BALF cells and cytokines were analysed. Asthma quality of life questionnaires were used to distinguish responders from non-responders. We compared results before and after treatment, between treated and untreated airways, and between responders and non-responders.
Results: Gene expression of airway epithelium related to airway inflammation gene set was significantly downregulated in treated airways compared to untreated airways, although this did not differ for patients before and after treatment. No differences were observed in cell counts and cytokines, neither from the untreated compared to treated airways, nor before and after treatment. At baseline, compared to non-responders, the expression of genes related to glycolysis in bronchial epithelium was downregulated and both BALF and blood eosinophil counts were higher in responders.
Conclusion: Local differences in gene sets pertaining to epithelial inflammatory status were identified between treated and untreated airways after treatment, not resulting in changes in differential cell counts and cytokine analyses in BALF. Secondly, baseline epithelial glycolysis genes and eosinophil counts in BALF and blood were different between responders and non-responders. The observations from this study demonstrate the potential impact of BT on epithelial gene expression related to airway inflammation while also identifying a possible responder profile.
Keywords: airway inflammation, bronchial thermoplasty, bronchoalveolar lavage fluid cells, cytokines, epithelial transcriptome
Introduction
Asthma is a heterogeneous disease with episodes of dyspnoea due to bronchial hyperreactivity. The heterogeneity is reflected by varying degrees of chronic airway inflammation and tissue remodeling, and differences in response to treatment.1 Mild-to-moderate asthmatic patients are usually well controlled by inhaled medication, while approximately 5% of the asthma patients remain unstable despite high-dose inhaled medication and/or oral corticosteroid treatment.2 Alternative therapeutic options for these severe asthma patients predominantly target type-2 immune responses, such as anti-immunoglobulin E (IgE), anti-interleukin (IL)-5/anti-IL-5R and anti-interleukin-4R treatment.3–6 A notable number of severe asthma patients, however, are not eligible for type-2 inflammation targeted therapies or do not respond clinically to these treatments.7 Therefore, there is a need for other targeted therapies for these patients.
A treatment developed specifically to target airway remodeling is bronchial thermoplasty (BT). During this bronchoscopic treatment, medium- to large-sized airways are heated by radiofrequency energy.8 Several randomized studies and large “real world” registries have shown clinical benefit after BT, with improvements in quality of life, asthma control and reduction of exacerbations, hospitalizations and emergency department visits.9–12 BT treatment has been designed to reduce airway smooth muscle (ASM) mass, which is known to be increased in asthma patients and, importantly, correlates with asthma severity.13 However, so far most studies have not found a correlation between the reduction of ASM mass after BT14–16 and treatment response, as measured by asthma control and quality of life questionnaires.17–19 Therefore, the exact mechanism of action and responder profile of BT remains still incompletely understood.20
Besides ASM cells, bronchial epithelial cells are also exposed to the radiofrequency energy during BT, which has led to disruption of the epithelium immediately after BT.21,22 The impact of BT on the epithelium also leads to higher epithelial expression of MUC5AC and higher levels of IL-13Rα2 and IFN-α/β.23 In addition, both ASM and bronchial epithelial cells can produce pro-inflammatory mediators in severe asthma patients.13,24–28 We hypothesize that BT alters airway inflammation as detected by epithelial gene expression, inflammatory cell counts and cytokines and this modification correlates with clinical response. Hence, this study aims to assess the impact of BT treatment on 1) the transcriptome of bronchial epithelium and 2) analyse inflammatory cytokines and cell counts in the bronchoalveolar lavage fluid (BALF). Furthermore, we investigated whether the observed changes are related to treatment response.
Materials and Methods
Subjects and Study Design
This study is a sub-study of the TASMA trial (ClinicalTrials.gov NCT02225392) in which severe asthma patients are treated with BT.19 Patients who fulfilled the World Health Organization29 and Innovative Medicine Initiative30 definitions were included after written informed consent. Patients were recruited in 2 centers in the Netherlands (Amsterdam University Medical Centers and University Medical Center in Groningen) and 2 centers in the United Kingdom (Royal Brompton Hospital and the Chelsea & Westminster Hospital, both in London). This study was performed in compliance with the Declaration of Helsinki. Ethical approval was provided by the ethical committees of the 4 centers. The study design of this sub-study is shown in Figure 1. Baseline data collected 3 weeks before BT treatment was used for analysis. This included a bronchoscopy performed to obtain bronchial brushes and BALF from the left lower lobe and lingula, respectively. Six months after BT, all patients underwent a post-BT bronchoscopy to obtain brushes and BALF from the left lower lobe and lingula airways again and, in addition, brushes and BALF were obtained from the untreated middle lobe.
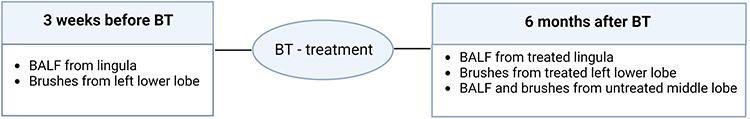 |
Figure 1 Study design. Three weeks before BT treatment baseline data were collected: BALF from the lingula and brushes from the left lower lobe. Six months after BT treatment BALF and brushes were collected from the treated lingula and left lower lobe, and untreated middle lobe. (Figure created with BioRender.com). Abbreviations: BT, bronchial thermoplasty; BALF, bronchoalveolar lavage fluid. |
Bronchial Thermoplasty and Bronchoscopies
Bronchoscopies were performed under conscious sedation (remifentanil/propofol)31 or general anaesthesia according to the current recommendations8,32 using the Alair System (Boston Scientific, USA). Per protocol, the middle lobe was not treated by BT and served as a control. Patients were treated with prednisolone 50 mg starting 3 days before the procedure, on the day itself and one day thereafter. During each bronchoscopy, BALF was performed in wedge position in the lingula using 4–5 fractions of 20 mL of saline with a minimum of 15–20 mL recovery. Thereafter, endobronchial brushes were taken from the left lower lobe. During follow-up research bronchoscopy, 6 months after BT treatment, BALF and brushes were collected from the treated lingual and left lower lobe airways and untreated middle lobe. Per bronchoscopy 4 brushes were obtained from the left lower lobe of which 2 brushes were pooled for RNA analysis. In the middle lobe, one brush was used for RNA analysis.
RNA Isolation, Sequencing and Analysis
Bronchial epithelial cells were the predominant cells (>95%) obtained from the bronchial brushings. If available 2 brushes were pooled together and pelleted by centrifugation for 10 minutes at 267g at 4°C. TRIzol™ (Thermo Fisher Scientific, Paisley, United Kingdom) was added to the cell pellet and subsequently stored at −80°C until RNA isolation. The RNA isolation method, cDNA library preparation, RNA sequencing and analysis are provided in Appendix 1. For heat maps, log2 gene expression values were normalized with Z-scores calculated by (X (value of the individual sample) - μ (average of the row))/σ (standard deviation of the row). The clustering of genes represented in heat maps was based on k-means clustering. The combination of Z-scores for all genes are represented below the heat maps in red and blue, red indicating high expression and blue for low expression.
Gene Set Enrichment Analysis (GSEA)
All differentially expressed genes with a q-value less than 0.05 compared between 2 groups were used for gene set enrichment analysis (GSEA) in the online platform (www.gsea-msigdb.org). The gene identifiers were uploaded in the molecular signature database of the website, and the overlapping gene sets were computed. The P-values were derived on the basis of hypergeometric distribution for k – 1, K, N – K, and n, where k is the number of genes in the intersection of the query set with a set from the Molecular Signature Database, K is the number of genes in the set from the Molecular Signature Database, N is the total number of all human genes, and n is the number of genes in the query set. The false discovery rate (q-value) analog of the hypergeometric P-value was determined by correction for multiple hypothesis testing according to Benjamini and Hochberg. The gene sets thus identified were plotted in heat maps to visualize gene expression of all individuals separately.
Broncho Alveolar Lavage Fluid (BALF) Processing
BALF was centrifuged at 267g for 10 minutes at 4°C and brake at 3. The supernatant was collected and stored at –80°C in aliquots until analyses were performed. The cells in the pellet were resuspended in phosphate buffered saline and counted using a Burker-Turk hemocytometer (Emergo, Landsmeer, The Netherlands). When available, 500 cells were differentially counted on Diff-Quik stained cytospin slides as eosinophils, neutrophils, macrophages/monocytes, lymphocytes and epithelial (columnar and squamous) cells. The following mediators were assessed in BALF by Luminex: CXCL-8 (IL-8), CXCL-10 (IP-10), IL-6, G-CSF, GM-CSF, IL-1α, IL-1β, TNF-α, IL-17A, GRO-α, IL-5, IL-13, IL-4, IL-33, TSLP, IL-12p70, IL-18, Eotaxin 2/3 and VEGF-a (CXCL-8, CXCL-10 and MIF using BioRad reagents and the others using Invitrogen reagents). Myeloperoxidase (MPO) for neutrophil activation was determined by ELISA and eosinophil cationic protein (ECP) for eosinophil activation by Mesoscale.
Statistical Analysis
No sample size calculation was performed for this explorative study. Statistical analyses were performed in GraphPad Prism version 5.01 (GraphPad Software Inc) or IBM SPSS Statistics version 25.0. Demographic parameters were provided as mean with SD or median with interquartile ranges. Differences in cell counts and cytokines between pre-BT, the untreated middle lobe and BT-treated lobes were analysed using Friedman test for paired non-parametric analyses. The AQLQ score was chosen to assess quality of life, in line with previous research.10 An improvement of ≥0.5 points represented a clinically relevant result.33 Mann–Whitney U-test was used to compare responders and non-responders at baseline. One patient was not able to fill in the questionnaires due to high symptom burden after BT and was therefore judged a non-responder by the treating physician. Two-sided P-values were used with a statistical significance at P < 0.05.
Results
Twenty-eight severe asthma patients were included in this study, a subgroup from the TASMA trial.19 One patient was excluded from analysis due to anti-IL-5 treatment during the follow-up period. Paired bronchial epithelial samples for transcriptome analysis were available for 25 patients (2 samples were too low in RNA quality for adequate sequencing and therefore excluded) and paired BALF samples were available from 26 patients (in a single patient BALF recovery was insufficient after BT). Baseline characteristics are shown in Table 1. Overall, Asthma Quality of Life Questionnaire (AQLQ) and 6-item Asthma Control Questionnaire (ACQ-6) significantly improved after BT: AQLQ increased from 4.13 (± 0.94) to 4.84 (± 1.20) (P-value = 0.004, n = 26) and ACQ-6 decreased from 2.65 (± 0.6) to 2.14 (± 1.0) (P-value = 0.01, n = 26). Thirteen patients had an improvement of ≥0.5 on their AQLQ scores after BT therapy and were defined as responders. Responders showed a clinically relevant mean change in AQLQ of 1.7 (± 0.6), while AQLQ scores in non-responders had a non-relevant change of −0.3 (± 0.5). The exacerbation rate per half year significantly reduced from 2.48 (±2.6) prior to BT to 0.59 (±1.05) after BT (P-value = 0.0004, n = 27). The exacerbation rate in the responder group per 6 months significantly reduced from 2.81 (±3.3) prior to BT to 0.31 (±0.48) after BT (P-value = 0.02, n = 13).
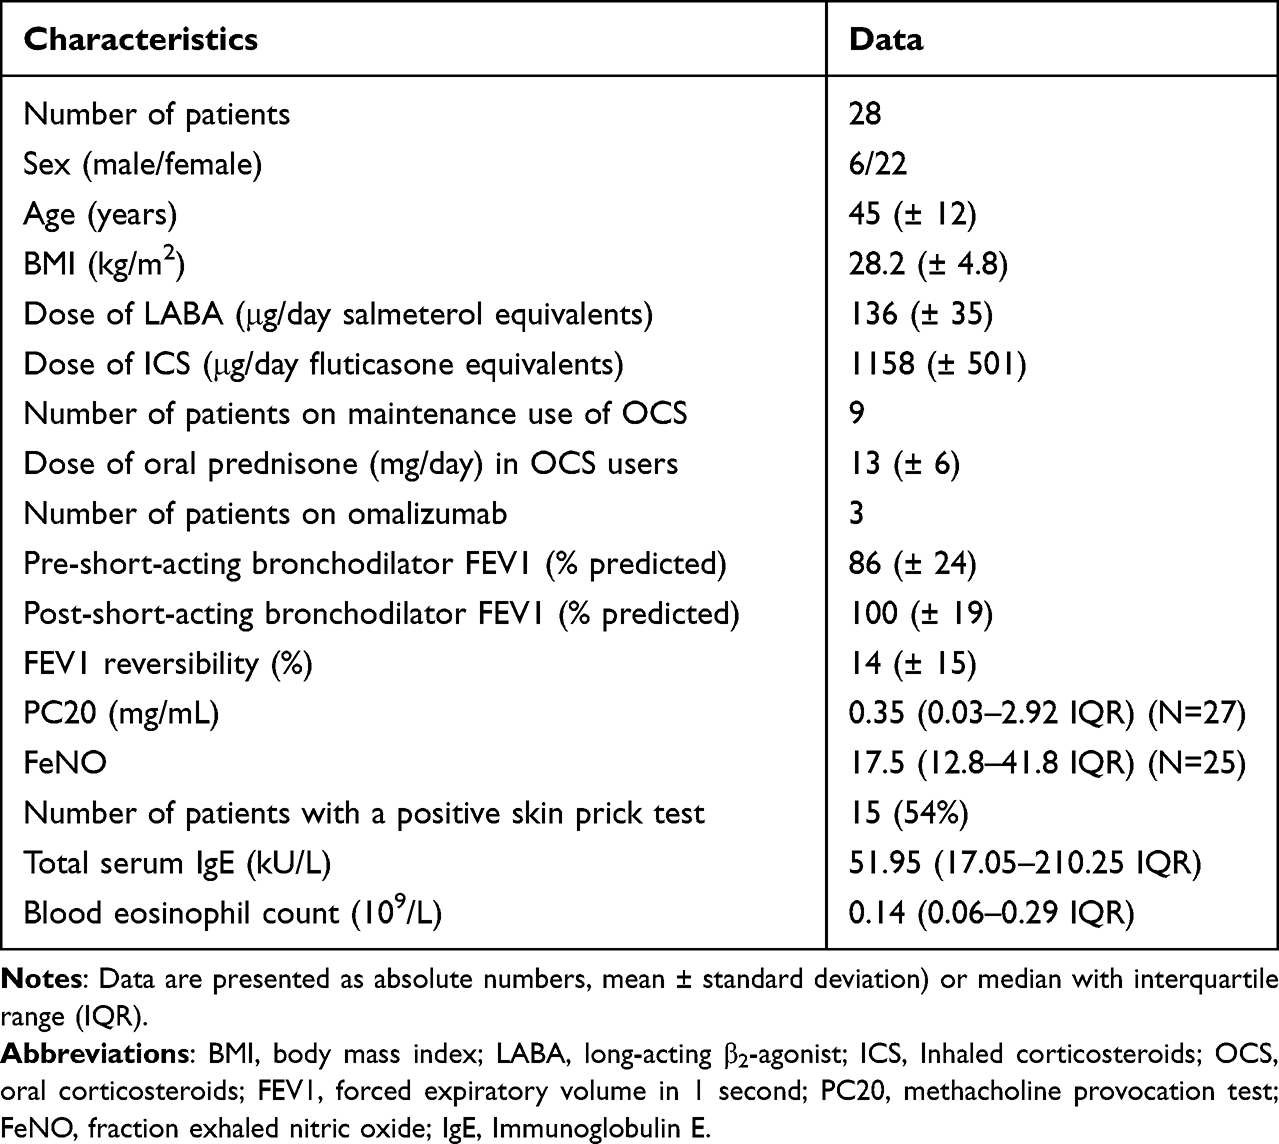 |
Table 1 Patient Characteristics at Baseline |
The impact of BT treatment after 6 months follow-up was assessed by RNA-sequencing of brushed bronchial epithelial cells from BT-treated airways compared with that of untreated airways as control. Five hundred twelve genes were differentially expressed in brushes of the bronchial epithelium comparing the untreated middle lobe and BT-treated airways at the same time point. GSEA showed that these genes belong to TNF-α signalling via NFkB, myc targets, hypoxia, UV response, P53, metabolic genes (oxidative phosphorylation, glycolysis, fatty acid metabolism) and apoptosis genes (Table 2).
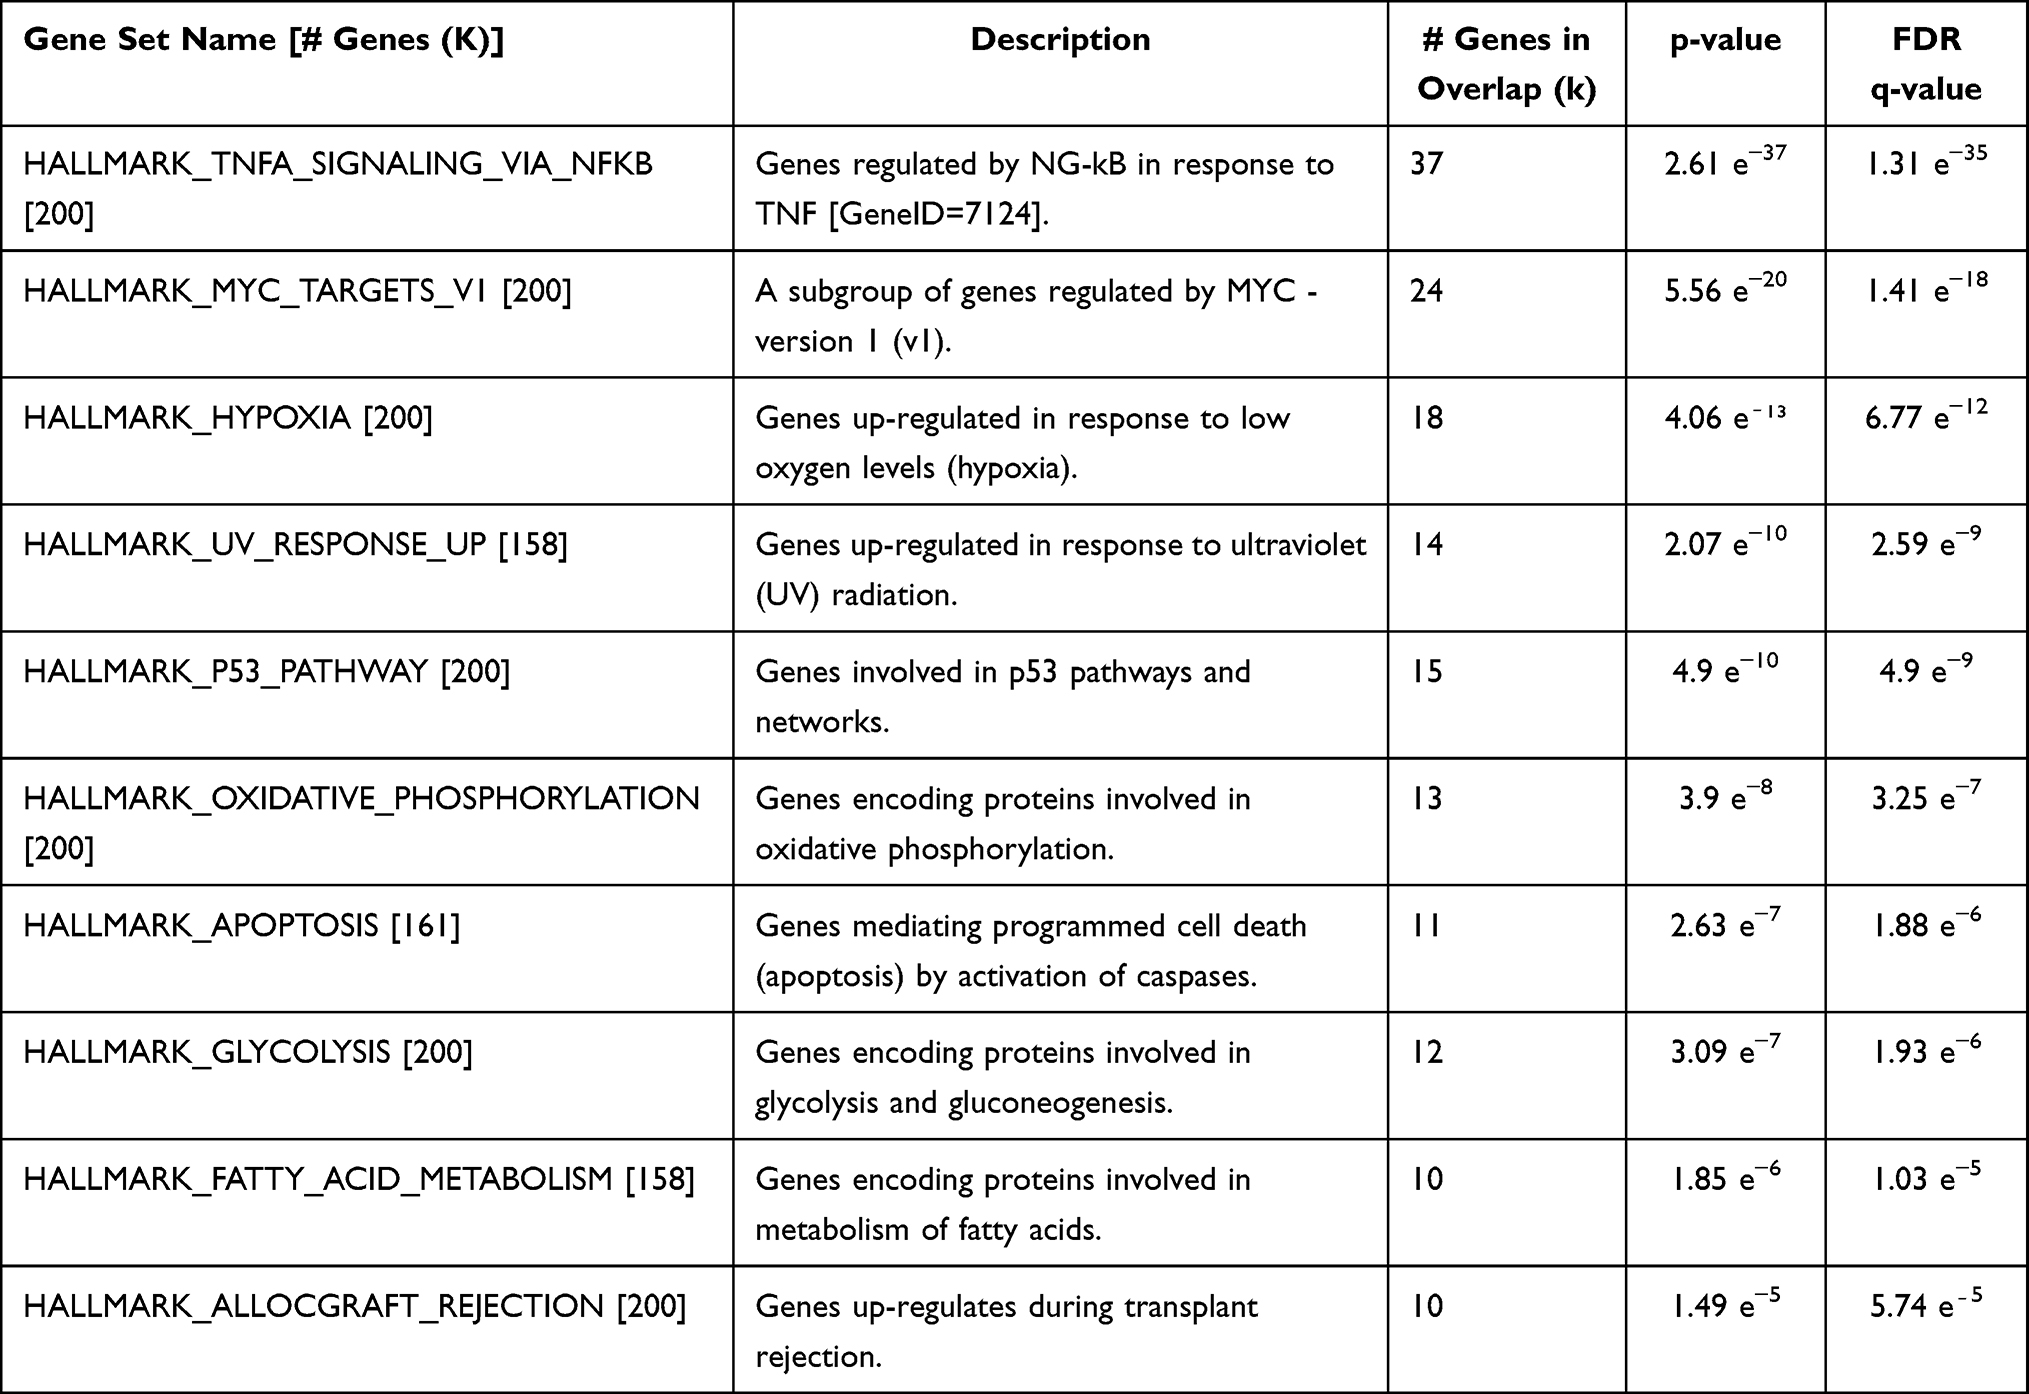 |
Table 2 Gene Set Enrichment Analysis (GSEA) Showing the List of Differentially Expressed Gene Sets |
The top gene set pertaining to inflammatory status (TNF-α signalling via NFkB), as shown in heat maps (Figure 2A), was significantly downregulated in bronchial epithelium from BT-treated airways compared to untreated airways, obtained at the same time point. The line graphs plotting the Z-scores, combined for all genes displayed in the heat maps, also showed a significant decrease of TNF-α signalling via NFkB for BT-treated airways compared to untreated airways (Figure 2B). The transcriptome of bronchial epithelial brushes obtained 3 weeks before BT treatment, ie at baseline, revealed no differences in gene expression as compared to 6 months after BT treatment (Figure 2C), although the variability in gene expression was less after BT as reflected by its standard deviations (pre BT 0.6 SD; post-BT region 0.43 SD).
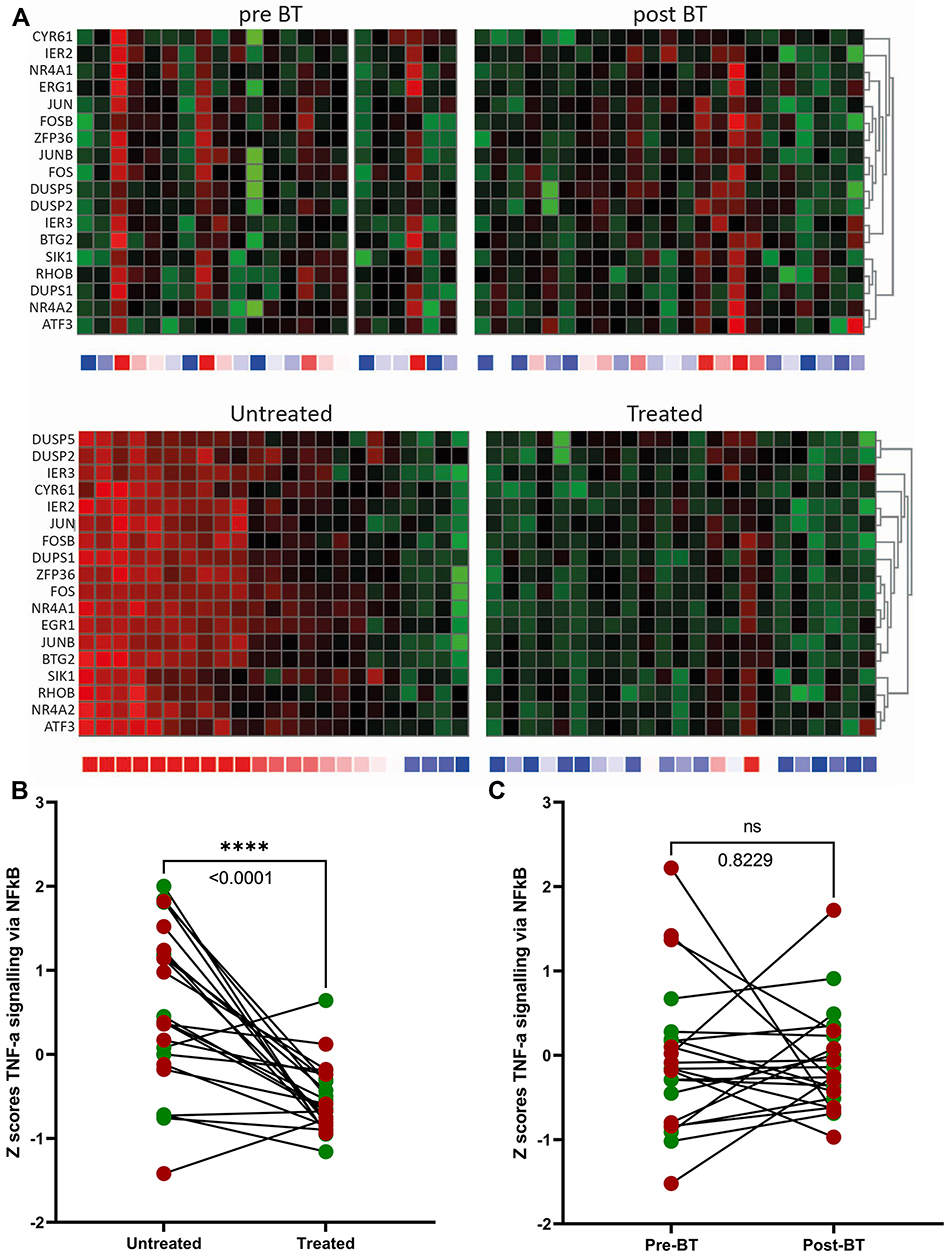 |
Figure 2 Differentially expressed gene sets before and after BT treatment. (A) (upper panel: baseline (pre BT) versus after treatment (post BT)). Heatmaps of inflammatory genes for bronchial epithelial cells showing a non-significant difference between the baseline (pre BT) and treated airways (post BT). (A) (lower panel: untreated versus treated (after treatment)). Heatmaps of inflammatory genes for bronchial epithelial cells after BT showing a significant downregulation of the treated lobe compared to the untreated middle lobe. (B) (After treatment). Z-scores from heatmaps showing a significant difference between untreated middle lobe and treated lobes after BT (p<0.0001 = ****). There were no significant differences between responders (green dots) and non-responders (red dots). (C) (baseline versus after treatment). Z-scores from heatmaps showing a non-significant difference between the baseline (pre-BT) and treated airways (post-BT). |
The responders and non-responders did not show differences in overall gene expression in bronchial epithelium from the treated and untreated airways, ie after correction for multiple testing (Figure 3A). However, when analysing potential candidate gene sets at baseline, genes representing glycolysis (Figure 3B) and corticosteroid response genes (Supplementary Figure 1A) were found to be potential predictors of response to BT treatment. At baseline, heatmaps of genes representing glycolysis are reduced in responders and heatmaps representing corticosteroid response genes are enhanced in the responders, compared to that in non-responders. Line graphs representing Z-scores of all genes in the gene set showed significant increases in glycolysis genes in non-responders compared to responders (Figure 3C). Similar comparisons showed reduced expression of corticosteroid response genes in non-responders as compared to responders, despite the use of (inhaled) corticosteroids. However, this was not significant (Supplementary Figure 1B).
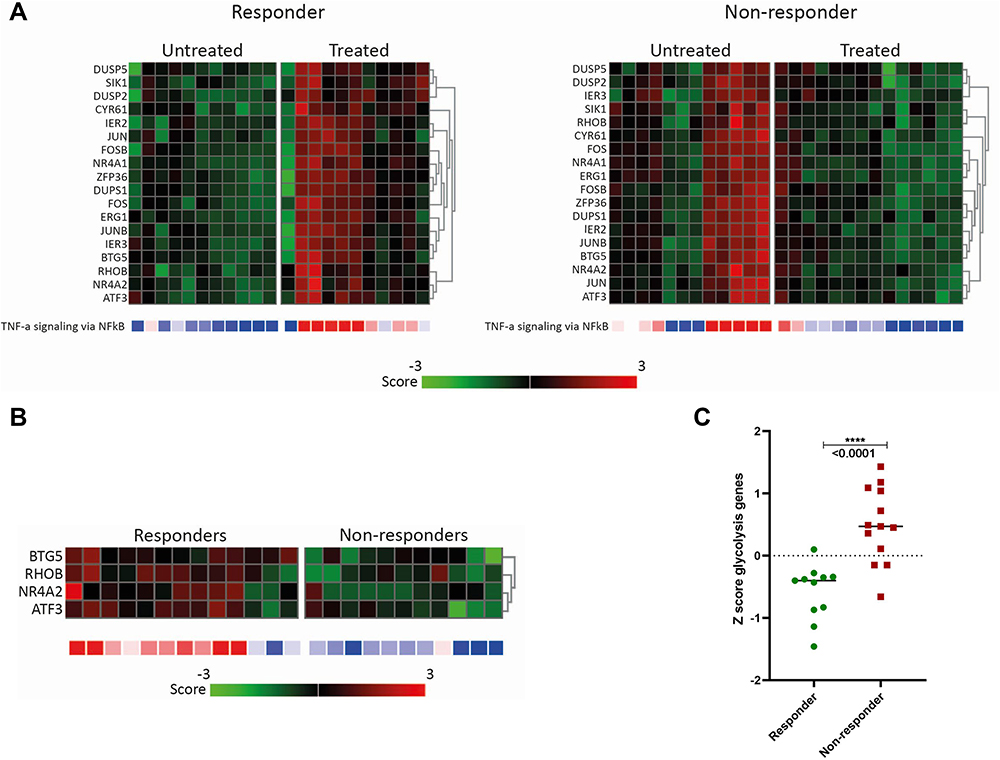 |
Figure 3 Differentially expressed inflammatory and glycolysis gene sets in the responder and non-responder groups. (A) After treatment: Heatmaps of inflammatory genes for bronchial epithelial cells are downregulated in treated airways compared to the untreated (middle) lobe. No differences between responders and non-responders were seen. (B and C) at baseline: Glycolysis gene expression in responders and non-responders. (B) Heatmaps of genes representing glycolysis showing that glycolysis genes are downregulated in responders. (C) Z-scores from glycolysis genes showing a significant difference between responders and non-responders. |
No significant differences were found in differentiated cell counts in BALF before and after BT (Supplementary Figure 2). In addition, no differences between untreated middle lobe BALF samples were detected as compared to treated airways (Supplementary Figure 3). Neither did we find significant changes in blood eosinophils between baseline (0.13 × 10^9/L (0.06; 0.26 IQR)) compared to post BT values (0.14 × 10^9/L (0.07; 0.22 IQR), P-value = 0.95).
When comparing responders with non-responders at baseline, a higher BALF eosinophil count was found in responder patients: 0.80 × 10^9/L (0.20; 2.15 IQR) compared to 0.20 10^9/L (0,0; 0.45 IQR) in non-responders (P-value = 0.02).
In addition, compared to non-responders, it was found that the responders have significant higher blood eosinophil counts (0.22 × 10^9/L (0.12; 0.30 IQR)) vs (0.1 × 10^9/L (0.05; 0.12 IQR), P-value = 0.006) and a significant higher total IgE serum count (182 kU/L (436.5; 16.4 IQR) vs 25 kU/L (220; 14.8 IQR), P-value = 0.02). The differences found at baseline between the groups are shown in Figure 4. No other significant differences were found in BALF and blood values between responders and non-responders at baseline (Supplementary Figure 4). All 3 patients on anti-IgE (Xolair) at baseline were responder.
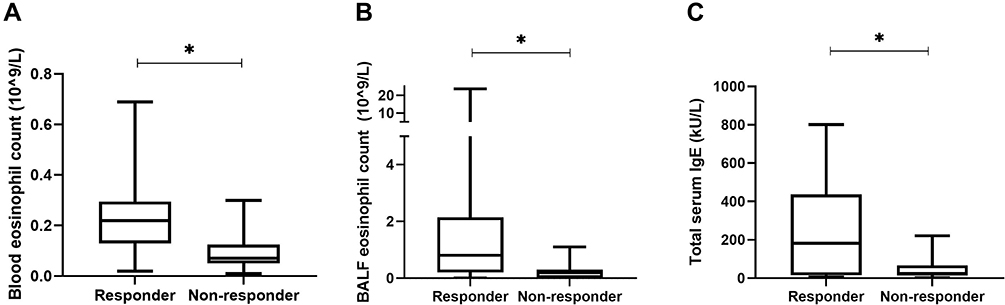 |
Figure 4 Differences at baseline between responders and non-responders. Mann–Whitney U-test analyses showed (A) difference in blood eosinophil count (p=0.006), (B) difference in BALF eosinophil count (p=0.02) and (C) difference between serum IgE (p=0.02) between responders and non-responders. * = p < 0.05. Abbreviations: AQLQ, asthma quality of life questionnaire; BALF, bronchoalveolar lavage; IgE, Immunoglobulin E. |
Only ECP, MPO, VEGF-a, Eotaxin 2/3, GRO-α, CXCL-10, CXCL-8 and MIF were consistently detectable in BALF. There were no differences comparing before with after BT samples nor between the untreated and BT-treated airways (Supplementary Figures 5 and 6), and no significant changes between responders and non-responders (Supplementary Figure 7).
Discussion
In this study, we show that gene sets pertaining to inflammatory status in bronchial epithelial cells from BT-treated airways were downregulated as compared to untreated airways 6 months after BT. This downregulation was not reflected in an attenuated airway inflammation in BALF, based upon differential cell counts and cytokine analyses. Patients responding to BT treatment were those with enhanced baseline blood and BALF eosinophil counts, despite the use of high levels of (inhaled) corticosteroids. Furthermore, the baseline transcriptome of the bronchial epithelial cells showed that responders had lower expression of genes representing glycolysis.
The first 10 gene sets that are significantly differentially expressed in bronchial epithelial cells between the BT-treated and untreated airways are associated with inflammation and metabolism. It is noteworthy that these differences persist for at least 6 months after treatment, indicating that BT treatment has a long-lasting impact on local cells, which is in line with the reported long-term clinical response 5 to 10 years after treatment.34–36
A correlation between airway inflammation and ASM remodeling in asthma is well described.37,38 Considering the reduction in ASM after BT and the direct impact of BT on the epithelium, we postulate that the modulation of these BT targets might well have contributed to the effect measured on local inflammatory gene expression changes in the epithelium after BT. Furthermore, from the clinical trials and registries, we know that BT reduces the number of exacerbations, which implies that BT may limit the inflammatory response during exacerbations.19,23 On the other hand, it is remarkable that the transcriptome from bronchial epithelial cells taken before and after the treatment were not significantly different and differences in airway inflammation based on cytokines and inflammatory cells in BALF after BT could not be detected. A possible explanation for failing to obtain a significant difference is that the transcriptome at baseline has more variation between patients, whereas after treatment this variation is reduced (Figure 2B and C). Although patients were requested to keep their baseline asthma medication stable during the TASMA study, it might be that patients have reduced their inhaled corticosteroids (ICS) and oral corticosteroids (OCS) due to better asthma control after BT with less exacerbations. Secondly, the high variation in the middle lobe could potentially be explained by variability of indirect BT treatment effects on the middle lobe like previously reported for ASM14,19 and neuroendocrine cells.17 This, and the fact that the middle lobe remains untreated, might explain local increase in inflammatory gene expression in the middle lobe as opposed to BT-treated airways and the lack of differences in airway inflammation before and after BT. Previous studies on inflammatory cytokines after BT reported conflicting results, where both reductions23 as no significant changes in cytokines15 are described. It has to be taken into account that these measurements were done at a different time point compared to our study, with a time window of 3 weeks till 3 months after BT. Colleagues have shown a significant reduction of transforming growth factor beta 1 (TGF-β1) and chemokine ligand 5 (CCL5) levels after BT in BALF, but no changes in key cytokines such as interleukin (IL)-4, IL-5, IL-13 and IL-17A.15,39
Recently, we reported a defective translational control in bronchial epithelial cells of asthma patients, most pronounced in severe asthma.40,41 This leads to enhanced inflammation that correlates with corticosteroid unresponsiveness, neutrophilic inflammation and increased glycolysis with reduced oxidative phosphorylation. Our current data indicates that asthma patients responding to BT treatment had, compared to non-responders, a lower expression of glycolysis genes and higher eosinophilic counts in blood and BALF. Previously, we showed that BT resulted in an increased expression of oxidative phosphorylation genes41 and others reported an increased expression of glucocorticoid receptors in epithelial cells after BT treatment.42 Taken together, these findings are indicative for the apparent normalization of the metabolic function of bronchial epithelial cells by BT treatment (Figure 5) which links to a distinct BT responder profile.
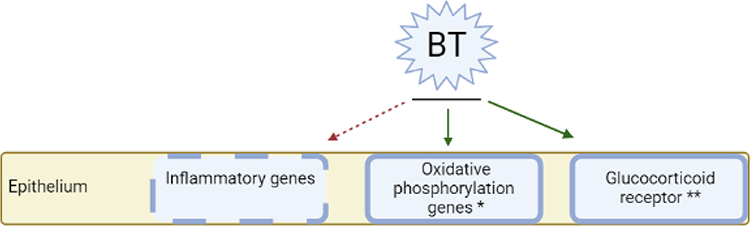 |
Figure 5 Proposed interaction between BT and inflammation. Inflammatory genes are downregulated after BT, whereas the expression of oxidative phosphorylation genes and glucocorticoid receptors is increased after BT, as described in other studies.41,42 *Described in study of Ravi et al41 **Described in study of Papakonstantinou et al42 (Figure created with BioRender.com). Abbreviation: BT, bronchial thermoplasty. |
Responders were defined based on quality of life questionnaires, which is in line with an overall improvement in exacerbation rate. Patients responding to BT treatment in this study, had higher numbers of eosinophils, like previously reported.19,23 Among others, our results implicate that severe asthma patients with moderate levels of eosinophils, despite high-level ICS, and/or elevated IgE have a favorable BT response profile. This is in line with the Global Initiative for Asthma guideline, where BT is considered a treatment modality for patients with severe asthma that have no evidence for type-2 inflammation or remain uncontrolled despite type 2-targeted therapy.1,20 To distinguish responders from non-responders, next to eosinophils, our results indicate that it might be possible to predict treatment response by using glycolysis gene expression profiles. In a previous report, genes SLPI, MMP3 and MUC19 were identified to be different between responders and non-responders, which we could not confirm for our study.43 Facciolongo et al investigated the expression of inflammation-related genes in BT-treated patients 6 weeks after BT during the 3rd BT treatment. There was no mRNA expression found of IL-4, IL-13 and IL-17A, but a limited expression of IL-5 mRNA in bronchial samples. However, an increase in CD68 transcripts after BT is reported with an association to response.44
One of the strengths of this study is that bronchial brushes and BALF were obtained without increasing oral corticosteroids before the bronchoscopy. This is in contrast to other studies in which bronchial samples were generally taken during the BT procedure in conjunction with pre-treatment OCS for 3 days, per treatment protocol.8,32 This may attenuate inflammatory parameters and affect transcriptome of bronchial epithelial cells. In addition, there are few studies in which airway inflammation after BT is analyzed in a relatively large patient group like this study.
Some limitations also need to be addressed. BALF and brushes were only obtained from the middle lobe during the follow-up bronchoscopy and not at baseline. This makes it unclear whether the differences found between the BT-treated and untreated airways were induced by BT alone, which need to be investigated in further studies. In addition, it cannot be excluded that some patients did reduce their ICS use while participating in this study, which may have influenced our results. Lastly, we distinguished responders and non-responders 6 months after treatment, whereas the final effects of BT may occur even later.
Conclusion
This study shows local differences in gene sets pertaining to inflammatory status in the epithelium between BT-treated and untreated airways after BT. These differences did not result in changes in differential cell counts and cytokine analyses in BALF. Baseline epithelial glycolysis genes and eosinophil counts in both BALF and blood were different between responders and non-responders. Therefore, BT responders may be distinguished from non-responders at both transcriptome, systemic and local level. In conclusion, this study shows the impact of BT on epithelial expression of genes related to airway inflammation and supports that BT may be most effective in patients with eosinophils despite optimal treatment with corticosteroids.
Abbreviations
ASM, airway smooth muscle; ACQ-6, 6-item asthma control questionnaire; AQLQ, asthma quality of life questionnaire; BALF, bronchoalveolar lavage fluid; BT, bronchial thermoplasty; ECP, eosinophil cationic protein; GSEA, gene set enrichment analysis; ICS, inhaled corticosteroids; IgE, immunoglobulin E; IL, interleukin; MPO, myeloperoxidase; OCS, oral corticosteroids; SD, standard deviation.
Data Sharing Statement
The datasets generated and/or analysed during the current study are available from the corresponding author upon request.
Clinical Trial Registration Number
ClinicalTrials.gov, NCT02225392
Author Contributions
All authors made a significant contribution to the work reported, whether that is in the conception, study design, execution, acquisition of data, analysis and interpretation, drafting the manuscript, revising or critically reviewing the article; gave final approval of the version to be published. All authors have agreed on the journal to which the article has been submitted and agree to be accountable for all aspects of the work.
Funding
This study was supported by the Lung Foundation Netherlands (Grant number: 5.2.13.064JO), Stichting Astma Bestrijding (SAB): grant nr. 1018/041 and The Dutch Lung Foundation for Health Research and Development (ZonMw grant number: 90713477) and Boston Scientific Corporation. All had no role in the design of the study.
Disclosure
René Lutter and Peter I Bonta are co-last authors for this study.
Prof. Dr. Elisabeth H Bel reports grants from Teva, GSK, AstraZeneca, Sanofi, Chiesi, and Teva, outside the submitted work. Dr Peter I Bonta reports grants from Boston Scientific, Stichting Asthma Bestrijding, and Dutch Lung Foundation for Health Research and Development, during the conduct of the study. The authors report no other conflicts of interest in this work.
References
1. Global Initiative for Asthma. Global strategy for asthma management and prevention; 2021. Available from: www.ginasthma.org.
2. Hekking PP, Wener RR, Amelink M, Zwinderman AH, Bouvy ML, Bel EH. The prevalence of severe refractory asthma. J Allergy Clin Immunol. 2015;135(4):896–902. doi:10.1016/j.jaci.2014.08.042
3. Agache I, Beltran J, Akdis C, et al. Efficacy and safety of treatment with biologicals (benralizumab, dupilumab, mepolizumab, omalizumab and reslizumab) for severe eosinophilic asthma. A systematic review for the EAACI Guidelines - recommendations on the use of biologicals in severe asthma. Allergy. 2020;75(5):1023–1042. doi:10.1111/all.14221
4. Bel EH, Wenzel SE, Thompson PJ, et al. Oral glucocorticoid-sparing effect of mepolizumab in eosinophilic asthma. N Engl J Med. 2014;371(13):1189–1197. doi:10.1056/NEJMoa1403291
5. Ortega HG, Liu MC, Pavord ID, et al. Mepolizumab treatment in patients with severe eosinophilic asthma. N Engl J Med. 2014;371(13):1198–1207. doi:10.1056/NEJMoa1403290
6. Hanania NA, Wenzel S, Rosen K, et al. Exploring the effects of omalizumab in allergic asthma: an analysis of biomarkers in the EXTRA study. Am J Respir Crit Care Med. 2013;187(8):804–811. doi:10.1164/rccm.201208-1414OC
7. Eger K, Kroes JA, Ten A, Bel EH. Long-term therapy response to anti-il-5 biologics in severe asthma-a real-life evaluation. J Allergy Clin Immunol Pract. 2020;9(3):1194–1200. doi:10.1016/j.jaip.2020.10.010
8. Bonta PI, Chanez P, Annema JT, Shah PL, Niven R. Bronchial Thermoplasty in Severe Asthma: best Practice Recommendations from an Expert Panel. Respir Int Rev Thoracic Dis. 2018;95(5):289–300. doi:10.1159/000488291
9. Pavord ID, Cox G, Thomson NC, et al. Safety and efficacy of bronchial thermoplasty in symptomatic, severe asthma. Am J Respir Crit Care Med. 2007;176(12):1185–1191. doi:10.1164/rccm.200704-571OC
10. Castro M, Rubin AS, Laviolette M, et al. Effectiveness and safety of bronchial thermoplasty in the treatment of severe asthma: a multicenter, randomized, double-blind, sham-controlled clinical trial. Am J Respir Crit Care Med. 2010;181(2):116–124. doi:10.1164/rccm.200903-0354OC
11. Chupp G, Laviolette M, Cohn L, et al. Long-term outcomes of bronchial thermoplasty in subjects with severe asthma: a comparison of 3-year follow-up results from two prospective multicentre studies. Eur Respir J. 2017;50(2):1700017. doi:10.1183/13993003.00017-2017
12. Cox G, Thomson NC, Rubin AS, et al. Asthma control during the year after bronchial thermoplasty. N Engl J Med. 2007;356(13):1327–1337. doi:10.1056/NEJMoa064707
13. Benayoun L, Druilhe A, Dombret MC, Aubier M, Pretolani M. Airway structural alterations selectively associated with severe asthma. Am J Respir Crit Care Med. 2003;167(10):1360–1368. doi:10.1164/rccm.200209-1030OC
14. Pretolani M, Dombret MC, Thabut G, et al. Reduction of airway smooth muscle mass by bronchial thermoplasty in patients with severe asthma. Am J Respir Crit Care Med. 2014;190(12):1452–1454. doi:10.1164/rccm.201407-1374LE
15. Denner DR, Doeing DC, Hogarth DK, Dugan K, Naureckas ET, White SR. Airway Inflammation after Bronchial Thermoplasty for Severe Asthma. Ann Am Thorac Soc. 2015;12(9):1302–1309. doi:10.1513/AnnalsATS.201502-082OC
16. d’Hooghe JNS, Goorsenberg AWM, Ten Hacken NHT, et al. Airway smooth muscle reduction after bronchial thermoplasty in severe asthma correlates with FEV1. Clin Exp Allergy. 2019;49(4):541–544. doi:10.1111/cea.13365
17. Pretolani M, Bergqvist A, Thabut G, et al. Effectiveness of bronchial thermoplasty in patients with severe refractory asthma: clinical and histopathologic correlations. J Allergy Clin Immunol. 2017;139(4):1176–1185. doi:10.1016/j.jaci.2016.08.009
18. Chakir J, Haj-Salem I, Gras D, et al. Effects of Bronchial Thermoplasty on Airway Smooth Muscle and Collagen Deposition in Asthma. Ann Am Thorac Soc. 2015;12(11):1612–1618. doi:10.1513/AnnalsATS.201504-208OC
19. Goorsenberg AWM, d’Hooghe JNS, Srikanthan K. Bronchial Thermoplasty Induced Airway Smooth Muscle Reduction and Clinical Response in Severe Asthma. The TASMA Randomized Trial. Am J Respir Crit Care Med. 2021;203(2):175–184. doi:10.1164/rccm.201911-2298OC
20. Russell RJ, Brightling CE. Bronchial thermoplasty: what we know, what we don’t know, and what we need to know. Eur Respir J. 2022;59(1):2102018. doi:10.1183/13993003.02018-2021
21. Goorsenberg AM, d’Hooghe JS, de Bruin D, van den Berk IH, Annema J, Bonta P. Bronchial Thermoplasty-Induced Acute Airway Effects Assessed with Optical Coherence Tomography in Severe Asthma. Respir Int Rev Thoracic Dis. 2018;96(6):564–570. doi:10.1159/000491676
22. Kirby M, Ohtani K, Lopez Lisbona RM, et al. Bronchial thermoplasty in asthma: 2-year follow-up using optical coherence tomography. Eur Respir J. 2015;46(3):859–862. doi:10.1183/09031936.00016815
23. Ladjemi MZ, Di Candia L, Heddebaut N, et al. Clinical and histopathologic predictors of therapeutic response to bronchial thermoplasty in severe refractory asthma. J Allergy Clin Immunol. 2021;148(5):1227–1235.e6. doi:10.1016/j.jaci.2020.12.642
24. Janssen LJ. Airway smooth muscle as a target in asthma and the beneficial effects of bronchial thermoplasty. J Allergy (Cairo). 2012;2012:593784. doi:10.1155/2012/593784
25. Zuyderduyn S, Sukkar MB, Fust A, Dhaliwal S, Burgess JK. Treating asthma means treating airway smooth muscle cells. Eur Respir J. 2008;32(2):265–274. doi:10.1183/09031936.00051407
26. Salazar F, Ghaemmaghami AM. Allergen recognition by innate immune cells: critical role of dendritic and epithelial cells. Front Immunol. 2013;4:356. doi:10.3389/fimmu.2013.00356
27. Holtzman MJ, Byers DE, Alexander-Brett J, Wang X. The role of airway epithelial cells and innate immune cells in chronic respiratory disease. Nat Rev Immunol. 2014;14(10):686–698. doi:10.1038/nri3739
28. Bonser LR, Erle DJ. The airway epithelium in asthma. Adv Immunol. 2019;142:1–34.
29. Bousquet J, Mantzouranis E, Cruz AA, et al. Uniform definition of asthma severity, control, and exacerbations: document presented for the World Health Organization Consultation on Severe Asthma. J Allergy Clin Immunol. 2010;126(5):926–938. doi:10.1016/j.jaci.2010.07.019
30. Bel EH, Sousa A, Fleming L, et al. Diagnosis and definition of severe refractory asthma: an international consensus statement from the Innovative Medicine Initiative (IMI). Thorax. 2011;66(10):910–917. doi:10.1136/thx.2010.153643
31. d’Hooghe JN, Eberl S, Annema JT, Bonta PI. Propofol and Remifentanil Sedation for Bronchial Thermoplasty: a Prospective Cohort Trial. Int Rev Thoracic Dis. 2017;93(1):58–64. doi:10.1159/000452478
32. Niven R, Aubier M, Bonta P, Puente-Maestu L, Facciolongo N, Ryan D. European consensus meeting/statement on Bronchial Thermoplasty Who? Where? How? Respir Med. 2019;150:161–164. doi:10.1016/j.rmed.2019.02.020
33. Juniper EF, Guyatt GH, Willan A, Griffith LE. Determining a minimal important change in a disease-specific Quality of Life Questionnaire. J Clin Epidemiol. 1994;47(1):81–87. doi:10.1016/0895-4356(94)90036-1
34. Zhou JP, Feng Y, Wang Q, Zhou LN, Wan HY, Li QY. Long-term efficacy and safety of bronchial thermoplasty in patients with moderate-to-severe persistent asthma: a systemic review and meta-analysis. J Asthma. 2015;1:1–7.
35. Chaudhuri R, Rubin A, Sumino K, et al. Safety and effectiveness of bronchial thermoplasty after 10 years in patients with persistent asthma (BT10+): a follow-up of three randomised controlled trials. Lancet Respir med. 2021;9(5):457–466. doi:10.1016/S2213-2600(20)30408-2
36. Chupp G, Kline JN, Khatri SB, et al. Bronchial Thermoplasty in Severe Asthmatics At 5 Years: the PAS2 Study. Chest. 2021.
37. Elliot JG, Jones RL, Abramson MJ, et al. Distribution of airway smooth muscle remodelling in asthma: relation to airway inflammation. Respirology. 2015;20(1):66–72. doi:10.1111/resp.12384
38. James AL, Noble PB, Drew SA, et al. Airway smooth muscle proliferation and inflammation in asthma. J Appl Physiol. 2018;125(4):1090–1096. doi:10.1152/japplphysiol.00342.2018
39. Ichikawa T, Panariti A, Audusseau S, et al. Effect of bronchial thermoplasty on structural changes and inflammatory mediators in the airways of subjects with severe asthma. Respir Med. 2019;150:165–172. doi:10.1016/j.rmed.2019.03.005
40. Ravi A, Chowdhury S, Dijkhuis A, Bonta PI, Sterk PJ, Lutter R. Neutrophilic inflammation in asthma and defective epithelial translational control. Eur Respir J. 2019;54(2):1900547. doi:10.1183/13993003.00547-2019
41. Ravi A, Goorsenberg AWM, Dijkhuis A, et al. Metabolic differences between bronchial epithelium from healthy individuals and patients with asthma and the effect of bronchial thermoplasty. J Allergy Clin Immunol. 2021;148(5):1236–1248. doi:10.1016/j.jaci.2020.12.653
42. Papakonstantinou E, Koletsa T, Zhou L, et al. Bronchial thermoplasty in asthma: an exploratory histopathological evaluation in distinct asthma endotypes/phenotypes. Respir Res. 2021;22(1):186. doi:10.1186/s12931-021-01774-0
43. Ano S, Kikuchi N, Matsuyama M, et al. Transcriptome genetic differences between responders and non-responders before bronchial thermoplasty. J Asthma. 2021;58:1–12. doi:10.1080/02770903.2019.1656230
44. Facciolongo N, Bonacini M, Galeone C, et al. Bronchial thermoplasty in severe asthma: a real-world study on efficacy and gene profiling. Allergy Asthma Clin Immunol. 2022;18(1):39. doi:10.1186/s13223-022-00680-4
 © 2022 The Author(s). This work is published and licensed by Dove Medical Press Limited. The
full terms of this license are available at https://www.dovepress.com/terms
and incorporate the Creative Commons Attribution
- Non Commercial (unported, 3.0) License.
By accessing the work you hereby accept the Terms. Non-commercial uses of the work are permitted
without any further permission from Dove Medical Press Limited, provided the work is properly
attributed. For permission for commercial use of this work, please see paragraphs 4.2 and 5 of our Terms.
© 2022 The Author(s). This work is published and licensed by Dove Medical Press Limited. The
full terms of this license are available at https://www.dovepress.com/terms
and incorporate the Creative Commons Attribution
- Non Commercial (unported, 3.0) License.
By accessing the work you hereby accept the Terms. Non-commercial uses of the work are permitted
without any further permission from Dove Medical Press Limited, provided the work is properly
attributed. For permission for commercial use of this work, please see paragraphs 4.2 and 5 of our Terms.
Recommended articles
Early Detection of Asthma: Exploring Inflammatory Biomarkers in Symptomatic Adults with Normal Spirometry
Laroche J, Boulay MÈ, Lechasseur A, Guertin J, Boulet LP, Bergeron C, Lemière C, Lougheed MD, Vandemheen KL, Morissette MC, Aaron SD, Côté A
Journal of Asthma and Allergy 2025, 18:1675-1688
Published Date: 3 December 2025