Back to Journals » International Journal of Nanomedicine » Volume 13
Airspace Dimension Assessment with nanoparticles reflects lung density as quantified by MRI
Authors Aaltonen HL ![]() , Kindvall SS
, Kindvall SS ![]() , Jakobsson JK
, Jakobsson JK ![]() , Löndahl J
, Löndahl J ![]() , Olsson LE
, Olsson LE ![]() , Diaz S, Zackrisson S, Wollmer P
, Diaz S, Zackrisson S, Wollmer P
Received 20 December 2017
Accepted for publication 1 February 2018
Published 21 May 2018 Volume 2018:13 Pages 2989—2995
DOI https://doi.org/10.2147/IJN.S160331
Checked for plagiarism Yes
Review by Single anonymous peer review
Peer reviewer comments 2
Editor who approved publication: Dr Thomas Webster
H Laura Aaltonen,1,2,* Simon S Kindvall,3,* Jonas K Jakobsson,4 Jakob Löndahl,4 Lars E Olsson,3,5 Sandra Diaz,1,2 Sophia Zackrisson,1,2 Per Wollmer1,2
1Department of Medical Imaging and Physiology, Skåne University Hospital, Malmö, Sweden; 2Department of Translational Medicine, Lund University, Malmö, Sweden; 3Department of Medical Radiation Physics, Lund University, Malmö, Sweden; 4Department of Design Sciences, Lund University, Lund, Sweden; 5Department of Hematology, Oncology and Radiation Physics, Skåne University Hospital, Malmö, Sweden
*These authors contributed equally to this work
Background: Airspace Dimension Assessment with inhaled nanoparticles is a novel method to determine distal airway morphology. This is the first empirical study using Airspace Dimension Assessment with nanoparticles (AiDA) to estimate distal airspace radius. The technology is relatively simple and potentially accessible in clinical outpatient settings.
Method: Nineteen never-smoking volunteers performed nanoparticle inhalation tests at multiple breath-hold times, and the difference in nanoparticle concentration of inhaled and exhaled gas was measured. An exponential decay curve was fitted to the concentration of recovered nanoparticles, and airspace dimensions were assessed from the half-life of the decay. Pulmonary tissue density was measured using magnetic resonance imaging (MRI).
Results: The distal airspace radius measured by AiDA correlated with lung tissue density as measured by MRI (ρ = -0.584; p = 0.0086). The linear intercept of the logarithm of the exponential decay curve correlated with forced expiratory volume in one second (FEV1) (ρ = 0.549; p = 0.0149).
Conclusion: The AiDA method shows potential to be developed into a tool to assess conditions involving changes in distal airways, eg, emphysema. The intercept may reflect airway properties; this finding should be further investigated.
Keywords: nanoparticles, respiratory diagnostics, distal airspaces, airspace dimension assessment with nanoparticles, magnetic resonance densitometry
Introduction
Distal airspaces are often evaluated by pulmonary function testing (PFT), including diffusing capacity for carbon monoxide (DL,CO), or computed tomography (CT). In clinical praxis, however, there are no precise methods to quantify morphological changes in peripheral lungs, which makes diagnosing disease in these areas challenging. Various experimental methods used in research settings have been proposed to evaluate this region, including magnetic resonance imaging (MRI), and deposition studies of inhaled micron-sized particles.
A non-invasive method to estimate distal airspace radius by a series of single breath-hold nanoparticle inhalations has recently been described.1,2 This method, termed Airspace Dimension Assessment with nanoparticles (AiDA), is based on nanoparticle deposition behavior in distal airspaces. Nanoparticles deposit almost exclusively by diffusion; in a given time, the likelihood of deposition depends on the diffusion distance.3 Deposition can be given as particle recovery, ie, the ratio of the particle number concentration in the exhaled air to the particle number concentration in inhaled air. Hence, individuals with increased diffusion distances are expected to show increased recovery. In a proof-of-concept study, COPD-patients showed significantly higher nanoparticle recovery compared to healthy never-smokers.22
This is the first study to estimate distal airspace radius using a nanoparticle recovery method. Similar attempts have been previously conducted with larger, micron-sized particles.4,5 The nanoparticle-based model, however, is not exactly comparable to micron-size models. While the main deposition mechanism for nanoparticles is diffusion, larger particles deposit mainly by gravitational settling and inertial impaction. Hence, in nanoparticle studies, fewer particles are lost in conductive airways. Also, there is reason to assume that nanoparticles penetrate into more peripheral airways than micron-sized particles, especially in diseased lungs. Nanoparticle versus micron-size particle recovery methods are extensively discussed by Löndahl.1 A crucial difference between the two methods is that in AiDA, a simpler measurement procedure can be used, allowing for measurements without a set breathing flow rate. The deposition of nanoparticles is essentially independent of flow during inhalation.2 The use of micron-size particles, on the other hand, requires inspiratory flow to be low (<1 L/s) and constant – conditions that are difficult to achieve, especially in patients with lung disease.
The AiDA measurements give rise to a low exposure to nanoparticles. The subjects in the current study were exposed to <0.05% of daily mass and <0.60% of daily particle number exposure in a comparatively clean urban setting.6
The AiDA method allows recovery to be further analyzed to estimate airspace radius in millimeters, by using half-life of exponential decay. Also, as described by Löndahl,1 the y-intercept of the logarithm of the recovery may carry biological information. The radius estimate, as well as the intercept, still remains to be investigated empirically.
The aim of this study was to investigate if the airspace radius, as measured by AiDA, correlates with pulmonary density as measured by MRI in healthy volunteers. A secondary aim is to explore the possible physiological significance of the intercept of the exponential particle decay curve.
Methods
Subjects
The study group consisted of 25 prospectively recruited healthy, never-smoking volunteers 21–64 years of age. They were allowed an accumulated tobacco consumption of less than one pack-year.
The study was approved by the Regional Ethical Review Board in Lund, Sweden (2014/327), and it was performed in accordance to the Declaration of Helsinki, including obtaining informed written consent from all subjects.
Airspace Dimension Assessment with nanoparticles (AiDA)
Nanoparticle recovery measurements were conducted according to the AiDA method. The apparatus as well as the theoretical background is described in detail elsewhere.1,2 The measurements were performed in a sitting position, using a protocol and breathing manoeuver similar to measuring DL,CO.7 The subjects inhaled nanoparticles through a mouthpiece to total lung capacity, held their breath for a given amount of time, and exhaled to residual volume. The particle concentrations in the inhaled and exhaled gas were measured to determine particle recovery as the ratio between the exhaled and inhaled concentrations. The exhaled aerosol analysis was conducted from a sample obtained from a lung depth of 1,100–1,300 mL. The subjects performed two repeated measurements at three different breath-hold times; 5, 7 and 10 seconds. The breath-hold time figures refer to the time the valves in the breathing circuit remained closed. Some diffusion occurs also during inhalation and exhalation. We therefore calculated an effective breath-hold time analogous to the practice for measurement of DL,CO.7
The apparatus generated a monodisperse aerosol containing 50 nm polystyrene latex nanospheres by an electrospray aerosol generator (TSI model 3480; TSI Inc, Shoreview, MN, USA). Background particles smaller than 50 nm were removed by a differential mobility analyzer (DMA Model 3071; TSI Inc). The method accounts for particle losses within the instrument, humidity, and particle charge.
Nanoparticle recovery was used to calculate the airspace radius as described by Löndahl.1 Briefly, an exponential decay curve is fitted to the recovery values obtained by a series of breath holds of varying duration (Figure 1). The airspace radius is calculated from the half-life of this decay, according to:
|

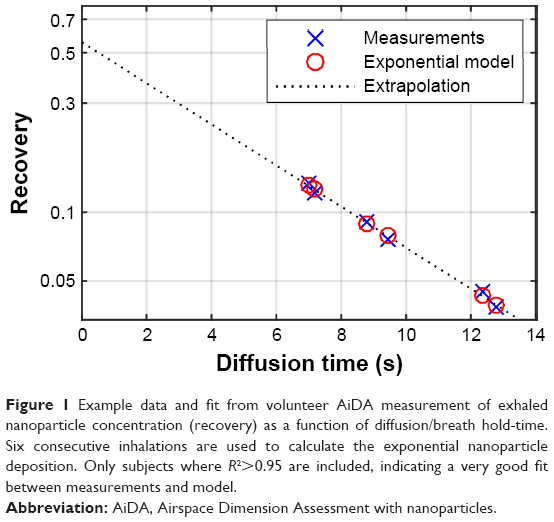 | Figure 1 Example data and fit from volunteer AiDA measurement of exhaled nanoparticle concentration (recovery) as a function of diffusion/breath hold-time. Six consecutive inhalations are used to calculate the exponential nanoparticle deposition. Only subjects where R2>0.95 are included, indicating a very good fit between measurements and model. |
where D is the diffusion coefficient given by the Stokes-Einstein equation, based on temperature, viscosity, and particle size.
Extrapolating the exponential decay curve to the y-intercept yields a theoretical recovery value for a breath-hold time zero (Figure 1).1 To further explore the possible biological information carried by the intercept, correlation analysis to assess relationship between the available anthropometric variables and lung function tests was carried out.
The protocol resulted in a particle number exposure of 104 particles/cm3 and a deposited particle mass of about 0.02 μg in the lungs.
MRI
AiDA should be compared to existing methods to determine distal airspace abnormalities. Enlarged alveoli and reduced perfusion result in a concurrent decrease in proton density, which can be measured in a quantitative manner by MRI.8–10
All MRI measurements were made on a 1.5 Tesla Siemens Magnetom AvantoFit (Siemens Healthcare, Erlangen, Germany), with an 18 channel body coil and a 32 channel spine matrix. Coronal proton density (PD) maps were measured with the Snapshot FLASH pulse sequence to correct for T1.11 The imaging matrix was 128 × 64 zero filled to 256 × 256; field of view 450 mm square; slice thickness 1.5 cm; echo time = 0.67 ms; repetition time = 3.0 ms; and flip angle = 7°. All measurements were preceded by instructions for breath-hold after a tidal inspiration and subjects were given at least 10 seconds of free breathing to restore magnetization equilibrium between measurements. Data processing was made in MatLab R2014b (MathWorks, Natick, MA, USA). The lungs were segmented in three dimension (3D) using the magnitude images, followed by manual removal of major vessels. Segmentations were considered successful when each slice clearly included the signal magnitude gradient representing the border of the lung.
For each subject, a clinical radiologist (HLA) selected three slices ventral to the airway bifurcation and manually placed a region of interest (ROI) representing the left ventricular blood in each image. For each image, the lung PD was normalized to the mean signal intensity of the ventricular ROI.10 Since MRI measurements were made at tidal inspiration – which is a poorly defined lung volume – the volume of the lung at the MRI acquisition, VMRI, is calculated (as the size of the total segmented lung). Assuming the lungs simply inflate without changing tissue or blood content, density values at total lung capacity (TLC) can be calculated by multiplying density values with VMRI/TLC. This TLC-corrected PD was called PD(TLC). Furthermore, all voxels with a density value higher than 60% of the ventricular blood were considered blood vessels and hence, discarded from the analysis.
We used three imaging variables to quantify lung density. These variables were originally developed for computed tomography,12,13 and later adopted to MRI:10
(1) | Mean lung density (MLD) represents the mean PD(TLC) of the entire segmented lung volume in three central slices. |
(2) | The 15th percentile proton density (PD15) was calculated from the PD(TLC) histogram of all voxels in the selected lung slices. |
(3) | The relative area under 7.5% PD (RA7.5), also known as the density mask,14 is the fraction of lung voxels in the selected slices, that have a PD(TLC) less than 7.5% of the ventricular blood signal intensity. |
PFT
The subjects underwent conventional lung function testing performed according to the European Respiratory Society/American Thoracic Society guidelines,15 using a Jaeger MasterScreen PFT (IntraMedic, Sollentuna, Sweden). The measurements were performed without bronchodilation. Total lung capacity (TLC), residual volume (RV), forced expiratory volume in one second (FEV1), and DL,CO values were obtained. Lung function variables are presented as percentage of predicted values.
Statistics
Statistical evaluation was done in MatLab R2014b (MathWorks) and IBM SPSS Statistics 22 (2013). Data are, unless otherwise specified, reported as mean, standard deviation, and range. The Chi-square test was used for sex differences. For the investigated variables and the subjects with complete and acceptable measurements, Spearman’s rank of variables test (ρ) is presented with p-values to assess correlation. The requested level of significance was p less than 0.05 for all statistical tests.
The 95% confidence intervals (95% CI) for the AiDA-parameters are calculated from the estimated standard error and the two-sided t-distribution with 4 degrees of freedom.
Results
Two conditions had to be fulfilled in order for the AiDA-measurement to be considered valid; the inhaled volume had to exceed 2/3 of vital capacity (VC), and the measured values had to correlate with a theoretical model with a coefficient of determination larger than 0.95. All subjects fulfilled the first condition, while two displayed intra-individual correlation less than 0.95, and were subsequently excluded. Furthermore, one subject displayed large intra-individual variation at the 5 second inhalation, and another had to abort the measurement due to air leakage at the instrument mouthpiece; these subjects were also excluded. This resulted in 19 persons being eligible for analysis. Two individuals did not perform pulmonary function tests or AiDA due to logistical reasons.
General demographics, MRI and AiDA values for the study group are presented in Table 1. The sample consisted of 10 females and 9 males.
 | Table 1 Demographics, AiDA, MRI and PFTs |
The only variable displaying a significant sex difference (p<0.05) was height. Linear regressions of AiDA versus MLD, PD15 and RA7.5, are presented in Figure 2A–C.
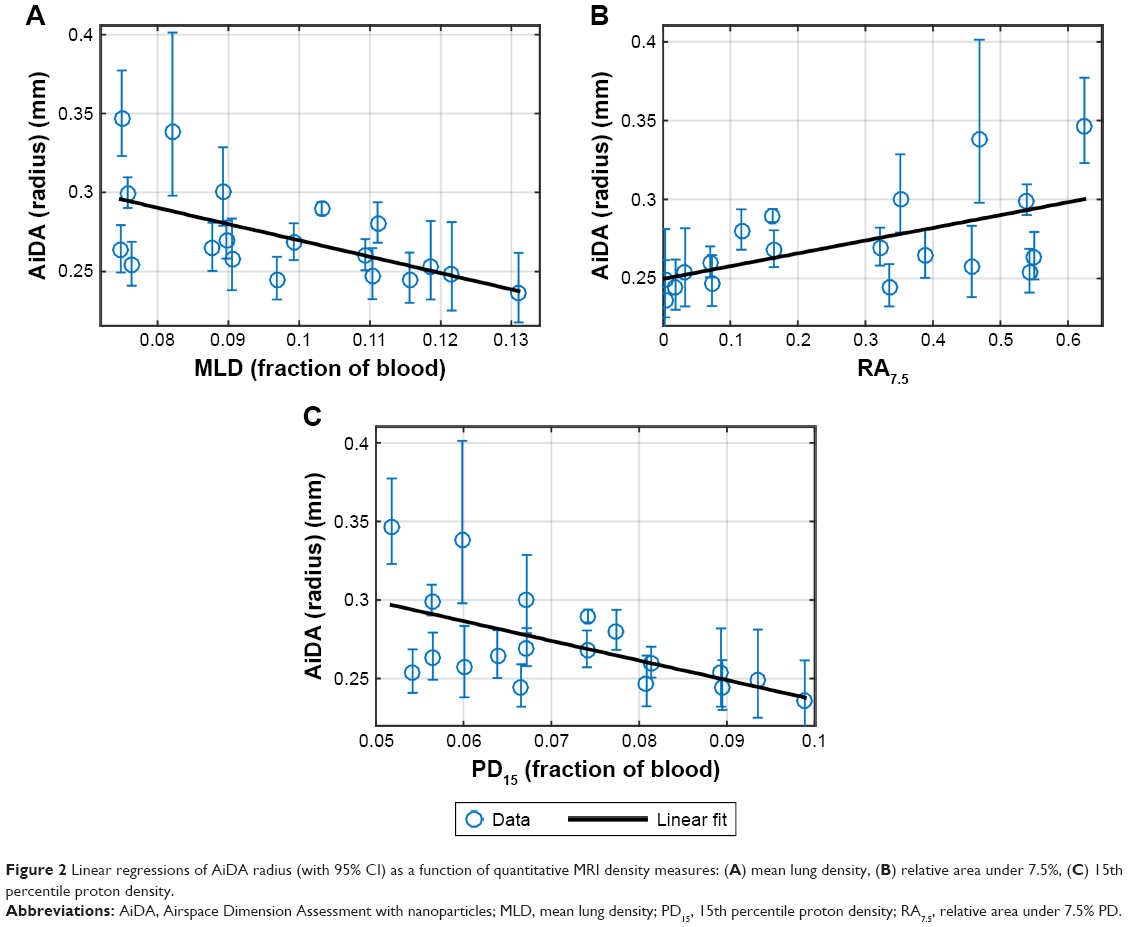 | Figure 2 Linear regressions of AiDA radius (with 95% CI) as a function of quantitative MRI density measures: (A) mean lung density, (B) relative area under 7.5%, (C) 15th percentile proton density. |
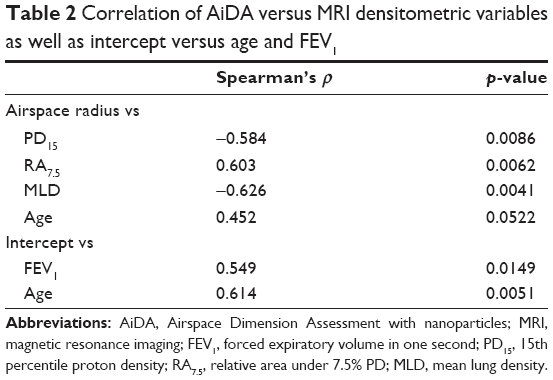
All MRI-derived proton density variables show a significant correlation with the AiDA radius (Table 2). Overall, a high PD15 and MLD are associated with a low radius; conversely, a high RA7.5 is associated with a large radius.
 | Table 2 Correlation of AiDA versus MRI densitometric variables as well as intercept versus age and FEV1 |
The findings suggest there may be a correlation between AiDA radius and age, although this was not established at the required level of significance (p = 0.052). No correlation between AiDA radius could be seen with the variables height, weight, or BMI (p>0.15). Similarly, no significant correlations were found between AiDA radius and pulmonary function parameters FEV1, DL,CO, TLC, RV, or VC, each measured as percentage of predicted (p>0.37).
The intercept correlates significantly with FEV1, measured as percent of predicted (Figure 3). No significant correlations were established between the intercept and the pulmonary function parameters DL,CO, TLC, RV, or VC, given as percentage of predicted (p>0.3).
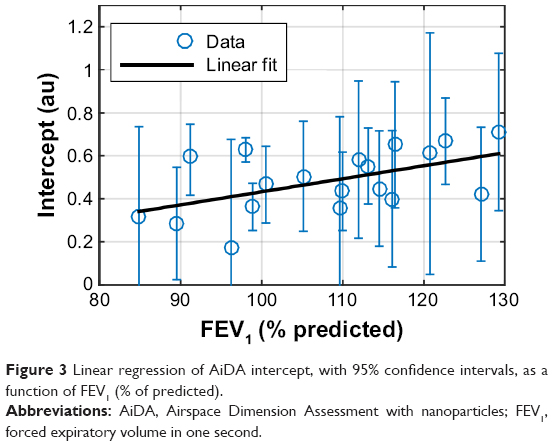 | Figure 3 Linear regression of AiDA intercept, with 95% confidence intervals, as a function of FEV1 (% of predicted). |
The correlation between the intercept and age was found to be significant (Table 2). In contrast, no significant correlations were found between the intercept and the other available anthropometric variables height, weight, or BMI (p>0.4). Finally, no correlation between the airspace radius and the intercept was found (p = 0.46).
Discussion
In this study, the airspace radius measured with AiDA correlates with tissue density measured with MRI; decreasing tissue density corresponds to increasing distal airspace size. Moreover, the intercept, which may reflect time-independent particle losses in the airways, was shown to correlate with FEV1 and age.
We chose healthy, never smoking volunteers for this exploratory study, as we believe long-standing effects of smoking and pulmonary disease may affect the particle deposition behavior. It is, however, difficult to recruit completely tobacco-naïve individuals; hence they were permitted a limited previous exposure to cigarettes (less than one pack-year). Lung tissue density varies in the population, with age, sex, and height. Lung tissue decreases and becomes less elastic with age,16,17 and women have denser lungs than men.18 Also, persons with larger lungs have lower lung density than persons with smaller lungs.19 Zeman found that distal airspace dimension, as estimated with micron-size particles, increased with age.5 Our results suggest the AiDA radius increases with age; the correlation, however, was outside the threshold of statistical significance. The limited sample size and the presence of outliers make it difficult to draw any conclusions regarding correlation to anthropometric measures as well as sex differences. The study is exploratory in nature with few comparable previous studies available. Hence, no prior power analysis was conducted.
When it comes to spirometry, the lack of correlation is less surprising, as the subjects were healthy volunteers. Further studies with larger sample sizes and persons with distal airways abnormalities are needed.
We chose MR densitometry over other available quantitative imaging methods, mainly computed tomography, to avoid exposing the volunteers to ionizing radiation. Several volunteers were young, and we plan to conduct repeated measurements over time. Although we use a sub-millisecond echo time, our PD is not completely independent of T2* (signal loss due to magnetic field gradients). This will give us approximately 35% lower PD values compared to a spin-echo method, as well as contribute with approximately 5% additional intra-subject variability considering a 1,300–1,500 μs spread in T2*.20 As we have only examined healthy volunteers, where very low lung density values are not expected, these T2* issues are acceptable. However, in a patient population suffering from pulmonary tissue degradation, a spin-echo or ultra-short echo time sequence is preferred. We chose to normalize the proton density to the left ventricle and not to skeletal muscle, as has been done previously,10 for two reasons. First, the heart is more central than most visible muscle and the coil sensitivity profile will be more similar to the lung. Second, postural muscles have been shown to vary in CT-attenuation with age and sex,21 which may be true for MRI PD as well, whereas the proton density of left ventricular blood can be considered more equal between subjects of varying age and sex.
Considering RA7.5, it must be noted that the true cut-off (here set to 7.5%) should be determined as the detection limit of emphysema. Since there are no emphysema patients in this study, the value 7.5% is calculated only from the expected lung signal intensity at TLC, including a T2*-dependent signal loss compared to Zhang et al.10
The intercept was shown to correlate with FEV1 and age. This value reflects particle losses during the breathing manoeuver, possibly implicating particle losses in the airways during convective transport.1 Currently, the biological implications of the findings are uncertain; there are no other previous studies regarding the intercept. The losses can be expected to occur in the bronchi, bronchioles, and the gas-exchange region; our findings of FEV1 correlating to the intercept seem to support this notion. Further studies are required.
The nanoparticles are presently not visualized; a study with radiolabelled nanoparticles to show where exactly the particles deposit is needed.
In this study, a high correlation with the theoretical model was achieved, with r2 larger than 0.95 in all but two subjects, implying satisfying measurement precision.
Conclusion
This is the first study of AiDA in a healthy cohort showing that the estimated radius correlates with tissue density. This suggests the method could be further developed into a tool to diagnose conditions that involve changes in tissue density, such as emphysema. Moreover, the intercept from the AiDA analysis correlated with FEV1, suggesting that the method may give information regarding the bronchial component of COPD as well.
Acknowledgments
The following organizations are gratefully acknowledged for financial support: The Swedish Research Council (project 2011-3560); the Crafoord foundation; the Swedish Governmental Agency for Innovation Systems (VINNOVA); the ERA-NET project EuroNanoMed2; the Swedish Heart and Lung Foundation and governmental funding of clinical research within the National Health Services; Allmänna sjukhusets i Malmö stiftelse för bekämpande av cancer; and Stiftelsen för cancerforskning vid onkologiska kliniken vid Universitetssjukhuset MAS. The funders of the study had neither involvement in the study design, data collection, data interpretation, writing of the report, nor in the decision to submit the paper for publication. The funders of the study had no commercial interests. Please contact the authors for data sharing enquiries.
The authors would like to acknowledge Hanna Nicklasson, Department of Translational Medicine, Lund, Sweden, for performing the AiDA-measurements.
Author contributions
All authors contributed toward data analysis, drafting and revising the paper and agree to be accountable for all aspects of the work.
Disclosure
Jakob Löndahl and Per Wollmer have a patent pending for the AiDA technology. The other authors report no conflicts of interest in this work.
References
Löndahl J, Jakobsson JK, Broday DM, Aaltonen HL, Wollmer P. Do nanoparticles provide a new opportunity for diagnosis of distal airspace disease? Int J Nanomedicine. 2017;12:41–51. | ||
Jakobsson JK, Hedlund J, Kumlin J, Wollmer P, Londahl J. A new method for measuring lung deposition efficiency of airborne nanoparticles in a single breath. Sci Rep. 2016;6:36147. | ||
Hinds W. Aerosol Technology: Properties, Behavior, and Measurement of Airborne Particles. 2nd ed. New York: Wiley; 1999. | ||
Blanchard JD. Aerosol bolus dispersion and aerosol-derived airway morphometry: assessment of lung pathology and response to therapy, Part 1. J Aerosol Med. 1996;9(2):183–205. | ||
Zeman KL, Bennett WD. Measuring alveolar dimensions at total lung capacity by aerosol-derived airway morphometry. J Aerosol Med. 1995;8(2):135–147. | ||
Hussein T, Londahl J, Paasonen P, et al. Modeling regional deposited dose of submicron aerosol particles. Sci Total Environ. 2013;458–460:140–149. | ||
Macintyre N, Crapo RO, Viegi G, et al. Standardisation of the single-breath determination of carbon monoxide uptake in the lung. Eur Resp J. 2005;26(4):720–735. | ||
Takahashi M, Togao O, Obara M, et al. Ultra-short echo time (UTE) MR imaging of the lung: comparison between normal and emphysematous lungs in mutant mice. J Magn Reson Imaging. 2010;32(2):326–333. | ||
Ma W, Sheikh K, Svenningsen S, et al. Ultra-short echo-time pulmonary MRI: evaluation and reproducibility in COPD subjects with and without bronchiectasis. J Magn Reson Imaging. 2015;41(5):1465–1474. | ||
Zhang W-J, Hubbard Cristinacce PL, Bondesson E, et al. MR quantitative equilibrium signal mapping: a reliable alternative to CT in the assessment of emphysema in patients with chronic obstructive pulmonary disease. Radiology. 2015;275(2):579–588. | ||
Jakob PM, Hillenbrand CM, Wang T, Schultz G, Hahn D, Haase A. Rapid quantitative lung (1)H T(1) mapping. J Magn Reson Imaging. 2001;14(6):795–799. | ||
Gould GA, MacNee W, McLean A, et al. CT measurements of lung density in life can quantitate distal airspace enlargement – an essential defining feature of human emphysema. Am Rev Respir Dis. 1988;137(2):380–392. | ||
Madani A, Zanen J, de Maertelaer V, Gevenois PA. Pulmonary emphysema: objective quantification at multi-detector row CT – comparison with macroscopic and microscopic morphometry. Radiology. 2006;238(3):1036–1043. | ||
Müller NL, Staples CA, Miller RR, Abboud RT. “Density mask”. An objective method to quantitate emphysema using computed tomography. Chest. 1988;94:782–787. | ||
Quanjer PH, Tammeling GJ, Cotes JE, Pedersen OF, Peslin R, Yernault JC. Lung volumes and forced ventilatory flows. Report Working Party Standardization of Lung Function Tests, European Community for Steel and Coal. Official Statement of the European Respiratory Society. Eur Respir J Suppl. 1993;16:5–40. | ||
Thurlbeck WM. Measurement of pulmonary emphysema. Am Rev Respir Dis. 1967;95(5):752–764. | ||
Knudson RJ, Clark DF, Kennedy TC, Knudson DE. Effect of aging alone on mechanical properties of the normal adult human lung. J Appl Physiol Respir Environ Exerc Physiol. 1977;43(6):1054–1062. | ||
Karimi R, Tornling G, Forsslund H, et al. Lung density on high resolution computer tomography (HRCT) reflects degree of inflammation in smokers. Respir Res. 2014;15(1):23. | ||
Robert HB, Robert AW, Kirk G, Drummond MB, Mitzner W. Lung density changes with growth and inflation. Chest. 2015;148(4):995–1002. | ||
Triphan SMF, Breuer FA, Gensler D, Kauczor H-U, Jakob PM. Oxygen enhanced lung MRI by simultaneous measurement of T1 and T2* during free breathing using ultrashort TE. J Magn Reson Imaging. 2015;41(6):1708–1714. | ||
Anderson DE, D’Agostino JM, Bruno AG, Demissie S, Kiel DP, Bouxsein ML. Variations of CT-based trunk muscle attenuation by age, sex, and specific muscle. J Gerontol A Biol Sci Med Sci. 2013;68(3):317–323. | ||
Aaltonen HL, Jakobsson JK, Diaz S, et al. Deposition of inhaled nanoparticles is reduced in subjects with COPD and correlates with the extent of emphysema: proof of concept for a novel diagnostic technique. Clin Physiol Funct Imaging. Epub 2018 Apr 10. |
 © 2018 The Author(s). This work is published and licensed by Dove Medical Press Limited. The
full terms of this license are available at https://www.dovepress.com/terms
and incorporate the Creative Commons Attribution
- Non Commercial (unported, 3.0) License.
By accessing the work you hereby accept the Terms. Non-commercial uses of the work are permitted
without any further permission from Dove Medical Press Limited, provided the work is properly
attributed. For permission for commercial use of this work, please see paragraphs 4.2 and 5 of our Terms.
© 2018 The Author(s). This work is published and licensed by Dove Medical Press Limited. The
full terms of this license are available at https://www.dovepress.com/terms
and incorporate the Creative Commons Attribution
- Non Commercial (unported, 3.0) License.
By accessing the work you hereby accept the Terms. Non-commercial uses of the work are permitted
without any further permission from Dove Medical Press Limited, provided the work is properly
attributed. For permission for commercial use of this work, please see paragraphs 4.2 and 5 of our Terms.