Back to Journals » International Journal of Nanomedicine » Volume 17
Airspace Dimension Assessment with Nanoparticles (AiDA) in Comparison to Established Pulmonary Function Tests
Authors Petersson-Sjögren M ![]() , Jakobsson J, Aaltonen HL
, Jakobsson J, Aaltonen HL ![]() , Nicklasson H, Rissler J
, Nicklasson H, Rissler J ![]() , Engström G, Wollmer P, Löndahl J
, Engström G, Wollmer P, Löndahl J ![]()
Received 2 February 2022
Accepted for publication 3 May 2022
Published 25 June 2022 Volume 2022:17 Pages 2777—2790
DOI https://doi.org/10.2147/IJN.S360271
Checked for plagiarism Yes
Review by Single anonymous peer review
Peer reviewer comments 2
Editor who approved publication: Professor Israel Rubinstein
Madeleine Petersson-Sjögren,1,2 Jonas Jakobsson,3 H Laura Aaltonen,4,5 Hanna Nicklasson,6,7 Jenny Rissler,1,2,8 Gunnar Engström,9 Per Wollmer,6 Jakob Löndahl1,2
1Division of Ergonomics and Aerosol Technology, Department of Design Sciences, Lund University, Lund, Sweden; 2NanoLund, Lund University, Lund, Sweden; 3Division of Nuclear Physics, Department of Physics, Lund University, Lund, Sweden; 4Department of Translational Medicine, Medical Imaging and Physiology, Lund University, Malmö, Sweden; 5Department of Radiology, University of Washington, Seattle, WA, USA; 6Department of Translational Medicine, Clinical Physiology and Nuclear Medicine, Skåne University Hospital, Malmö, Sweden; 7MVIC Medicon Valley Inhalation Consortium AB, Lund, Sweden; 8Division of Bioeconomy and Health, RISE Research Institutes of Sweden, Borås, Sweden; 9Department of Clinical Sciences, Lund University, Malmö, Sweden
Correspondence: Jakob Löndahl, Division of Ergonomics and Aerosol Technology, Lund University, Box 118, Lund, SE-221 00, Sweden, Email [email protected]
Background: Airspace Dimensions Assessment with nanoparticles (AiDA) is a new method for non-invasive measurement of pulmonary distal airspaces. The aim of this study was to compare AiDA measurements with other pulmonary function variables to better understand the potential of AiDA in a clinical context.
Methods: AiDA measurements and pulmonary function tests were performed in 695 subjects as part of the Swedish CArdioPulmonary bioImage Study. The measurement protocol included spirometry, measurement of diffusing capacity of carbon monoxide, oscillometry and pulmonary computed tomography. AiDA indices were compared to all other pulmonary examination measurements using multivariate statistical analysis.
Results: Our results show that AiDA measurements were significantly correlated with other pulmonary function examination indices, although covariance was low. We found that AiDA variables explained variance in the data that other lung function variables only influenced to a minor extent.
Conclusion: We conclude that the AiDA method provides information about the lung that is inaccessible with more conventional lung function techniques.
Keywords: aerosol nanoparticles, respiratory diagnostics with nanoparticles, distal airspaces, COPD diagnostics, airspace dimension assessment with nanoparticles
Plain Language Summary
There is a need for methods to measure changes deep down in the lung to detect lung disease at an early stage. However, the techniques available for these types of measurements are either too expensive, inaccessible or require ionizing radiation. In this study, we explore the potential of a new method called airspace dimension assessment with nanoparticles (AiDA) for the measurement of airspace dimensions in the deep lung. With AiDA, subjects inhale a small number of aerosolized nanoparticles and the number of particles that are deposited deep down in the lungs is measured with high precision. With knowledge of how inhaled nanoparticles behave in the lung, we derive the size of airspaces in the deep lung.
Our study shows that the AiDA measurements stand out when compared to more conventional pulmonary function measurements. Our results are important since they underline that the AiDA method can become an important tool for the detection of lung diseases in the deep lung.
Introduction
Chronic respiratory diseases are among the leading causes of death worldwide, affecting more than 500 million people.1 There are no cures for chronic respiratory diseases, but pharmacological and physical treatment can help relieve symptoms, slow down the progression2,3 and decrease the risk of premature death.4 It is important to identify early signs of disease, which can facilitate measures to prevent the disease from progressing.
There is a discrepancy between the clinically evident form of chronic respiratory diseases and their early pathological manifestations in the lung distal to the terminal bronchioles. It is hard to detect abnormalities and changes in the most distal lung, and therefore the first signs of disease can be missed or misinterpreted. Diseases such as chronic obstructive pulmonary disease (COPD) and asthma entail damage to the distal lung. Tissue damage can modify distal airspace sizes, lower the surface area available for gas exchange, and reduce lung function. When the disease progresses slowly, with mild or absent initial symptoms, diagnosis is often delayed.5,6 Therefore, early detection of pathological changes to distal airspaces is key for early diagnosis of chronic respiratory diseases.
There are several techniques available for the assessment of lung disease, but non-invasive and cost-effective methods sensitive to the distal airspaces are lacking. The primary diagnostic tool used for the assessment of the distal lung is dynamic spirometry. The GOLD criterion to detect airflow obstruction is to study the ratio between forced expiratory volume in one second (FEV1) and vital capacity (VC). Pulmonary function tests (PFTs) also include measurement of diffusing capacity of carbon monoxide (DLCO). While both spirometry and DLCO are accessible, spirometry primarily assess airflows in the upper airways and often fails to detect early changes in the distal lung.7 DLCO has been found to correlate with both microscopic and macroscopic measures of the distal lung,8,9 but is sensitive to factors such as hemoglobin and carbon monoxide saturation of the blood, as well as recent smoking.10 Pulmonary computed tomography (CT) offers detailed information about anatomical structures, with for instance quantitative analysis of lung volume and lung density. However, CT requires ionizing radiation and is expensive, and evaluation of the generated images is interpretation- and software-dependent.11 Oscillometry (also known as forced oscillation technique, FOT),12 measures respiratory mechanics, ie pulmonary Resistance (Rrs) and Reactance (Xrs),13 by the application of oscillating pressure signals. While Rrs is presumably related to airway calibre, Xrs is related to elastance and inertance, reflecting lung heterogeneity. An association between Xrs and FEV1 in COPD patients has been found,14 and self-reported chronic respiratory diseases have been associated with high pulmonary Rrs and low pulmonary Xrs.15 While the data indicate that oscillometry can be sensitive to airflow obstruction, it cannot discriminate between obstructive and restrictive lung disorders.16 Magnetic Resonance Imaging (MRI) can be used for detection of changes in the distal lung,17,18 but the technique is far too advanced and expensive to be employed in standard lung function testing. Therefore, cost-effective diagnosis techniques sensitive to early and small signs of damage or changes to the distal airspaces are needed.
Airspace Dimensions Assessment with nanoparticles (AiDA) is a novel method developed for quantification of distal airspaces by measurement of the deposition of inhaled nanoparticles.19,20 The method relies on the fact that inhaled nanoparticles reach the distal airspaces, where some of them deposit by diffusion, while the rest are exhaled. With AiDA the recovery of particles in exhaled air is measured with high accuracy.21 Analysis of AiDA data yields two variables: (1) a root-mean-square (rms) measure of the dimension of a collection of airspaces, referred to as the effective airspace radius, rAiDA, and (2) the extrapolated recovery at zero-second breath-hold, R0. While rAiDA reflects distal airspace dimensions, R0 is presumably related to particle losses during the dynamic process of breathing19,21,22 and lung heterogeneity.23
We have previously found that rAiDA agrees with distal airspace dimensions, and R0 correlates with lung heterogeneity, as quantified by MRI with inhaled hyperpolarized gas.23 We have shown that AiDA measurements can detect early emphysema as evaluated with pulmonary CT,24,25 and that AiDA data correlate with lung density as measured with standard pulmonary MRI.26 Based on these observations, we believe that AiDA has the potential to improve diagnosis of disease in the distal lung. AiDA is a cost-effective, non-invasive, and easy-to-use method, without radiation, that can be used stand-alone or combined with other pulmonary examination techniques.
The aim of this study is to explore the AiDA variables, rAiDA and R0, by comparing them to other pulmonary function measures. The measurements include spirometry, DLCO, CT and oscillometry measurements for a large group of subjects. This is the first study that aims to understand the relationship between R0 and other standard lung function variables. Measurements were performed in a population-based group from the Swedish CArdioPulmonary bioImage Study (SCAPIS). Parts of the AiDA data were published24 when we investigated the potential of AiDA as a biomarker for emphysema from the difference between rAiDA values in CT-justified emphysematous and non-emphysematous subjects. In the present study, we elaborate further and more broadly on the potential of AiDA in a clinical setting based on multivariate statistical analyses between AiDA variables and standardized lung function measurements. Here, we also introduce and discuss results on the AiDA extrapolated recovery at zero-second breath-hold index, R0, which have never been published before.
Materials and Methods
Study Population
The study was performed with a subset of participants in the multicenter population-based national CArdioPulmonary bioImage Study (SCAPIS),27 which is a collaboration between six Swedish universities (Gothenburg, Linköping, Malmö/Lund, Stockholm, Umeå and Uppsala). SCAPIS is initiated to identify risk factors of cardiovascular diseases and COPD, with enrolment of men and women aged 50–64 years from the Swedish population register. Enrolment took place by random selection. No exclusion criteria were applied except for the inability to understand written and spoken Swedish for informed consent. Of the 6251 participants recruited in Malmö, 744 participants were examined with AiDA. All participants answered a questionnaire (including questions about life-style, such as smoking habits) and took part in extensive physical examinations, lung function testing and imaging.27 Measurements were performed from 2014 to 2016. All participants gave written and informed consent. SCAPIS was approved by the Regional Ethical Review Board in Umeå (Dnr 2010–228-31M), Lund (2016/1031) and Linköping (2018/478-31) and complied with the Declaration of Helsinki.
AiDA Measurements
The AiDA setup used for particle deposition measurements has been described in detail elsewhere.21 Figure 1A shows a schematic illustration of the setup used to measure inhaled and exhaled aerosol particle concentrations. The nanoparticle aerosol was generated by aerosolizing 50 nm polystyrene latex nanospheres (PSL) using an electrospray aerosol generator (EAG) (Model 3480, TSI Inc., Shoreview, MN). A monodisperse aerosol was obtained by size-selecting the 50 nm particles with a differential mobility analyzer (DMA, Model 3071, TSI GmbH, Aachen, Germany). The aerosol was diluted with particle free air in a flexible antistatic reservoir. The inhalation system included a computer-controlled four-way valve, which directed the flow of aerosol to the mouthpiece and the sampling of exhaled aerosol into the sample collector, consisting of a 1-m-long metal tube with about 35 mm inner diameter. Inhaled and exhaled nanoparticle number concentrations were determined by a condensation particle counter (CPC), and particle losses in the system were characterized.
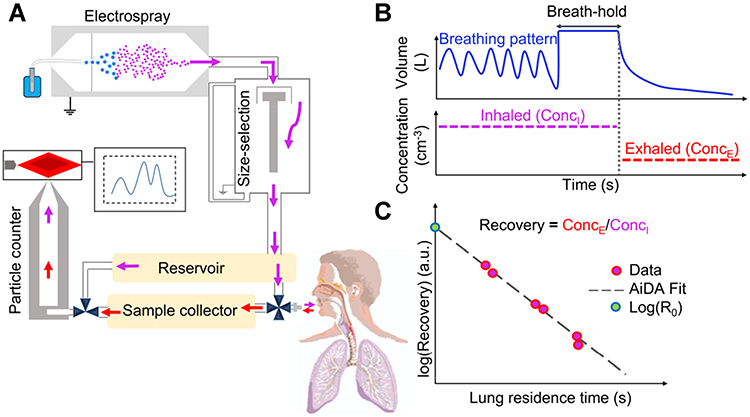 |
Figure 1 Schematic diagram of the AiDA setup, example output data and nanoparticle recovery as a function of lung residence time. (A) Nanoparticles were electrospray-generated, size-selected and transferred to the reservoir from which the particle concentration was measured. The inhaled and exhaled nanoparticle concentrations were quantified with the same CPC. (B) Diagrams of a recorded breathing pattern and measured particle concentrations. The breathing-pattern and the inhaled and exhaled particle concentrations were analyzed to determine particle residence time in the lungs and the fraction of recovered particles after exhalation at each residence time. (C) A linear-least squares line was fitted to the recovery as a function of lung residence time, from which rAiDA and R0 were determined. |
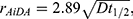
Precise measurement of monodispersed nanoparticle recovery from a predetermined lung depth of 1300 mL was measured for three different breath-hold times: 5, 7 and 10 seconds. The inhaled nanoparticle concentrations ranged between 1000 and 6000 cm−3, with an average inhaled concentration of 4600 cm−3. Nanoparticle residence time in the lungs was established from the breathing pattern and the fraction of recovered particles was determined from the inhaled and exhaled particle concentrations (see Figure 1B). The recovery of particles from the 1300 mL lung depth ranged between 0.7% and 65%, with a median value of 15% for all participants, depending on breath-hold. A linear least-squares regression line was fitted to the recovery as a function of residence time (see Figure 1C). R0 was estimated from extrapolation of the fit to zero-second residence time (green marker in Figure 1C) and rAiDA was established from the nanoparticle diffusion coefficient (D) and the half-life time ( ) of the inhaled nanoparticles (available from the slope of the fit), according to
as previously described.22 AiDA measurements depended, to some extent, on the skills of the testing personnel, just like standard PFT, CT evaluation and oscillometry measurements. To account for this, two measurements were performed for each breath-hold time.
For the 744 participants, measurements for 728 (346 M, 382 F) passed data quality checks such that the participant managed to do at least four AiDA breathing maneuvers, with no instrumental errors (eg leakages, incorrect measurement and quantification) detected and the inhaled particle concentration was stable (± 10%), and high enough (>1000 cm−3). For measurements passing data quality checks, data for 695 (328 M, 367 F) participants had a coefficient of determination value (r2) for the AiDA fit (Figure 1C) higher than 0.8, which was considered a good enough fit.
Pulmonary Function Testing
All pulmonary function measurements were performed in accordance with the American Thoracic Society (ATS) and European Respiratory Society (ERS) standards.28,29 Spirometry (Jaeger MasterScreen PFT, CareFusion, Hoechberg, Germany) was performed 15 minutes after bronchodilation using salbutamol with subjects in sitting position and wearing a nose clip. FEV1, slow vital capacity (SVC) and forced vital capacity (FVC) were obtained. DLCO was measured using a single-breath carbon monoxide diffusion test (Jaeger MasterScreen PFT). Oscillometry measurements were performed with an impulse oscillometry system (Jaeger MasterScreen IOS) according to Oostveen et al,16 with the exception that only one measurement was performed, which has been shown to be enough in studies with a large number of participants.30 Resistance at 5 Hz (R5) and 20 Hz (R20), reactance at 5 Hz (X5), the area of reactance (AX) and the resonant frequency (fres) were measured. The difference in resistance for 5 and 20 Hz was calculated (R5-R20).
CT Examination
Pulmonary CT was performed using a protocol with low radiation dose31 and interpreted by one of the four radiologists. The measurements were obtained according to the European Respiratory Society (ERS) standards.28 CT-derived total lung capacity by volumetric CT (VOL) was calculated, along with quantification of the 15th percentile density (PD15), defined as the value (in Hounsfield Units) below which 15% of voxels with the lowest density are distributed. The percentage of low attenuation volume (LAV), corresponding to a density measurement of the lung parenchyma was determined.
Statistical Analysis
AiDA variables were compared to spirometry values VC, FEV1, and their ratio (FEV1/VC), DLCO, IOS variables R5, R5-R20, X5, AX, fres and CT variables Vol, LAV and PD15. The relationship between AiDA variables and all other measures were explored with correlation analysis, linear regression with adjustment to age and height, and principal components analysis. A P-value <0.05 was considered significant. Calculations were performed using MATLAB Version 2020a (The MathWorks, Inc., Natick, Massachusetts, United States) and Python 3.6.12 (Python Software Foundation).
Results
AiDA measurements, anthropometric data and lung function examination results are shown in Table 1, for the study population of 695 participants that passed all data quality checks. The distal airspace radius, rAiDA, and zero-seconds recovery, R0, were within limits of previously measured values.23,24,26 About half of all the participants, 359 participants (52%), reported pack-years (1 pack-years = 20 cigarettes smoked per day for one year), above zero. A low number of the participants, 87 individuals (12.5%) had FEV1/VC <0.7, which is the GOLD criteria for airway obstruction and COPD. Within the study population, 56 individuals (8%) had mild-to-moderate emphysema as visually detected with CT, which was further investigated in another study.24 Table A1 in the Supplement presents subject demographics and lung examination results for non-smokers (Packyears = 0), smokers (Packyears >0), men and women, respectively. These data show that some indices vary significantly between groups, for instance rAiDA is slightly higher for men than for women (P < 0.01) and higher in smokers than non-smokers (P < 0.05). However, Table A1 shows that the study population was rather homogeneous. Figure 2 displays the rAiDA and R0 distributions for the whole study population. According to the Kolmogorov–Smirnov normality test, both the rAiDA and R0 distributions deviated from normal distributions. However, the R0 distribution approached a normal distribution in Figure 2, which was also seen when studying the norm–norm plot produced for R0, and the small difference between its mean and median values.
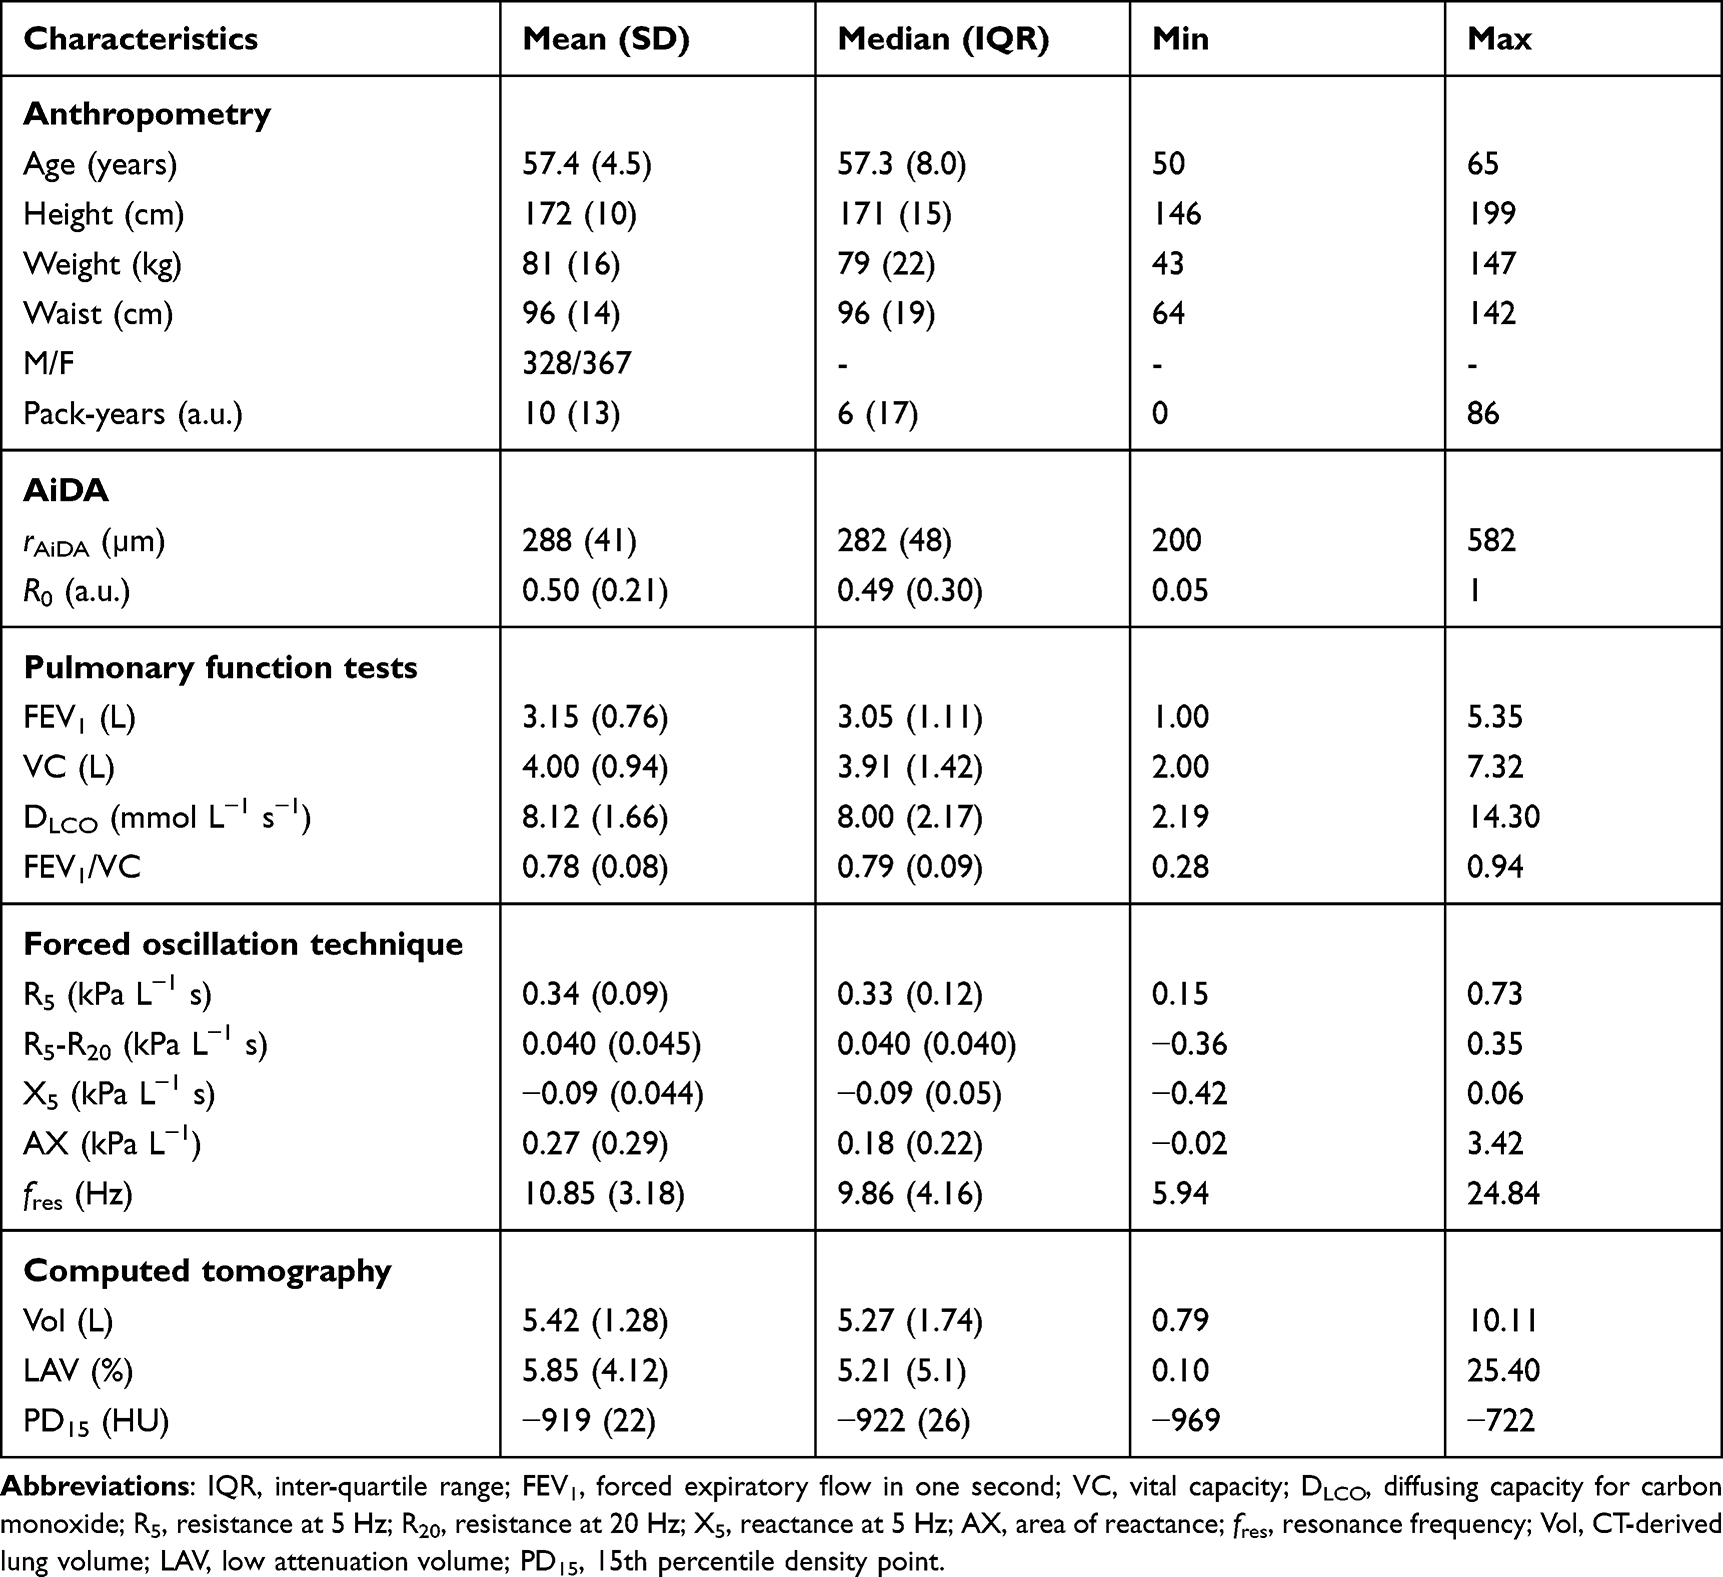 |
Table 1 Subject Demographics, Anthropometric Data, AiDA Measurements and Other Lung Function Examination Results. Mean, Median, Standard Deviations and Inter Quartile Range (the Difference Between Quartile 3 and Quartile 1), for the Study Population are Presented |
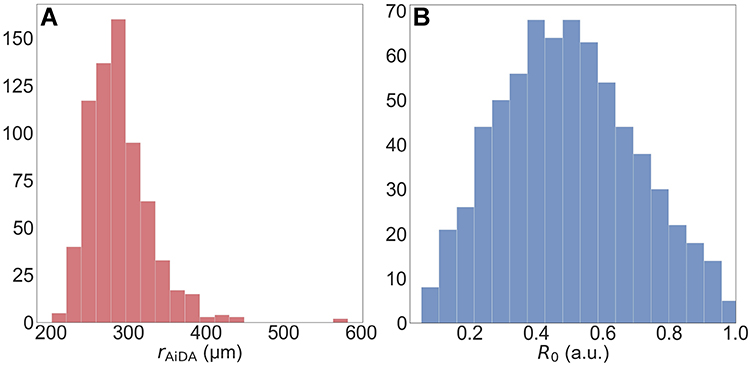 |
Figure 2 The rAiDA and R0 distributions for the 695 participants. (A) The rAiDA distribution is skewed, largely due to the outliers at rAiDA >400. Note that one participant had an rAiDA value close to 600 µm. (B) The R0 distribution approached a normal distribution with a mean recovery of 50% at an imaginary zero seconds breath-hold. |
Table 2 displays Spearman’s rank correlation coefficients for AiDA variables, the anthropometric data, age, and pack-years. The airspace radius, rAiDA, was significantly positively associated with age, height, and pack-years, while the zero-second recovery index, R0, was associated with weight, height and pack-years, but correlation coefficients were low.
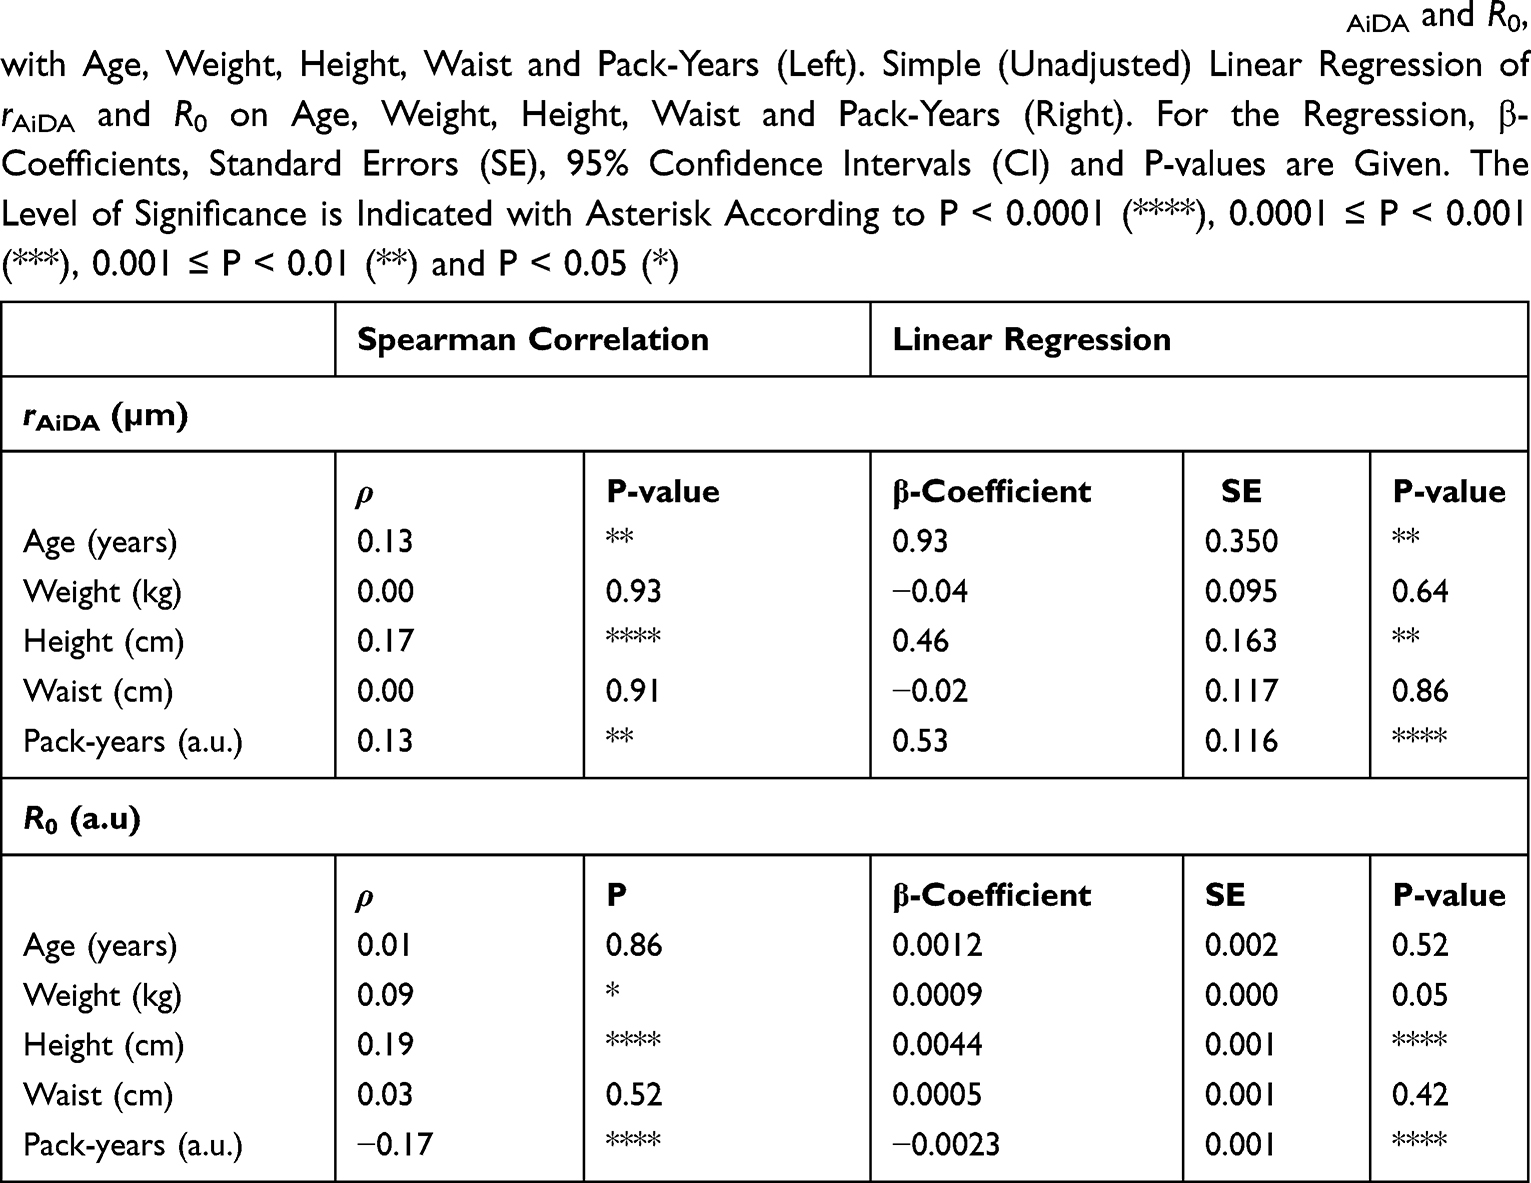 |
Table 2 Spearman’s Rank Coefficient (ρ) with Associated P-values, for AiDA Variables rAiDA and R0, with Age, Weight, Height, Waist and Pack-Years (Left). Simple (Unadjusted) Linear Regression of rAiDA and R0 on Age, Weight, Height, Waist and Pack-Years (Right). For the Regression, β-Coefficients, Standard Errors (SE), 95% Confidence Intervals (CI) and P-values are Given. The Level of Significance is Indicated with Asterisk According to P < 0.0001 (****), 0.0001 ≤ P < 0.001 (***), 0.001 ≤ P < 0.01 (**) and P < 0.05 (*) |
Table 3 demonstrates correlations between AiDA variables, rAiDA and R0, and all other lung function indices by Spearman’s rank coefficient (ρ) and linear regression models with associated P-values. The linear regression has been adjusted for age and height. The AiDA variables were significantly correlated with several lung function measurements, but all correlations were associated with low correlation coefficients, ie lower than |0.3|. The overall strongest associations were seen between rAiDA and the CT LAV measure (ρ = 0.22, P < 0.0001) and between R0 and FEV1 (ρ = 0.3, P < 0.0001). AiDA variables were found to be significantly (P < 0.01) dependent on sex, with men prone to have slightly higher rAiDA and R0 compared to women (see Table A1 in the supplemental material), as assessed with Student’s t-test. However, the differences based on sex were numerically minimal (mean rAiDA of 290 39 µm, mean R0 of 0.52
  0.19 for men, and mean rAiDA of 284
  42 µm, R0 of 0.47
  21 for women), and were therefore not adjusted for in the linear regression analyses performed.
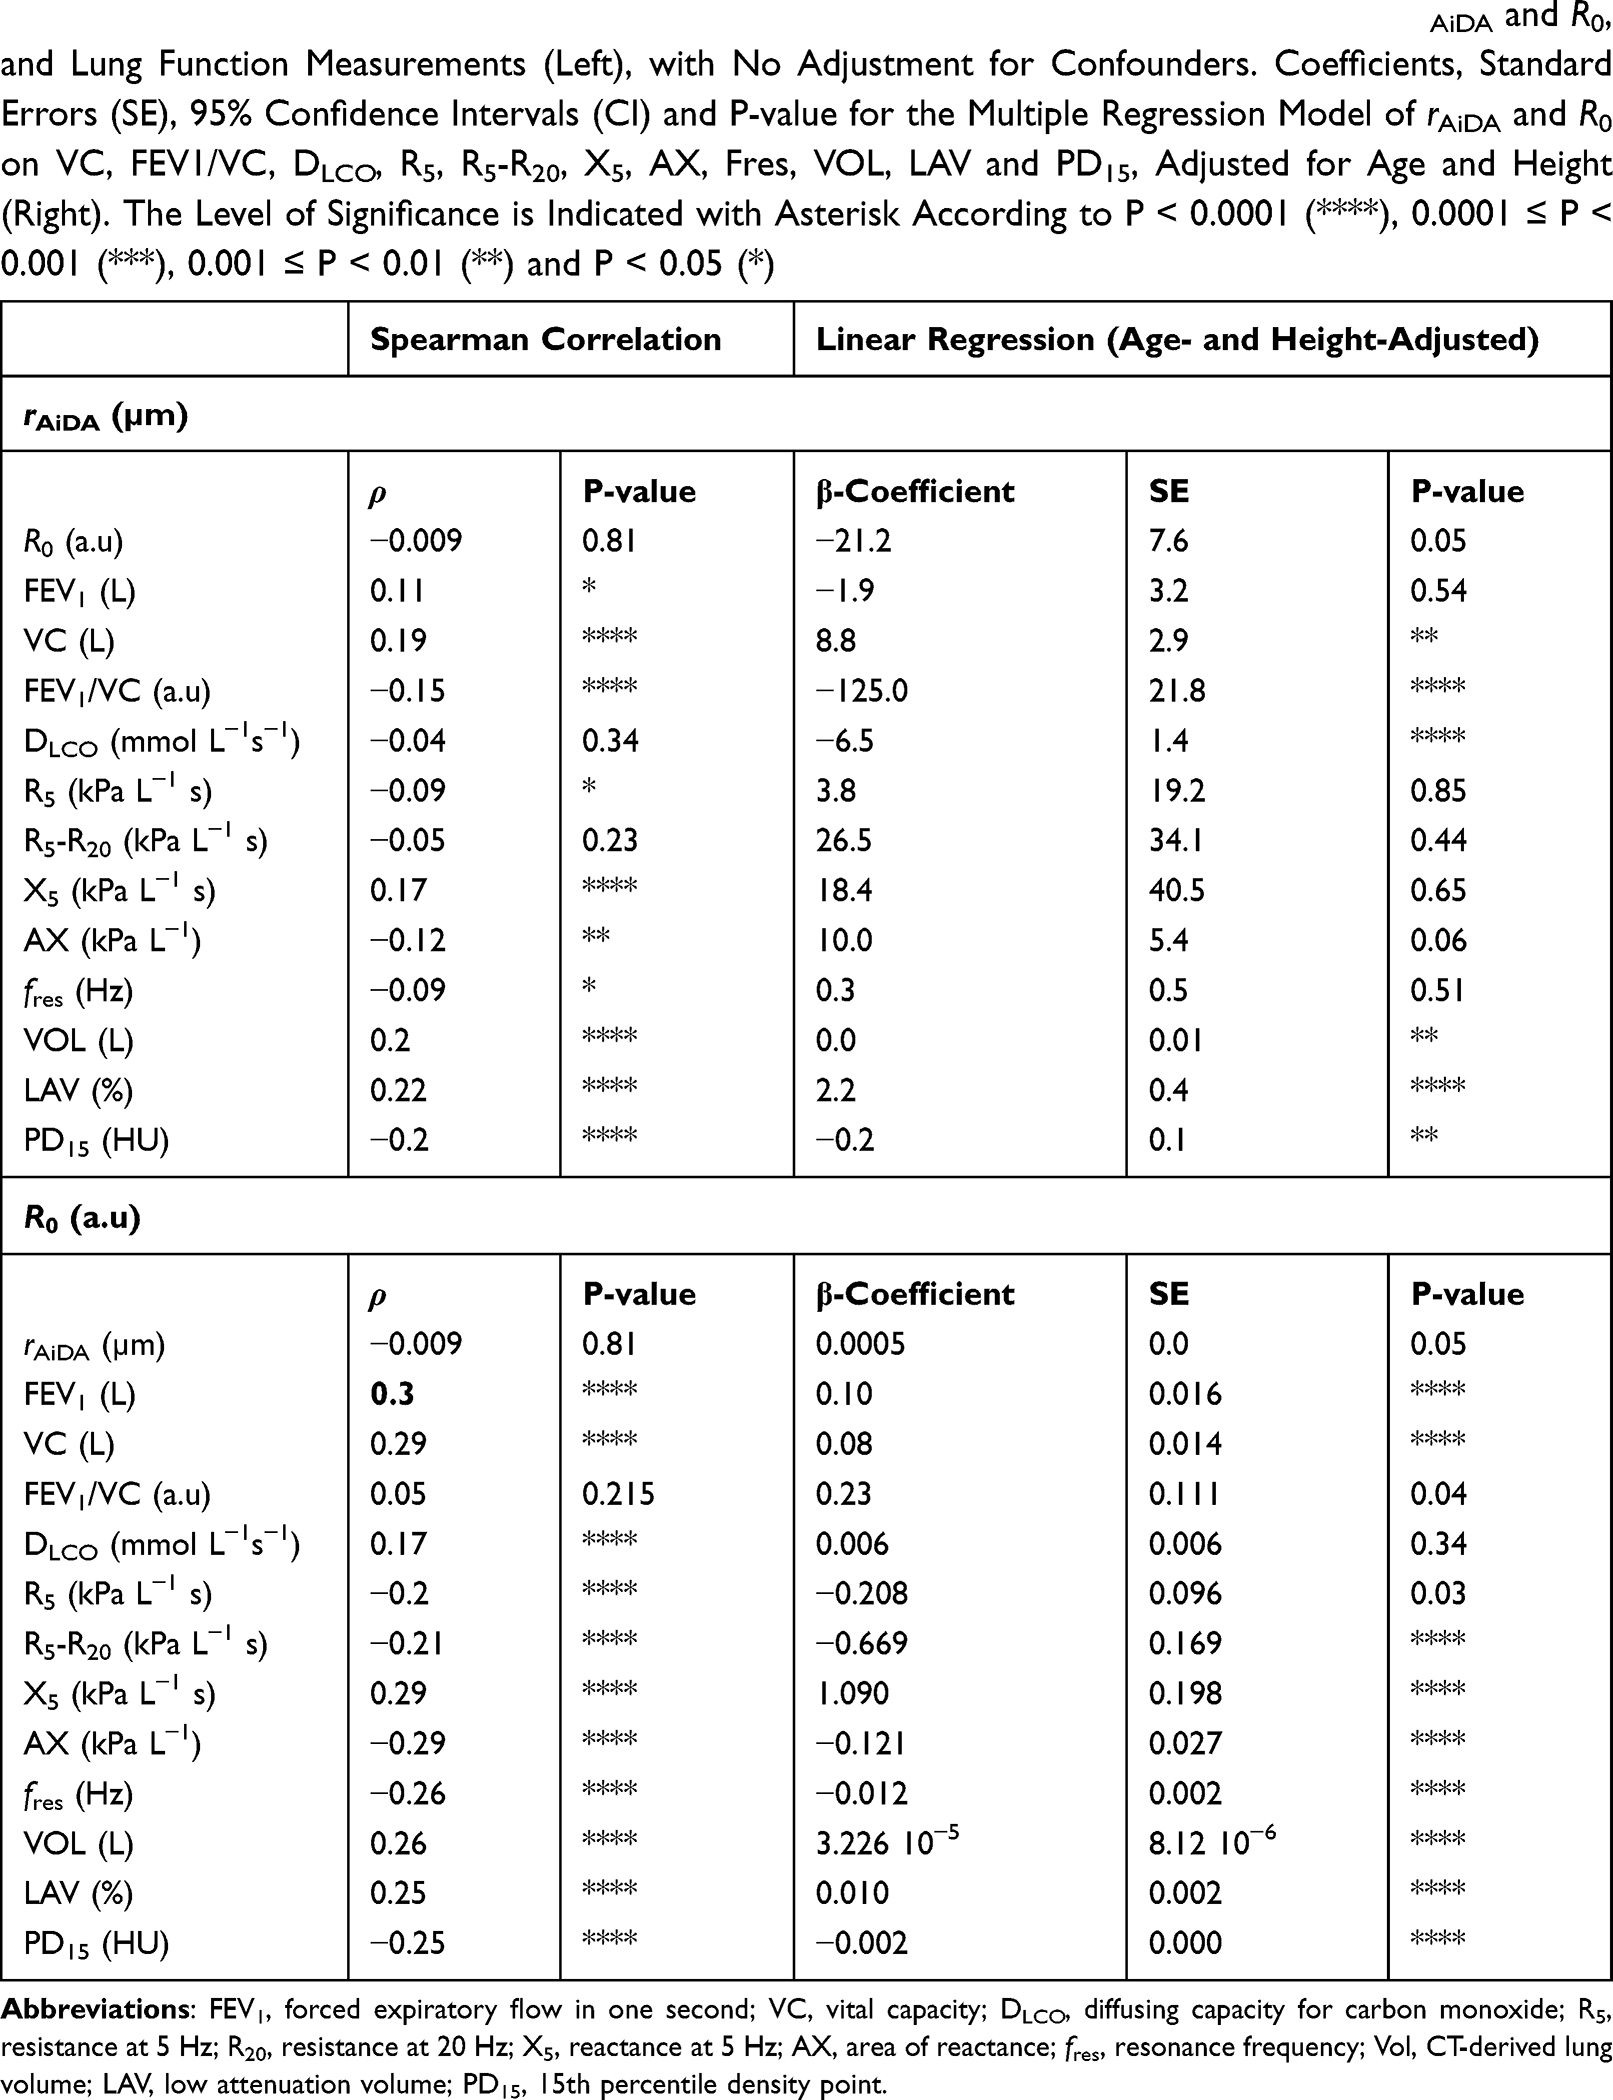 |
Table 3 Spearman’s Rank Coefficient (ρ) with Associated P-values, Between AiDA Variables rAiDA and R0, and Lung Function Measurements (Left), with No Adjustment for Confounders. Coefficients, Standard Errors (SE), 95% Confidence Intervals (CI) and P-value for the Multiple Regression Model of rAiDA and R0 on VC, FEV1/VC, DLCO, R5, R5-R20, X5, AX, Fres, VOL, LAV and PD15, Adjusted for Age and Height (Right). The Level of Significance is Indicated with Asterisk According to P < 0.0001 (****), 0.0001 ≤ P < 0.001 (***), 0.001 ≤ P < 0.01 (**) and P < 0.05 (*) |
Principal components analysis (PCA) of the lung function data, including rAiDA and R0 variables, yielded the first five PCs to explain 83% of the variance in the data. The explained variance per PC is illustrated in Figure 3. Each PC is constructed as a linear combination of the original variables in the data, to maximize the variance explained for each PC. The first five PCs explained 39%, 20%, 10%, 8% and 6%, of the full data variance, respectively. The principal component coefficient loadings are shown as a heat map in Figure 4. The loadings indicate how much each lung function variable contributes (on a scale from −1 to 1) to each PC. Here, a more saturated color indicates a higher contribution to the respective PC. The heat map shows that PC1 was constructed mainly from spirometry measures (FEV1, VC), DLCO, IOS variables (R5, R5- R20, X5, AX, fres) and lung volume measured with CT (VOL). PC2 was constructed mainly from FEV1/VC, R5-R20, X5, AX, fres, and CT indices VOL, LAV and PD15. PC3 was mainly constructed from FEV1, DLCO and R5-R20. It can be noted that the contributions from AiDA to the first three PCs were negligible, which indicates that the AiDA variables did not contribute much to the variance explained by these first three PCs. The main contributors to PC4 and PC5 were the AiDA variables (indicated by the darker colors in the heat map in Figure 4). All other variables contributed negligibly to PC4 and PC5.
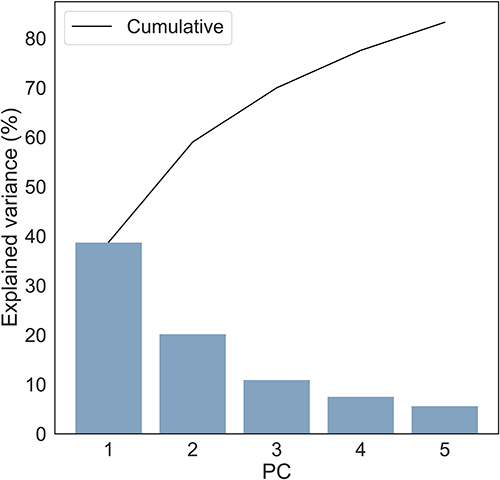 |
Figure 3 Explained variance per PC. The black line marks the cumulative explained variance while the bars show the explained variance per PC. Together the first five PCs explained 83% of the variance in the data, with each PC explaining 39%, 20%, 10%, 8% and 6% respectively, in descending order. |
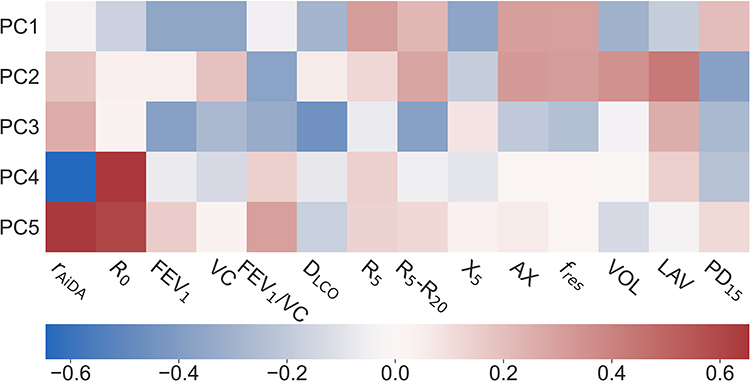 |
Figure 4 Heat map on the principal component factor loading for the first five PCs. The heatmap shows that the AiDA variables are not important components of the first two PCs, rAiDA is important for PC3, and rAiDA and R0 are the dominating contributors to PC4 and PC5, with relatively low contributions from all other lung function variables. The variance in the data explained by PC4 and PC5 (14% of the variance in the data) is mainly explained by the AiDA variables. |
Discussion
This study displays the lack of fundamentally strong relationships between AiDA and established lung function examinations in a generally healthy study population. The results show that the lung properties measured with AiDA, the effective airspace radius, rAiDA, and the extrapolated recovery at zero-second breath-hold, R0, cannot be assessed with conventional pulmonary function tests.
The radius measured with AiDA, rAiDA, is a root mean square (rms) estimate of the diffusional distance that inhaled nanoparticles traverse to reach the airspace walls. The rAiDA values here measured ranged from 200 to 582 µm with a mean value of 288 µm. These estimated airspace dimensions correspond well with cast models predicting the inner diameter of distal airspaces to be between 270 and 500 µm, depending on airway generation, and an alveolar sac diameter of about 250 µm, independent of generation.32,33 These measures also agree with Weibel’s lung model that has a diameter of 410 µm for the 23rd generation of the respiratory system, where the alveoli are located.32
The association between rAiDA and the other lung function measures shown in Table 3 were in line with expectations. A negative association was found for rAiDA with FEV1/VC. A low FEV1/VC ratio is the GOLD criteria for diagnosis of COPD, which often includes some degree of emphysema. Since emphysema enlarges distal airspace, rAiDA increases with decreasing FEV1/VC. The strongest associations observed for rAiDA were found for the CT indices. The effective airspace radius, rAiDA, was found to be positively correlated with the lung volume measured with CT (VOL). A positive association was also found for rAiDA and LAV. A high LAV means a larger volume with less dense lung tissue and hence larger airspaces and thus a higher rAiDA. The association between LAV and rAiDA indicates that AiDA is at least partly related to the region of the lung with low attenuation volume. A negative association between rAiDA and PD15 was found, which means that a higher 15th percentile density is associated with a lower rAiDA value. This is logical, as a higher density means more lung tissue and smaller airspaces. According to Spearman’s rank coefficient rAiDA was associated with R5, X5, AX and fres, but when assessing these relationships with linear regression with adjustment for age and height none of the relationships were significant.
The physiological information contained in R0 still remains to be further investigated. R0 presumably reflects a nanoparticle–lung interaction effect from the breathing phase of the AiDA measurements. Conceptually, R0 corresponds to a measure of the recovery of aerosol particles from the deep lung at zero-seconds breath-hold. As such, R0 is attributed to estimate the particle losses in the small conducting airways (<2 mm). Hence, R0 is presumably related to small airways, but not to the most distal airspaces.
The relationships between R0 and IOS indices show that R0 is related to airway calibre and lung heterogeneity. According to the theory of oscillometry the resistance, Rrs reflect airway calibre, where narrower and longer airways have higher resistance due to greater frictional pressure loss in them. The reactance, Xrs, is related to stiffness of the entire respiratory system and to lung heterogeneity, governed by the product of resistance and compliance.13 When heterogeneity increases, the stiffness and hence Xrs decreases. The results underline the relationship already found between R0 and lung heterogeneity, as assessed with MRI with hyperpolarized gas.23
It cannot be assumed that all lung physiological variables correlate linearly with one another. With the analysis performed, it was our intention to show the general associations between variables. With Spearman’s rank coefficient we studied the degree of association without assuming linearity, and linearity was explored, over all ranges for all variables, using linear regression. It is plausible that some of the variables were only partly linearly correlated, but this was not visible in the linear regression analysis here performed.
Since the rAiDA distribution was skewed, as seen in Figure 2, we also log-transformed rAiDA in the correlation and regression analysis for rAiDA compared with other lung physiology indices. This resulted in similar associations as presented in Tables 2 and 3. However, the significance of the relationship of rAiDA with PD15 increased when rAiDA was log-transformed.
The study population was randomly selected from the Swedish population register and most subjects were healthy, with only a few subjects with mild-to-moderate lung disease. We studied subjects with mild-to-moderate emphysema as diagnosed with CT in another publication.24 The narrow age range (50–64 years) limits conclusions about the relationship between AiDA variables and possible age-dependencies. The effective airspace radius, rAiDA, was very weakly associated with age (P < 0.01), height (P < 0.01) and pack-years (P < 0.01), both according to Spearman’s rank coefficient and the linear regressions. For a variable that describes the size of distal airspaces these associations are expected. Airspace size is age-dependent,34 lung volume depends on height, and pack-years are related to alterations of both bronchi and peripheral airspaces. However, for all correlations found, coefficients were low. R0 was somewhat associated with height (P < 0.0001) and pack-years (P < 0.0001), which underlines the potential association between R0 and lung properties.
In line with the results of the correlation analysis, the PCA showed that the AiDA variables did not explain the same variance in the data as the other lung function measurements. These results indicate that the AiDA method stands out among the lung function measurement techniques and that AiDA probes qualities of the deep lung that are not measurable by other means.
In a previous study,23 we showed that rAiDA quantified distal airspace dimensions and that rAiDA corresponded well with distal lung dimensions assessed with hyperpolarized gas MRI. In the same study, we also observed that R0 corresponded to the lung heterogeneity measured with that same technique. Since no close correspondence with other lung function parameters was found in the current study, we conclude that the method so far most closely related to AiDA is the more advanced hyperpolarized gas MRI method. Hyperpolarized gas MRI is, however, primarily available in research and only exists in few places around the world.
The measured AiDA variables are in accordance with those found in previous AiDA studies.23,24,26 Closely related methods include the technique referred to as Aerosol-Derived Airway Morphometry (ADAM).35,36 While certain versions of the ADAM method resemble AiDA, the main difference between the two techniques is that ADAM uses larger particles, typically 0.8–1 µm in diameter and that the ADAM method requires a controlled low breathing flow (typically about 250 mL/s). Therefore, in contrast to AiDA, where the particle deposition is dominated by diffusional deposition, for ADAM most particles presumably deposit by sedimentation. Due to the different physics of diffusion and sedimentation, the relationship between peripheral airspace dimensions and measured particle deposition differs. ADAM gives an effective airway diameter (EAD), which is related to rAiDA, although deviating as it is a geometrical mean value. ADAM measurement of EAD presumably reflects larger airways, while rAiDA is associated with more distal airspaces. Studies with ADAM have not reported on a measure corresponding to R0.36
The data here presented indicate that AiDA has the potential to evaluate the occurrence of distal airspace abnormalities by measurement of rAiDA. Since AiDA is non-invasive it could potentially be used with the purpose of facilitating early detection of distal airspace abnormalities, such as early emphysema.
The AiDA indices, rAiDA and R0, provide data that complement more traditional lung function measurements, such as spirometry, lung volumes, specific conductance, and diffusing capacity. Therefore, AiDA could become an adjunct to spirometry, for detection of abnormalities in the distal lung which may be undetected by spirometry. AiDA allows the estimation of distal airspace dimensions with high accuracy and reproducibility19,21 and AiDA is important since more traditional lung function tests are not sensitive to detect early changes in distal airspaces. Early detection of abnormalities in the distal lung can prevent the occurrence of obstructive ventilator impairment if medical treatment, smoke cessation or other lifestyle changes can be implemented. While one measurement per breath-hold is enough to derive the recovery, since AiDA is still under development, two measurements are made for each breath-hold. The AiDA measurement maneuver is easy to perform and very similar to that of DLCO measurements. AiDA is less exhausting for patients than spirometry but could still be challenging for someone with severe lung disease. Personnel working in pulmonary healthcare can be trained to perform these types of measurements within a few days.
One strength of this study is that the study group is population based. As such, the representative sample is largely healthy, and only has a low prevalence of serious lung diseases. On the downside, the population-based participants make it hard to draw conclusions on the potential of AiDA to identify and detect lung disease in this study, since specific AiDA values cannot clearly be paired with specific states of disease. In addition to AiDA, the study included an extensive protocol of measurements, with spirometry, DLCO, IOS and CT. However, in addition to the dynamic spirometry, it would have been ideal to also measure static lung volumes.
Due to the novelty of the AiDA method, we had several instrumental problems at the beginning of the study. The proportion of measurements not fulfilling the technical criteria, 49 out of 744 participants, can be explained by several factors. These include insufficient data quality checks at the time of measurements, the difficulty for some participants to perform the breathing maneuver and technical difficulties with the instrument. Technical errors that generated faulty measurement data include insufficient particle concentrations generated with the EAG, leakage through the nanoparticle reservoir and air entering the system through the mouthpiece.
For measurements of the distal airspaces, AiDA requires hydrophobic nanoparticles (diameters <100 nm). Diffusion is faster for smaller particles. Therefore, for particles with diameters <50 nm, a large fraction of the particles deposit in the upper airways. To avoid too large particle losses in the upper airways, 50 nm particles were chosen. The particles need to be hydrophobic, so they do not grow by condensation due to the high relative humidity close to 99.5% in the lungs.37 Once a nanoparticle reaches an airspace wall, it deposits without bouncing.
The dose of nanoparticles delivered to the lung with AiDA is low. Most people are routinely exposed to much higher average nanoparticle concentrations in urban settings.38,39 With AiDA, subjects inhale a low predefined controlled aerosol nanoparticle concentration for a short time. Before and after the inhalation of nanoparticles, subjects breathe particle-free clean air to minimize the aerosol concentration in the lungs. Therefore, the total cumulative dose of aerosol nanoparticles delivered to lung tissue is lower with AiDA than for exposure for the same duration in a typical indoor office environment.
The polystyrene latex (PSL) nanoparticles used with AiDA are well characterized. PSL particles have been used extensively to study translocation, clearance, and ventilation in both human and animal lungs.40–45 These, and similar studies with other types of particles,46,47 show that the translocation of nanoparticles to other organs is very limited for particles in the range 40–100 nm. In-vitro studies with human lung cells exposed to PSL particles showed indistinguishable effects from controls.48 Based on the low concentrations used in AiDA, we appraise the risks associated with exposure during AiDA measurements to be negligible.
Future research is needed to understand the diagnostic accuracy, sensitivity, and specificity of AiDA. AiDA measurements in groups with varying ages and varying lung function, including studies with patients who have been diagnosed with pulmonary diseases, are needed to further study the potential of AiDA as a diagnostic tool.
Conclusions
In this work, the AiDA method has been measured in a large national cohort. AiDA variables have been evaluated against other lung function metrics including spirometry, DLCO, pulmonary CT and IOS. The primary aim of this study was to investigate the relationship between AiDA measures, rAiDA and R0, and other pulmonary function tests. This study indicates that AiDA measurements are weakly associated with lung function variables derived from spirometry, DLCO, IOS and pulmonary CT, but also with age and height. In conclusion, the study shows that, in contrast to conventional lung function techniques, AiDA assesses properties that are not accessible by conventional lung function measurements.
Abbreviations
AiDA, Airspace Dimension Assessment with nanoparticles; rAiDA, effective airspace radius; R0, zero-second breath-hold; SCAPIS, Swedish CArdioPulmonary bioImage Study; COPD, chronic obstructive pulmonary disease; FEV1, forced expiratory volume in one second; VC, vital capacity; PFTs, pulmonary function tests; DLCO, diffusing capacity of carbon monoxide; CT, computed tomography; LAV, low attenuation volumes; Rrs, respiratory resistance; Xrs, respiratory reactance; MRI, Magnetic resonance imaging; AX, area of reactance; fres, resonant frequency; PD15, 15th percentile density.
Data Sharing Statement
The data generated and/or analyzed in this study can be made available to researchers by the corresponding author upon request but will be subject to a review of secrecy and require an approved ethical application.
Ethics Approval and Informed Consent
The study was approved by the regional ethical review board in Umeå (Dnr 2010-228-31M), Lund (2016/1031), and Linköping (2018/478-31). All participants gave written and informed consent. The consent was obtained prior to the study commencement.
Acknowledgments
The authors would like to acknowledge and thank Per-Erik Isberg for taking the time to discuss the statistical analysis and provide valuable input on it.
Author Contributions
All authors made significant contributions to the work reported in the form of either conception, study design and/or data acquisition. All authors have substantially revised and critically reviewed the article, have agreed on the journal to which the article is submitted and have reviewed and agreed on all versions of the article before submission. All authors agree to be accountable for all aspects of the work.
Funding
Open access funding provided by Lund University. This work was supported by the Swedish Heart and Lung foundation (Grant No 2017-0644, Grant No 2018-0483 and Grant No 2020-0855), the Swedish Research Council for Health, Working Life and Welfare (Grant No 2017-00690), Swedish Research Council for Environmental, Agricultural Sciences and Spatial Planning, FORMAS (Grant No: 2018-00693), NanoLund, and The Swedish Research Council, VR (Grant No 2021-03265). The main funding body of The Swedish CArdioPulmonary bioImage Study (SCAPIS) is the Swedish Heart-Lung Foundation. The study is also funded by the Knut and Alice Wallenberg Foundation, the Swedish Research Council and VINNOVA (Sweden’s Innovation agency) the University of Gothenburg and Sahlgrenska University Hospital, Karolinska Institutet and Stockholm County council, Linköping University and University Hospital, Lund University and Skåne University Hospital, Umeå University and University Hospital, Uppsala University and University Hospital.
Disclosure
Per Wollmer reports grants from Swedish Heart and Lung foundation, grants from EuroNanomed II, grants from Swedish Innovation Agency, grants from Swedish Research Council, during the conduct of the study; personal fees from GlaxoSmithKline, personal fees from Chiesi Pharma, outside the submitted work; In addition, Professor Per Wollmer has a patent Device and method for pulmonary function measurement issued; Jakob Löndahl reports grants from Swedish Heart and Lung foundation, grants from Swedish Research Council for Health, Working Life and Welfare, grants from Swedish Research Council for Environmental, Agricultural Sciences and Spatial Planning, FORMAS, during the conduct of the study; In addition, Jakob Löndahl has a patent Device and Method for pulmonary function measurement issued. The other authors declare no competing interests.
References
1. Soriano JB, Kendrick PJ, Paulson KR, et al. Prevalence and attributable health burden of chronic respiratory diseases, 1990–2017: a systematic analysis for the global burden of disease study 2017. Lancet Respir Med. 2020;8(6):585–596. doi:10.1016/S2213-2600(20)30105-3
2. Mathers CD, Loncar D. Projections of global mortality and burden of disease from 2002 to 2030. PLoS Med. 2006;3(11):e442. doi:10.1371/journal.pmed.0030442
3. Asia Pacific CRG. Global initiative for chronic obstructive lung disease strategy for the diagnosis, management and prevention of chronic obstructive pulmonary disease: an Asia-Pacific perspective. Respirology. 2005;10(1):9–17. doi:10.1111/j.1440-1843.2005.00692.x
4. Tan WC. The global initiative for chronic obstructive lung disease: gold standards and the Asia-Pacific perspective. Respirology. 2002;7(1):1–2. doi:10.1046/j.1440-1843.2002.00371.x
5. Dai Z, Ma Y, Zhan Z, Chen P, Chen Y. Analysis of diagnostic delay and its influencing factors in patients with chronic obstructive pulmonary disease: a cross-sectional study. Sci Rep. 2021;11(1):14213. doi:10.1038/s41598-021-93499-9
6. Walters JA, Walters EH, Nelson M, et al. Factors associated with misdiagnosis of COPD in primary care. Prim Care Respir J. 2011;20(4):396–402. doi:10.4104/pcrj.2011.00039
7. Johns DP, Walters JAE, Walters EH. Diagnosis and early detection of COPD using spirometry. J Thorac Dis. 2014;6(11):1557–1569. doi:10.3978/j.issn.2072-1439.2014.08.18
8. McLean A, Warren PM, Gillooly M, MacNee W, Lamb D. Microscopic and macroscopic measurements of emphysema: relation to carbon monoxide gas transfer. Thorax. 1992;47(3):144–149. doi:10.1136/thx.47.3.144
9. Madani A, Zanen J, Maertelaer V, Gevenois PA. Pulmonary emphysema: objective quantification at multi–detector row CT—comparison with macroscopic and microscopic morphometry. Radiology. 2006;238(3):1036–1043. doi:10.1148/radiol.2382042196
10. Marrades RM, Diaz O, Roca J, et al. Adjustment of DLCO for hemoglobin concentration. Am J Respir Crit Care Med. 1997;155(1):236–241. doi:10.1164/ajrccm.155.1.9001318
11. den Harder AM, de Boer E, Lagerweij SJ, et al. Emphysema quantification using chest CT: influence of radiation dose reduction and reconstruction technique. Eur Radiol Exp. 2018;2(1):30. doi:10.1186/s41747-018-0064-3
12. Goldman MD. Clinical application of forced oscillation. Pulm Pharmacol Ther. 2001;14(5):341–350. doi:10.1006/pupt.2001.0310
13. King GG, Bates J, Berger KI, et al. Technical standards for respiratory oscillometry. Eur Respir J. 2020;55(2):1900753. doi:10.1183/13993003.00753-2019
14. Nikkhah M, Amra B, Eshaghian A, et al. Comparison of impulse oscillometry system and spirometry for diagnosis of obstructive lung disorders. Tanaffos. 2011;10(1):19–25.
15. Frantz S, Nihlén U, Dencker M, Engström G, Löfdahl CG, Wollmer P. Impulse oscillometry may be of value in detecting early manifestations of COPD. Respir Med. 2012;106(8):1116–1123. doi:10.1016/j.rmed.2012.04.010
16. Oostveen E, MacLeod D, Lorino H, et al. The forced oscillation technique in clinical practice: methodology, recommendations and future developments. Eur Respir J. 2003;22(6):1026–1041. doi:10.1183/09031936.03.00089403
17. Saam BT, Yablonskiy DA, Kodibagkar VD, et al. MR imaging of diffusion of (3) He gas in healthy and diseased lungs. Magn Reson Med. 2000;44(2):174–179. doi:10.1002/1522-2594(200008)44:2<174::
18. Kaushik SS, Cleveland ZI, Cofer GP, et al. Diffusion-weighted hyperpolarized 129Xe MRI in healthy volunteers and subjects with chronic obstructive pulmonary disease. Magn Reson Med. 2011;65(4):1154–1165. doi:10.1002/mrm.22697
19. Jakobsson J, Wollmer P, Löndahl J. Charting the human respiratory tract with airborne nanoparticles: evaluation of the airspace dimension assessment technique. BMC J Appl Physiol. 2018;125(6):1832–1840. doi:10.1152/japplphysiol.00410.2018
20. Jakobsson JK, Aaltonen HL, Nicklasson H, et al. Altered deposition of inhaled nanoparticles in subjects with chronic obstructive pulmonary disease. BMC Pulm Med. 2018;18(1):129. doi:10.1186/s12890-018-0697-2
21. Jakobsson JKF, Hedlund J, Kumlin J, Wollmer P, Löndahl J. A new method for measuring lung deposition efficiency of airborne nanoparticles in a single breath. Article. Sci Rep. 2016;6:36147. doi:10.1038/srep36147
22. Londahl J, Jakobsson JKF, Broday DM, Aaltonen HL, Wollmer P. Do nanoparticles provide a new opportunity for diagnosis of distal airspace disease? Int J Nanomed. 2017;12:41–51. doi:10.2147/Ijn.S121369
23. Petersson-Sjögren M, Chan H-F, Collier GJ, et al. Airspace Dimension Assessment (AiDA) by inhaled nanoparticles: benchmarking with hyperpolarised 129Xe diffusion-weighted lung MRI. Sci Rep. 2021;11(1):4721. doi:10.1038/s41598-021-83975-7
24. Aaltonen HL, Petersson Sjögren M, Jakobsson JKF, et al. Airspace dimension assessment with nanoparticles as a proposed biomarker for emphysema. Thorax. 2021;76:1040–1043. doi:10.1136/thoraxjnl-2020-214523
25. Aaltonen H, Jakobsson J, Diaz S, et al. Deposition of inhaled nanoparticles is reduced in subjects with COPD and correlates with the extent of emphysema: proof of concept for a novel diagnostic technique. Clin Physiol Funct Imaging. 2018;38(6):1008–1014. doi:10.1111/cpf.12517
26. Aaltonen HL, Kindvall SS, Jakobsson JK, et al. Airspace dimension assessment with nanoparticles reflects lung density as quantified by MRI. Int J Nanomed. 2018;13:2989. doi:10.2147/IJN.S160331
27. Bergström G, Berglund G, Blomberg A, et al. The Swedish CArdioPulmonary bioimage study: objectives and design. J Intern Med. 2015;278(6):645–659. doi:10.1111/joim.12384
28. Miller MR, Crapo R, Hankinson J, et al. General considerations for lung function testing. Eur Respir J. 2005;26(1):153–161. doi:10.1183/09031936.05.00034505
29. Miller MR, Hankinson J, Brusasco V, et al. Standardisation of spirometry. Eur Respir J. 2005;26(2):319–338. doi:10.1183/09031936.05.00034805
30. Wollmer P, Tufvesson E, Wennersten A, et al. Within-session reproducibility of forced oscillometry. Clin Physiol Funct Imaging. 2021;41(5):401–407. doi:10.1111/cpf.12706
31. Wang R, Sui X, Schoepf UJ, et al. Ultralow-radiation-dose chest CT: accuracy for lung densitometry and emphysema detection. AJR Am J Roentgenol. 2015;204(4):743–749. doi:10.2214/ajr.14.13101
32. Weibel ER, Sapoval B, Filoche M. Design of peripheral airways for efficient gas exchange. Respir Physiol Neurobiol. 2005;148(1–2):3–21. doi:10.1016/j.resp.2005.03.005
33. Haefeli-Bleuer B, Weibel ER. Morphometry of the human pulmonary acinus. Anat Rec. 1988;220(4):401–414. doi:10.1002/ar.1092200410
34. Gillooly M, Lamb D. Airspace size in lungs of lifelong non-smokers: effect of age and sex. Thorax. 1993;48(1):39–43. doi:10.1136/thx.48.1.39
35. Lehnigk B, Schleiss M, Brand P, Heyder J, Magnussen H, Jorres RA. Aerosol-derived airway morphometry (ADAM) in patients with lung emphysema diagnosed by computed tomography–reproducibility, diagnostic information and modelling. Eur J Med Res. 2007;12(2):74–83.
36. Brand P, Rieger C, Beinert T, Heyder J. Aerosol derived airway morphometry in healthy subjects. Eur Respir J. 1995;8(10):1639–1646. doi:10.1183/09031936.95.08101639
37. Löndahl J, Möller W, Pagels JH, Kreyling WG, Swietlicki E, Schmid O. Measurement techniques for respiratory tract deposition of airborne nanoparticles: a critical review. J Aerosol Med Pulm Drug Deliv. 2014;27(4):229–254. doi:10.1089/jamp.2013.1044
38. Putaud JP, Van Dingenen R, Alastuey A, et al. A European aerosol phenomenology – 3: physical and chemical characteristics of particulate matter from 60 rural, urban, and kerbside sites across Europe. Atmos Environ. 2010;44(10):1308–1320. doi:10.1016/j.atmosenv.2009.12.011
39. Kumar P, Morawska L, Birmili W, et al. Ultrafine particles in cities. Environ Int. 2014;66:1–10. doi:10.1016/j.envint.2014.01.013
40. Sarlo K, Blackburn KL, Clark ED, et al. Tissue distribution of 20 nm, 100 nm and 1000 nm fluorescent polystyrene latex nanospheres following acute systemic or acute and repeat airway exposure in the rat. Toxicology. 2009;263(2–3):117–126. doi:10.1016/j.tox.2009.07.002
41. Agnew JE, Bateman JR, Pavia D, Clarke SW. A model for assessing bronchial mucus transport. J Nucl Med. 1984;25(2):170–176.
42. Agnew JE, Pavia D, Clarke SW. Factors affecting the ‘alveolar deposition’ of 5 microns inhaled particles in healthy subjects. Clin Phys Physiol Meas. 1985;6(1):27–36. doi:10.1088/0143-0815/6/1/003
43. van Hengstum M, Festen J, Buijs W, van den Broek W, Corstens F. Variability of tracheobronchial clearance in healthy non-smoking subjects. Respiration. 1989;56(1–2):94–102. doi:10.1159/000195783
44. Becquemin MH, Swift DL, Bouchikhi A, Roy M, Teillac A. Particle deposition and resistance in the noses of adults and children. Eur Respir J. 1991;4(6):694–702.
45. Darquenne C, West JB, Prisk GK. Deposition and dispersion of 1-μm aerosol boluses in the human lung: effect of micro- and hypergravity. J Appl Physiol. 1998;85(4):1252–1259. doi:10.1152/jappl.1998.85.4.1252
46. Wiebert P, Sanchez-Crespo A, Seitz J, et al. Negligible clearance of ultrafine particles retained in healthy and affected human lungs. Eur Respir J. 2006;28(2):286–290. doi:10.1183/09031936.06.00103805
47. Kreyling WG, Semmler M, Erbe F, et al. TRANSLOCATION OF ULTRAFINE INSOLUBLE IRIDIUM PARTICLES FROM LUNG EPITHELIUM TO EXTRAPULMONARY ORGANS IS SIZE DEPENDENT BUT VERY LOW. J Toxicol Environ Health A. 2002;65(20):1513–1530. doi:10.1080/00984100290071649
48. de Bruijne K, Ebersviller S, Sexton KG, et al. Design and testing of Electrostatic Aerosol in Vitro Exposure System (EAVES): an alternative exposure system for particles. Inhal Toxicol. 2009;21(2):91–101. doi:10.1080/08958370802166035
 © 2022 The Author(s). This work is published and licensed by Dove Medical Press Limited. The
full terms of this license are available at https://www.dovepress.com/terms
and incorporate the Creative Commons Attribution
- Non Commercial (unported, 3.0) License.
By accessing the work you hereby accept the Terms. Non-commercial uses of the work are permitted
without any further permission from Dove Medical Press Limited, provided the work is properly
attributed. For permission for commercial use of this work, please see paragraphs 4.2 and 5 of our Terms.
© 2022 The Author(s). This work is published and licensed by Dove Medical Press Limited. The
full terms of this license are available at https://www.dovepress.com/terms
and incorporate the Creative Commons Attribution
- Non Commercial (unported, 3.0) License.
By accessing the work you hereby accept the Terms. Non-commercial uses of the work are permitted
without any further permission from Dove Medical Press Limited, provided the work is properly
attributed. For permission for commercial use of this work, please see paragraphs 4.2 and 5 of our Terms.