Back to Journals » Nature and Science of Sleep » Volume 17

AI‑Enhanced Smartwatch AHI Estimation and AI‑Scored Polysomnography for Obstructive Sleep Apnea: Real‑World Validation
Authors Kim D ![]() , Han JY, Jung H, Song DY, Lee C, Ryu G, Hong SD, Kim HY
, Han JY, Jung H, Song DY, Lee C, Ryu G, Hong SD, Kim HY ![]() , Jung YG
, Jung YG ![]()
Received 3 July 2025
Accepted for publication 21 August 2025
Published 22 September 2025 Volume 2025:17 Pages 2297—2307
DOI https://doi.org/10.2147/NSS.S540460
Checked for plagiarism Yes
Review by Single anonymous peer review
Peer reviewer comments 2
Editor who approved publication: Prof. Dr. Ahmed BaHammam
Donghyeok Kim,1 Jeong Yup Han,2 Hyunjun Jung,2 Da Yeun Song,1 Changhee Lee,1 Gwanghui Ryu,1 Sang Duk Hong,1 Hyo-Yeol Kim,1 Yong Gi Jung1,3
1Department of Otorhinolaryngology-Head and Neck Surgery, Samsung Medical Center, Sungkyunkwan University School of Medicine, Seoul, Republic of Korea; 2Mobile eXperience, Samsung Electronics, Suwon, Gyeonggi, Republic of Korea; 3Department of Data Convergence and Future Medicine Samsung Medical Center, Sungkyunkwan University School of Medicine, Seoul, Republic of Korea
Correspondence: Yong Gi Jung, Department of Otorhinolaryngology-Head and Neck Surgery, Samsung Medical Center, Sungkyunkwan University School of Medicine, 81 Irwon-ro, Gangnam-gu, Seoul, 06351, Republic of Korea, Tel +82-2-3410-3579, Fax +82-2-3410-3879, Email [email protected]
Objective: This study validated the accuracy of an artificial‑intelligence (AI) smartwatch algorithm that directly estimates the apnea–hypopnea index (AHI) by comparing its performance with AI-scored Level 1 polysomnography (PSG) in Korean adults. The model was trained in South‑American cohorts, allowing inter‑ethnic validation.
Methods: A total of 90 adults underwent simultaneous Level 1 PSG and smartwatch recording. Fifty‑three datasets with ≥ 3 hours of valid watch data were analyzed. AHI values were obtained as follows: expert‑scored PSG (pAHI), AI‑scored PSG (aiAHI), and smartwatch output (eAHI). Agreement was assessed with Spearman correlation, intraclass correlation coefficients, and receiver‑operating‑characteristic curves.
Results: eAHI correlated strongly with aiAHI (ρ = 0.88, ICC = 0.87) and pAHI (ρ = 0.85, ICC = 0.82). For detecting moderate‑to‑severe OSA (aiAHI ≥ 15 events/h), the smartwatch algorithm yielded 92.3% sensitivity, 92.6% specificity, and 92.5% overall accuracy. Bland–Altman analysis revealed systematic underestimation of actual AHI by the smartwatch, particularly in mild OSA.
Conclusion: This study demonstrates that the evaluated smartwatch-based AHI estimation algorithm shows high concordance with PSG-derived values, particularly for the detection and classification of moderate to severe OSA. However, it should be noted that this smartwatch algorithm tends to underestimate the AHI of OSA due to limitations in scoring unit and recording duration calculation. These findings support the clinical utility of wearable technology as a practical and scalable tool for early identification and longitudinal monitoring of OSA in real-world environments, while highlighting the need for further optimization to accurately detect mild cases.
Keywords: sleep apnea syndromes, polysomnography, wearable electronic devices, artificial intelligence
Introduction
The global prevalence of obstructive sleep apnea (OSA) is approximately 54%.1 Recent trends show a significant increase in OSA prevalence, from 0.14% in 2003 to 4.59% in 2020.2 This increase has been attributed to rising obesity rates, greater awareness of OSA, and expanded diagnostic capabilities.2 Recently, OSA has been increasingly recognized as an important independent risk factor for coronary artery disease3 and stroke development.4 This association is attributed to repetitive intermittent hypoxemia during sleep, which increases oxidative stress and impairs endothelial function, leading to vasodilation dysfunction, inflammatory responses, and accelerated atherosclerosis, ultimately resulting in coronary atherosclerosis and vascular events such as myocardial infarction and stroke.3,4 Despite these associations between OSA and various serious health risks, approximately 80% of patients with OSA worldwide remain undiagnosed and untreated,2,5 with the resulting socioeconomic burden reported to reach approximately $150 billion annually in the United States alone.6
Considering the growing number of diagnosed OSA patients, high rates of underdiagnosis, and increased risk of cardiovascular and metabolic complications associated with OSA,7 prompt and accurate diagnosis is important. However, Level 1 polysomnography (PSG), the current gold standard for OSA diagnosis, requires patients to spend a night in a hospital equipped with monitoring equipment. This method is expensive, requires specialized personnel, and can process a limited number of patients daily. Additionally, access to testing is particularly difficult in medically underserved areas.
Home sleep testing (HST) was introduced to overcome the limitations of polysomnography by recording key physiological signals (respiratory flow, effort, oxygen saturation, heart rate, position) in patient homes. During the COVID-19 pandemic, HST adoption accelerated significantly.8 American Academy of Sleep Medicine (AASM) and other international societies recommend HST as a viable PSG alternative for patients without severe cardiovascular disease or central sleep apnea, with evidence supporting comparable diagnostic accuracy in select populations.9–11 Despite its advantages, HST has limitations: it requires a physician’s prescription, involves substantial costs, lacks electroencephalography (EEG) recordings for sleep architecture assessment, demands skilled visual analysis, and cannot be easily repeated on a daily basis to capture apnea-hypopnea index (AHI) variability.12–14
To overcome these limitations, wearable devices have been proposed as alternative methods for OSA diagnosis.15–18 While wearable devices have the advantages of portability, accessibility, and continuous monitoring, most wearable-based OSA diagnostic methods have focused on screening or severity classification rather than accurately estimating the AHI. Some devices have shown promising results in controlled research settings,15,17–22 but few real-world validation studies evaluating diagnostic accuracy across diverse clinical environments have been performed. This lack of practical validation limits the utilization of wearable devices as reliable diagnostic tools for OSA.
The OSA detection algorithm developed by Samsung Electronics (Suwon, Korea) received Food and Drug Administration (FDA) de novo approval (DEN230041, February 6, 2024) for detecting signs of moderate to severe obstructive sleep apnea in adults aged 22 years and older during a two-night monitoring period. Photoplethysmography (PPG) sensors emit red and infrared light onto the skin to detect blood volume changes and measure peripheral oxygen saturation (SpO₂) by analyzing differences in hemoglobin light absorption based on oxygen binding status.23 During sleep apnea events, SpO₂ drops rapidly, and these desaturation patterns can be captured through continuous monitoring by wearable devices. Apnea events are detected by analyzing repetitive SpO₂ desaturation patterns, and this data is input into AI-based algorithms to estimate the AHI during sleep. The designed algorithm estimates AHI values through SpO₂ detection by the wearable device.
However, because anthropometric and craniofacial risk factors for OSA vary across ethnicities, and most prior wearable-device studies did not evaluate their algorithms in ethnically diverse cohorts, validating this algorithm originally trained on South American populations in an independent Korean cohort provides a more rigorous assessment of its cross-ethnic generalizability. Therefore, this study aimed to validate the accuracy of the smartwatch-based AHI estimation algorithm compared with Level 1 PSG in Korean subjects.
Materials and Methods
Study Design and Protocol
This prospective, single-center, open-label study was conducted from January 2024 to September 2024. Participants, including healthy individuals and those with OSA of varying severity, were recruited using two distinct methods. Separate recruitment advertisements were posted for the control and patient groups. The control group consisted of individuals without snoring or sleep apnea symptoms, excluding those previously diagnosed with or treated for OSA. Recruitment for this group was conducted through offline posters. The patient group included individuals presenting with symptoms of snoring or sleep apnea, also excluding those previously diagnosed with or treated for OSA. Patients with mild OSA were recruited through offline advertisements, while those with moderate to severe OSA were enrolled from a tertiary medical center, where they presented with sleep apnea as their primary symptom.
All participants completed the STOP-Bang questionnaire as part of the screening process. A license for the use of the STOP-Bang questionnaire was obtained from the copyright holder. Control candidates were required to have a STOP-Bang score of 0, whereas patient candidates with a score of 2 or higher were selected for final inclusion in the study. An otolaryngologist collected sleep-related medical history from all study participants and conducted an upper airway assessment from the nasal cavity through the nasopharynx to the larynx. All PSG recordings were conducted according to standard protocols using Level 1 criteria by AASM-certified sleep technologists. PSG recordings were scored independently by two board-certified neurologists following the AASM criteria. Discrepancies were resolved by consensus, and inter-rater reliability results for primary metrics demonstrated high agreement (intraclass correlation coefficients [ICCs] > 0.8). The study protocol was approved by the Institutional Review Board of Samsung Medical Center prior to implementation (IRB No.: 2023-03-07-154). All participants provided written informed consent prior to enrollment. The study was conducted in accordance with the principles outlined in the Declaration of Helsinki.
The minimum required sample size was calculated to be 74 participants using the Power Analysis and Sample Size Software program (PASS, 2023),24 with an expected ICC value of 0.90625,26 and a 95% confidence interval of 0.85–0.94. Considering an anticipated dropout rate of 17%, we planned to recruit 90 subjects. The inclusion criterion of age 22 years or older was chosen to align with the FDA de novo approval requirements for the wearable device, ensuring consistency with the regulatory indications for its clinical use. Exclusion criteria were atrial fibrillation, pregnancy, and skin conditions that could interfere with sensor operation. Written informed consent was obtained from all participants.
Research participants underwent a one-night Level 1 PSG at a hospital affiliated with our institution, where AASM-certified sleep technicians supervised the study. The date of the PSG test was scheduled by coordination between the hospital and the participants. Participants were instructed to wear the smartwatch during the PSG test. Prior to the PSG test, anthropometric measurements (weight, height, waist circumference, hip circumference, neck circumference) were collected for all participants. The previous day’s sleep medication use and sleep duration were also recorded.
Polysomnography
Sleep technicians attached standard sensors for sleep stage assessment (EEG, electrooculography, chin electromyography), airflow measurement (nasal pressure transducer, thermistor), respiratory effort (abdominal and thoracic respiratory inductance belts), heart rate (electrocardiography), and oxygen saturation (pulse oximetry).
PSG recordings were saved as European data format (EDF) files according to universal time and were interpreted by a neurology specialist according to the AASM scoring manual.14 The AHI value derived from specialist interpretation was defined as physician-read AHI (pAHI). We transferred EDF files to Honeynaps Co., Ltd. (Seoul, Republic of Korea) for artificial intelligence (AI)-based PSG analysis. Honeynaps analyzed the files using their FDA 510(k)-cleared Somnum software (K223922, August 16, 2023), a computer program intended to analyze sleep and respiratory-related sleep disorders. This software can analyze physiological data from standard in-lab polysomnography records, including sleep stage, respiratory events, arousal events, and leg movement events. The AHI values generated through this automated analysis were defined as AI-read AHI (aiAHI). OSA severity was categorized as mild (AHI ≥ 5 and <15 events/h), moderate (AHI ≥ 15 and < 30 events/h), or severe (AHI ≥ 30 events/h).
Wearable Device for Sleep Recording
The commercially available Galaxy Watch 6 (SM-R930, Samsung Electronics, Suwon, Republic of Korea) was used to detect OSA in study participants. The watch’s built-in PPG sensor measured SpO₂ during sleep at a sampling rate of 1 Hz. Since the consumer version of the application (Samsung Health) does not provide access to raw SpO₂ data, a custom research application was developed to transmit the measured raw data. Each participant was provided a paired smartwatch and a test smartphone for data collection.
Low-quality data were automatically filtered using the manufacturer’s proprietary algorithm, and all recorded data were stored in ASCII format for post-processing. Data from nights in which the total recording time contained less than 70% valid signal or fewer than 3 hours of usable data were excluded from the analysis as insufficient to accurately reflect the participant’s sleep state. The manufacturer’s FDA-approved AI algorithm (FDA submission number DEN230041) was employed to analyze the oxygen saturation signal and estimate the AHI, which was denoted as eAHI.
Statistical Analysis
The correlation between AHI values measured via the AI program and that using the wearable device was evaluated using Spearman correlation coefficient. For ICC analysis, values were transformed by adding 5 and applying natural logarithm transformation to correct for zero values and a highly skewed distribution. The ICC was calculated to assess agreement between the two measurements. Bland-Altman plots were created to visually examine the agreement between the two methods.
Optimal eAHI cutoff values for severity classification were estimated using receiver operating characteristic (ROC) analysis and Youden’s index, with sensitivity, specificity, positive predictive value, and negative predictive value. Statistical significance was set at P<0.05 for all analyses.
Results
Subject Selection and Baseline Characteristics
The study was conducted with 29 control subjects and 61 patients with suspected OSA (Figure 1). Of these, 37 patients were excluded due to battery depletion during PSG testing (n=14), SpO₂ measurement for fewer than 3 hours (n=3), SpO₂ coverage less than 70% (n=10), or absence of wearable data due to patients forgetting to bring the device on the PSG night despite prior instruction (n=10).
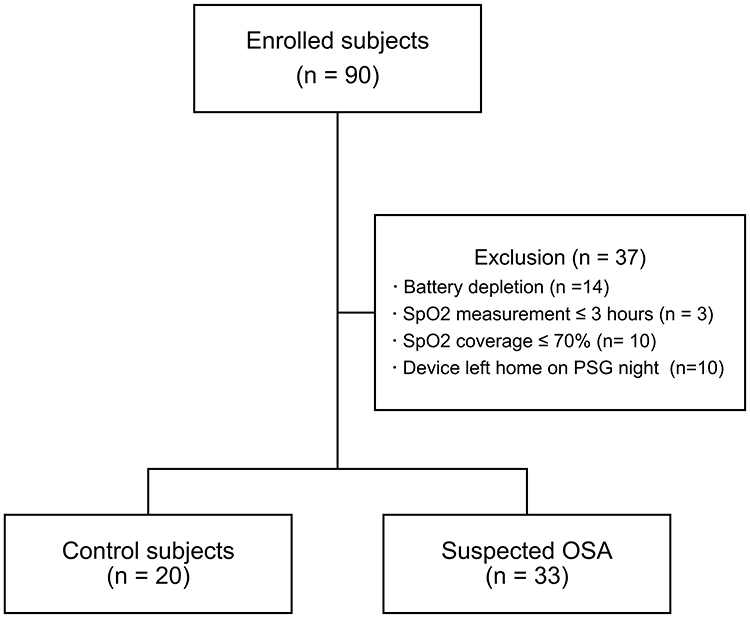 |
Figure 1 Study enrollment and exclusion flowchart. Abbreviations: OSA, obstructive sleep apnea; SpO2, peripheral oxygen saturation. |
The final analysis included 20 control subjects and 33 patients, for a total of 53 participants (Table 1). The median age was 42.0 years (range: 32.0–49.0), with a male proportion of 71.7% (38 subjects). The mean body mass index (BMI) was 24.9 kg/m² (range: 17.6–34.5), and the median ESS score on the day of polysomnography was 9.0 (range: 6.0–11.0).
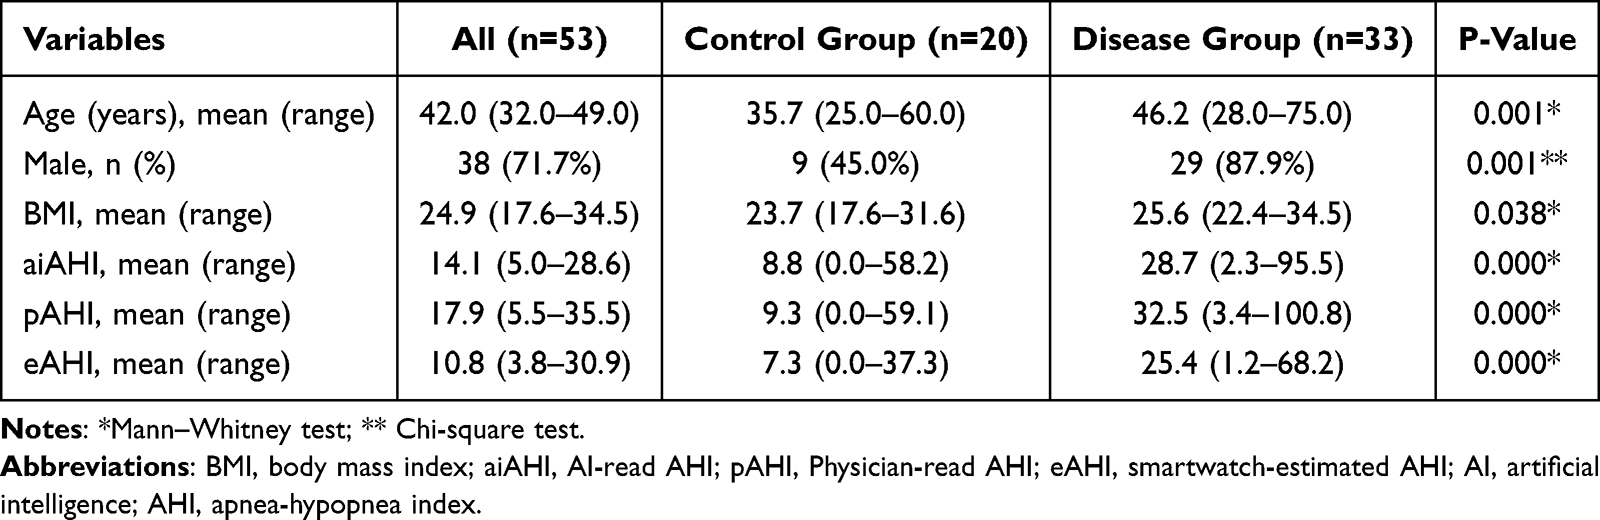 |
Table 1 Demographics of All Participants and Comparison Between Control and Disease Groups |
Statistically significant differences in all baseline characteristics were observed between the control and patient groups. Patients in the disease group were older (46.2 vs 35.7 years, P=0.001), more likely to be male (87.9% vs 45.0%, P=0.001), and had a higher BMI (25.6 kg/m² vs 23.7 kg/m², P=0.038) and a higher ESS score (10.8 vs 6.5, P<0.001) than those in the control group.
Correlation Analysis Between eAHI and aiAHI
Spearman rank correlation analysis was performed to analyze the relationship between eAHI and aiAHI. The two variables showed a significant positive correlation (rho=0.88, 95% confidence interval[CI]: 0.81–0.93, P<0.001) (Figure 2A).
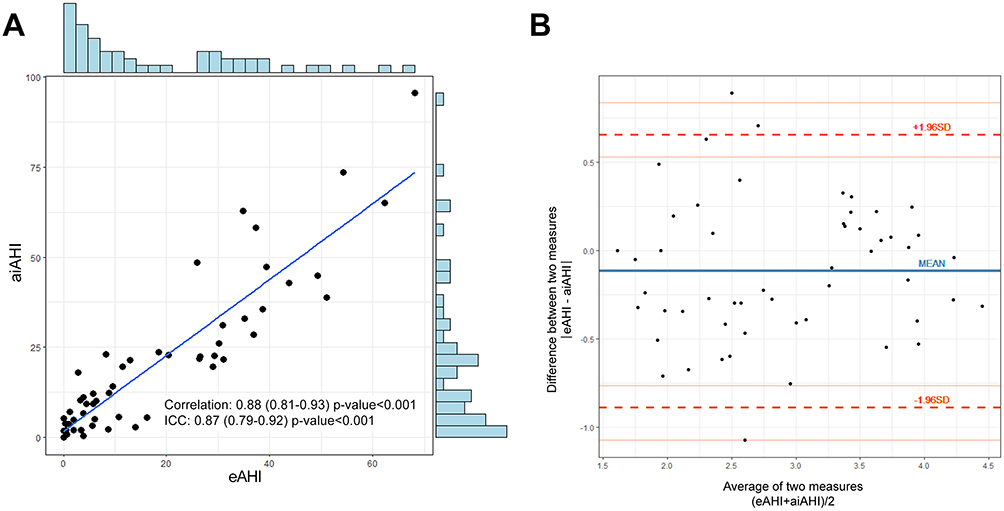 |
Figure 2 eAHI and aiAHI analysis: correlation and agreement. (A) Correlation chart. Scatter plot with marginal histograms showing the correlation between eAHI and aiAHI. A strong positive correlation (r = 0.88) was observed, with a regression line indicating the linear relationship. The histogram distributions provide insights into data distribution. (B) Bland-Altman plot to assess agreement between eAHI and aiAHI values. The blue line represents the mean difference, and the red dashed lines indicate the limits of agreement (±1.96 SD). This plot helps assess bias and variability between the two measurement methods. Abbreviations: AHI, apnea-hypopnea index; eAHI, smartwatch-estimated AHI; aiAHI, AI-read AHI; ICC, intraclass correlation coefficient. |
The ICC analysis also demonstrated high agreement between the two variables (ICC=0.87, 95% CI: 0.79–0.92, P<0.001), which is considered a good correlation (0.75–0.9).
Bland-Altman analysis revealed a mean difference between eAHI and aiAHI of −0.118, with 95% limits of agreement ranging from −0.891 to 0.654 (Figure 2B). The Bland-Altman plot showed small scatter variability of difference values according to the means of the two measurements, with measurement points distributed around the mean within the limits of agreement.
Diagnostic Performance for Severity Classification
ROC curve analysis was performed to evaluate the performance of eAHI in assessing OSA severity (Figure 3). For the diagnosis of mild or greater OSA (aiAHI ≥ 5), the optimal eAHI threshold was 5.7, with an area under the ROC curve of 0.898 (95% CI: 0.796–0.974). At this threshold, sensitivity was 82.5%, specificity 84.6%, positive predictive value 94.3%, negative predictive value 61.1%, and accuracy 83.0% (Figure 4A).
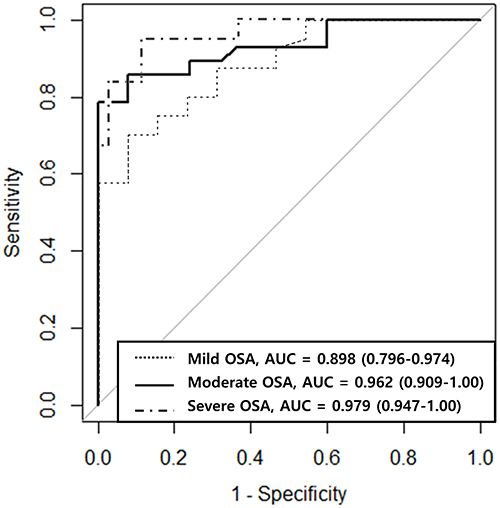 |
Figure 3 ROC curve analysis for aiAHI prediction using eAHI values. Dotted line, ROC curve for predicting aiAHI ≥ 5 events/h from eAHI values measured by a smartwatch; dashed line, ROC curve for predicting aiAHI ≥ 15 events/h from eAHI values measured by a smartwatch; dashed-dotted line, ROC curve for predicting aiAHI ≥ 30 events/h from eAHI values measured by a smartwatch. Abbreviations: OSA, obstructive sleep apnea; AHI, apnea-hypopnea index; aiAHI, AI-read AHI; eAHI, smartwatch-estimated AHI; AUC, area under the curve. |
 |
Figure 4 Confusion matrix of apnea severity classification: eAHI versus aiAHI. (A) Apnea vs healthy. (B). Moderate-severe apnea vs others (healthy and mild apnea). (C) Severe apnea vs others (healthy and mild-moderate apnea). Abbreviations: OSA, obstructive sleep apnea; PPV, positive predictive value; NPV, negative predictive value. |
For moderate or greater OSA (aiAHI ≥ 15), the optimal eAHI threshold was 11.1, with an area under the ROC curve (AUC) of 0.962 (95% CI: 0.909–1.00). At this threshold, sensitivity was 92.3%, specificity 92.6%, positive predictive value 92.6%, negative predictive value 92.9%, and accuracy 92.5% (Figure 4B).
For severe OSA (aiAHI ≥30), the optimal eAHI threshold was 30.6, with an AUC of 0.979 (95% CI: 0.947–1.00). At this threshold, sensitivity was 92.3%, specificity 95.0%, positive predictive value 85.7%, negative predictive value 97.5%, and accuracy 94.3% (Figure 4C).
Correlation Analysis Between eAHI and pAHI
The Spearman correlation coefficient between eAHI and pAHI was 0.85 (95% CI: 0.75–0.91, P<0.001), which also falls within the high positive correlation range (0.7–0.9). This was slightly lower than the correlation coefficient between eAHI and aiAHI (rho=0.85, 95% CI: 0.75–0.91, P<0.001) (Supplementary Figure S1). The ICC analysis also demonstrated high agreement between the two variables (ICC=0.82, 95% CI: 0.72–0.89, P<0.001), which is considered a good correlation (0.75–0.9).
ROC curve analysis was performed to evaluate the performance of eAHI in assessing OSA severity, using pAHI as the reference standard (Supplementary Figure S2). For detection of mild or greater OSA (pAHI ≥ 5), the optimal eAHI threshold was 8.9, with an area under the ROC curve of 0.886 (95% CI: 0.796–0.975). At this threshold, the sensitivity was 70.0%, specificity 92.3%, positive predictive value 96.6%, negative predictive value 50.0%, and accuracy 75.5% (Supplementary Figure S3A).
For moderate or greater OSA (pAHI ≥15), the optimal eAHI threshold was 17.4, with an AUC of 0.931 (95% CI: 0.862–0.999). This threshold yielded a sensitivity of 78.6%, specificity of 100%, positive predictive value of 100%, negative predictive value of 80.6%, and accuracy of 88.7% (Supplementary Figure S3B).
For severe OSA (pAHI ≥30), the optimal eAHI threshold was 19.4, with an AUC of 0.962 (95% CI: 0.914–1.00). At this threshold, the sensitivity was 94.4%, specificity 88.6%, positive predictive value 81.0%, negative predictive value 97.0%, and accuracy 90.6% (Supplementary Figure S3C).
Discussion
In this study, eAHI values derived from an FDA de novo-approved algorithm demonstrated a high correlation (ICC=0.87, 95% CI: 0.79–0.92) with aiAHI values obtained through PSG and showed high accuracy in classifying OSA severity (83.0% for mild, 92.5% for moderate, and 94.3% for severe OSA). These findings suggest that commercially available wearable devices can have significant clinical utility for OSA diagnosis.
This study has two major methodological advantages compared to previous research. First, we distinguished the algorithm development group from the validation group, enhancing the validity of our study. Previous studies either enrolled both algorithm development and validation groups simultaneously or failed to clearly separate them. This separation is crucial for preventing algorithm overfitting to specific population characteristics and improving generalizability in real clinical settings. Second, while previous studies indirectly predicted OSA using variables highly correlated with AHI (such as the oxygen desaturation index [ODI]), our study applied an algorithm that directly estimates AHI values. This approach offers greater clinical utility by providing quantitative AHI estimates beyond simple OSA detection or severity classification.
To date, seven studies have analyzed the relationships between AHI and variables measured by wearable devices worn simultaneously during PSG examination.15,17–22 Of these, only two utilized commercially available wearable devices. In 2024, Browne et al studied 51 patients using the Samsung Galaxy Watch 4 to measure ODI, predicting AHI severity with accuracy rates of 86%, 78%, and 78% for mild, moderate, and severe OSA, respectively.20 In 2022, Jung et al used the reflective PPG sensor of the Galaxy Watch to measure SpO₂ and ODI to predict OSA severity, achieving 79.4% accuracy in predicting AHI ≥ 15/h using ODI ≥ 5/h as the criterion.15 Most recently, McMahon et al evaluated the Compumedics Somfit forehead-worn peripheral arterial tonometry/PPG device in 92 adults, reporting strong correlation with PSG-derived AHI (r = 0.84), 89% accuracy for detecting OSA at AHI ≥ 5, and AUC values of 0.86–0.93 across standard severity thresholds.18
Unlike previous studies, we directly estimated AHI values through an algorithm based on SpO₂ data, resulting in higher accuracy. The accuracy rates for moderate (92.5%) and severe (94.3%) OSA classifications are particularly noteworthy as they are significantly higher than those reported in previous studies. While previous studies primarily focused on classification accuracy, our study quantitatively assessed the agreement between eAHI and actual AHI (aiAHI and pAHI) through ICC analysis, representing an important advancement.
Bland-Altman analysis demonstrated that eAHI values were consistently lower than aiAHI values, with a mean difference of −2.93 (95% CI: −22.30 to 16.44). This underestimation of eAHI compared to actual AHI can be attributed to several methodological factors inherent to wearable device-based detection. First, the device analyzes respiratory events in 1-minute windows, which leads to analysis of multiple short events within the same window as a single event. For example, if three 10-second apnea events occur within one minute, PSG would accurately count three separate events, whereas the wearable device would register only one “apnea present” occurrence for that minute. Additionally, the theoretical maximum eAHI value is limited to 60 events/hour due to the 1-minute resolution, which particularly affects patients with severe OSA whose actual AHI exceeds this threshold. Furthermore, due to the inherent limitations of wearable devices, which cannot accurately determine sleep onset and offset times in the absence of EEG monitoring, total recording time (TRT) rather than total sleep time (TST) was used as the denominator in AHI calculation. TRT includes wake periods and is inherently longer than TST, leading to an increased denominator and lower eAHI values. These methodological constraints contributed to the systematic underestimation of AHI observed with the smartwatch, particularly in patients with higher true AHI values, as confirmed by our Bland-Altman analysis.
In this study, we used aiAHI rather than pAHI as the reference standard for the primary analysis. This approach was chosen because AI-based analysis provides high objectivity and consistency, minimizing interpretation variability between readers (inter-reader variability) and within the same reader due to changes in attention, context effects, and learning effects (intra-reader variability). Importantly, supplementary analysis confirmed a high correlation between pAHI and eAHI (rho=0.85, ICC=0.82), supporting the clinical validity of our findings.
The clinical implications of this study can be summarized in three key points. First, we demonstrated the potential of wearable devices as primary screening tools for PSG. Given the frequent delays in PSG testing due to time and economic constraints, the high-accuracy screening capability of the commercial wearable device validated in our study could lead to changes in diagnostic guidelines. For example, in clinical settings, suspected OSA patients could be prescribed a smartwatch for 2–3 days of monitoring to prioritize PSG testing or potentially reduce unnecessary tests for mild cases. Second, wearable devices enable rapid and objective assessment of OSA treatment efficacy. Rather than conducting repeat PSG tests to evaluate the effects of positive airway pressure therapy or sleep surgery, wearable devices can provide more efficient treatment monitoring. Third, wearable devices allow AHI assessment in real sleep environments. While PSG testing typically collects data from a single night in an unfamiliar hospital environment, wearable devices can collect data over multiple nights in the patient’s natural sleep environment, providing a more accurate understanding of AHI trends. This is particularly valuable for patients whose sleep patterns vary significantly from night to night.
This study had several limitations. First, there were differences in recruitment methods between control and patient groups. The control group was recruited through offline posters, while the patient group consisted of individuals who visited the outpatient clinic with sleep apnea as their chief complaint, potentially introducing selection bias. This discrepancy in recruitment methods was due to practical constraints: patients presenting with sleep apnea-related symptoms at hospitals are likely to have OSA, while healthy individuals rarely visit hospitals for these issues. Consequently, significant differences in age, gender, BMI, and ESS scores were observed between the two groups. However, as the primary analysis integrated all participants to evaluate the correlation between actual AHI and eAHI, the impact of selection bias is likely limited. Second, there was a higher dropout rate than anticipated. The study experienced a 34% dropout rate, substantially higher than the 17% initially predicted, with many exclusions due to technical issues such as battery depletion and SpO₂ coverage. This was primarily attributed to inadequate training of sleep technicians regarding pre-PSG checks of watch battery and contact. This high dropout rate reduced our statistical power when analyzing the study data. Third, While the wearable device in this study could calculate apnea and hypopnea events, it has the limitation of being unable to distinguish whether these events are central or obstructive in nature due to the absence of sensors measuring chest movement. Although recording chest movement is essential to differentiate central versus obstructive sleep apnea, SpO₂ based analysis from wearable device alone cannot assess the presence of respiratory effort. To overcome this limitation, recent reports have described the development of wearable sensors using 3D printing technology for detecting chest movement, which can simultaneously measure oxygen saturation to detect apnea events.27 Implementation of such technology is expected to enable differentiation between central and obstructive apnea by detecting chest movement during respiratory events. Fourth, eAHI may be underestimated in individuals with increased skin pigmentation. This is attributed to the tendency for SpO₂ values measured by reflectance PPG sensors to be overestimated compared to actual values in populations with increased melanin content. Recent meta-analyses have confirmed that this bias is statistically significant in participants with darker skin tones,28 which is due to the optical characteristics where increased melanin reduces the alternating current to direct current ratio of PPG signals.29 Therefore, in wearable systems that calculate AHI based on SpO₂, there exists an inherent limitation where oxygen desaturation events may be masked, potentially leading to eAHI underestimation. Finally, a limitation of our study is that the AI algorithm applied represents a “black-box AI” protected by commercial licensing, preventing access to open code and data. From the perspective of the “do no harm” principle, Xu et al30 pointed out that unexplainable medical AI can pose potential harm to patient safety and autonomy, warning that clinicians’ and patients’ lack of understanding regarding the internal workings of algorithms can lead to delayed error correction, difficulties in verifying medical judgments, and psychological and financial burden. Therefore, despite the high accuracy of the algorithm used in this study, improvements are required in terms of transparency and verifiability. Future efforts should focus on mitigating the black-box problem through implementation of explainable AI, establishment of third-party evaluation systems, and reproducibility reviews based on open datasets.
Studies with larger sample sizes and diverse populations should be performed in the future to enhance the generalizability of our findings and further validate the clinical utility of watch-based eAHI. Additionally, systematic investigation is needed to identify which patient groups show larger discrepancies between eAHI and actual AHI. For example, analyzing the impact of specific sleep postures, severe obesity, comorbidities such as cardiovascular disease or diabetes, or medication use on measurement accuracy would provide important insights into the limitations of wearable devices in clinical practice. Last, the continuous long-term monitoring capability of wearable devices could be leveraged to conduct sleep physiological studies on daily, weekly, and seasonal fluctuations in AHI according to sleep patterns. This could advance our understanding of OSA and the impact of various external factors (stress, alcohol consumption, seasonal changes) on OSA severity, overcoming the limitations of single-night PSG testing.
Conclusion
This prospective validation confirms that a commercial smartwatch algorithm can directly estimate the AHI with strong agreement to concurrent Level 1 PSG across OSA severities. Uniquely, it is the first wearable study to report true AHI values while employing fully independent development and validation cohorts alongside simultaneous Level 1 PSG, thereby minimizing bias. The device tends to underestimate AHI due to events being aggregated in one-minute bins and total recording time being substituted for true sleep time.
Data Sharing Statement
The datasets used and/or analyzed during the current study are available from the corresponding author on reasonable request.
Acknowledgments
We gratefully acknowledge the generous support of the STOP-Bang Questionnaire development team in facilitating access to the instrument for academic research purposes.
Author Contributions
Donghyeok Kim: Formal analysis, Validation, Methodology, Investigation, Data curation, Writing – original draft, Writing – review & editing, Visualization. Jeong Yup Han: Software; Data curation, Writing – review & editing. Hyunjun Jung: Software; Data curation, Writing – review & editing. Da Yeun Song: Investigation; Data curation, Writing – review & editing. Changhee Lee: Investigation; Resources, Writing – review & editing. Gwanghui Ryu: Investigation; Resources, Writing – review & editing. Sang Duk Hong: Investigation; Resources, Writing – review & editing. Hyo-Yeol Kim: Investigation; Resources, Writing – review & editing. Yong Gi Jung: Conceptualization, Methodology, Validation, Formal analysis, Writing – original draft, Writing – review & editing, Supervision, Project administration.
All authors made substantial contributions to the conception or design of the work, or to the acquisition, analysis, or interpretation of data; they were involved in drafting the manuscript or revising it critically for important intellectual content, agreed on the journal to which the article was submitted, reviewed and approved all versions of the manuscript (including submission, revision, and final publication), and agreed to take responsibility and be accountable for all aspects of the work, ensuring its integrity and accuracy.
Funding
This work was supported by Samsung Electronics (Grant number PHO0234291).
Disclosure
This study was supported by Samsung Electronics. Co-authors Jeong Yup Han and Hyunjun Jung, both employees of Samsung Electronics, were responsible for data collection, raw signal interpretation, and drafting the watch algorithm section of the Methods. However, they were not involved in study design, data analysis, or interpretation of the results, all of which were independently conducted by researchers at Samsung Medical Center. The remaining authors declare no conflicts of interest.
References
1. de Araujo Dantas AB, Goncalves FM, Martins AA, et al. Worldwide prevalence and associated risk factors of obstructive sleep apnea: a meta-analysis and meta-regression. Sleep Breath. 2023;27(6):2083–2109. doi:10.1007/s11325-023-02810-7
2. Pendharkar SR, Sharpe H, Rosychuk RJ, et al. Temporal and Regional Trends in Obstructive Sleep Apnea Using Administrative Health Data in Alberta, Canada. Ann Am Thorac Soc. 2023;20(3):433–439. doi:10.1513/AnnalsATS.202209-789OC
3. McEvoy RD, Antic NA, Heeley E, et al. CPAP for Prevention of Cardiovascular Events in Obstructive Sleep Apnea. New England Journal of Medicine. 2016;375(10):919–931. doi:10.1056/NEJMoa1606599
4. Yaggi HK, Concato J, Kernan WN, Lichtman JH, Brass LM, Mohsenin V. Obstructive Sleep Apnea as a Risk Factor for Stroke and Death. New England Journal of Medicine. 2005;353(19):2034–2041. doi:10.1056/NEJMoa043104
5. Veasey SC, Rosen IM. Obstructive Sleep Apnea in Adults. N Engl J Med. 2019;380(15):1442–1449. doi:10.1056/NEJMcp1816152
6. Watson NF. Health Care Savings: the Economic Value of Diagnostic and Therapeutic Care for Obstructive Sleep Apnea. J Clin Sleep Med. 2016;12(8):1075–1077. doi:10.5664/jcsm.6034
7. Yeghiazarians Y, Jneid H, Tietjens JR, et al. Obstructive Sleep Apnea and Cardiovascular Disease: a Scientific Statement From the American Heart Association. Circulation. 2021;144(3):e56–e67. doi:10.1161/CIR.0000000000000988
8. Sico JJ, Koo BB, Perkins AJ, et al. Impact of the coronavirus disease-2019 pandemic on Veterans Health Administration Sleep Services. SAGE Open Med. 2023;11:20503121231169388. doi:10.1177/20503121231169388
9. Kapur VK, Auckley DH, Chowdhuri S, et al. Clinical Practice Guideline for Diagnostic Testing for Adult Obstructive Sleep Apnea: an American Academy of Sleep Medicine Clinical Practice Guideline. J Clin Sleep Med. 2017;13(3):479–504. doi:10.5664/jcsm.6506
10. Collop NA. Portable monitoring for the diagnosis of obstructive sleep apnea. Curr Opin Pulm Med. 2008;14(6):525–529. doi:10.1097/MCP.0b013e328312ed4a
11. Collop NA, Anderson WM, Boehlecke B, et al. Clinical guidelines for the use of unattended portable monitors in the diagnosis of obstructive sleep apnea in adult patients. Portable Monitoring Task Force of the American Academy of Sleep Medicine. J Clin Sleep Med. 2007;3(7):737–747.
12. Aurora RN, Swartz R, Punjabi NM. Misclassification of OSA severity with automated scoring of home sleep recordings. Chest. 2015;147(3):719–727. doi:10.1378/chest.14-0929
13. Feltner C, Wallace IF, Aymes S, et al. Screening for Obstructive Sleep Apnea in Adults: updated Evidence Report and Systematic Review for the US Preventive Services Task Force. JAMA. 2022;328(19):1951–1971. doi:10.1001/jama.2022.18357
14. Berry RB, Quan SF, Abreu AR, et al. The AASM Manual for the Scoring of Sleep and Associated Events: Rules, Terminology and Technical Specifications. Darien, IL: American Academy of Sleep Medicine; 2023.
15. Jung H, Kim D, Lee W, et al. Performance evaluation of a wrist-worn reflectance pulse oximeter during sleep. Sleep Health. 2022;8(5):420–428. doi:10.1016/j.sleh.2022.04.003
16. Braun F, Theurillat P, Proenca M, et al. Pulse Oximetry at the Wrist During Sleep: performance, Challenges and Perspectives. Annu Int Conf IEEE Eng Med Biol Soc. 2020;2020:5115–5118. doi:10.1109/EMBC44109.2020.9176081
17. Cinar Bilge P, Keskintig Fatma E, Cansu S, et al. Scanning of obstructive sleep apnea syndrome using smartwatch: a comparison of smartwatch and polysomnography. J Clin Neurosci. 2024;119:212–219. doi:10.1016/j.jocn.2023.12.009
18. McMahon M, Goldin J, Kealy ES, et al. Evaluating Somfit’s pulse arterial tonometry for detection of obstructive sleep apnoea. Sleep Biol Rhythms. 2025;23(2):145–152. doi:10.1007/s41105-024-00559-4
19. Hayano J, Adachi M, Sasaki F, Yuda E. Quantitative detection of sleep apnea in adults using inertial measurement unit embedded in wristwatch wearable devices. Sci Rep. 2024;14(1):4050. doi:10.1038/s41598-024-54817-z
20. Browne SH, Vaida F, Umlauf A, Kim J, DeYoung P, Owens RL. Performance of a commercial smart watch compared to polysomnography reference for overnight continuous oximetry measurement and sleep apnea evaluation. J Clin Sleep Med. 2024;20(9):1479–1488. doi:10.5664/jcsm.11178
21. Papini GB, Fonseca P, Gilst MMV, Bergmans JW, Vullings R, Overeem S. Respiratory activity extracted from wrist-worn reflective photoplethysmography in a sleep-disordered population. Physiol Meas. 2020;41(6):065010. doi:10.1088/1361-6579/ab9481
22. Hayano J, Yamamoto H, Nonaka I, et al. Quantitative detection of sleep apnea with wearable watch device. PLoS One. 2020;15(11):e0237279. doi:10.1371/journal.pone.0237279
23. Lochner CM, Khan Y, Pierre A, Arias AC. All-organic optoelectronic sensor for pulse oximetry. Nature Communications. 2014;5(1):5745. doi:10.1038/ncomms6745
24. Bonett DG. Sample size requirements for estimating intraclass correlations with desired precision. Stat Med. 2002;21(9):1331–1335. doi:10.1002/sim.1108
25. Alshaer H, Ryan C, Fernie GR, Bradley TD. Reproducibility and predictors of the apnea hypopnea index across multiple nights. Sleep Sci. 2018;11(1):28–33. doi:10.5935/1984-0063.20180007
26. Bittencourt LR, Suchecki D, Tufik S, et al. The variability of the apnoea-hypopnoea index. J Sleep Res. 2001;10(3):245–251. doi:10.1046/j.1365-2869.2001.00255.x
27. Tiwari A, Baghel MK, Kumar V. A multimodal approach for sleep apnea detection: spO2 and force sensitive sensors in a flexible 3D-printed wearable. Microchimica Acta. 2025;192(3):150. doi:10.1007/s00604-025-07001-7
28. Singh S, Bennett MR, Chen C, Shin S, Ghanbari H, Nelson BW. Impact of Skin Pigmentation on Pulse Oximetry Blood Oxygenation and Wearable Pulse Rate Accuracy: systematic Review and Meta-Analysis. J Med Internet Res. 2024;26:e62769. doi:10.2196/62769
29. Al-Halawani R, Qassem M, Kyriacou PA. Monte Carlo simulation of the effect of melanin concentration on light-tissue interactions in transmittance and reflectance finger photoplethysmography. Scientific Reports. 2024;14(1):8145. doi:10.1038/s41598-024-58435-7
30. Xu H, Shuttleworth KMJ. Medical artificial intelligence and the black box problem: a view based on the ethical principle of “do no harm”. Intelligent Medicine. 2024;4(1):52–57. doi:10.1016/j.imed.2023.08.001
 © 2025 The Author(s). This work is published and licensed by Dove Medical Press Limited. The
full terms of this license are available at https://www.dovepress.com/terms
and incorporate the Creative Commons Attribution
- Non Commercial (unported, 4.0) License.
By accessing the work you hereby accept the Terms. Non-commercial uses of the work are permitted
without any further permission from Dove Medical Press Limited, provided the work is properly
attributed. For permission for commercial use of this work, please see paragraphs 4.2 and 5 of our Terms.
© 2025 The Author(s). This work is published and licensed by Dove Medical Press Limited. The
full terms of this license are available at https://www.dovepress.com/terms
and incorporate the Creative Commons Attribution
- Non Commercial (unported, 4.0) License.
By accessing the work you hereby accept the Terms. Non-commercial uses of the work are permitted
without any further permission from Dove Medical Press Limited, provided the work is properly
attributed. For permission for commercial use of this work, please see paragraphs 4.2 and 5 of our Terms.
Recommended articles
Overweight/Obese Status Synergistically Worsens Nocturnal Time-to-Time Blood Pressure in Children with Obstructive Sleep Apnea
Wu Y, Geng X, Xu Z, Ni X
Nature and Science of Sleep 2022, 14:1261-1271
Published Date: 15 July 2022
Prevalence and Associative Analysis of Thyroid Dysfunction in Patients with Obstructive Sleep Apnea Hypopnea Syndrome: A Cross-Sectional Study
Zhou P, Li H, Qiu J, Ye J, Guo J, Yao Y, Li H, Shi Y, Duan Y, Lv Y
Nature and Science of Sleep 2025, 17:1467-1475
Published Date: 23 June 2025
Clinical Artificial Intelligence Implementation in Routine Care: Real-World Operational Outcomes from a Provincial Health System in China
Tian J, Song Y, Tang L, An L, Zhou J
Risk Management and Healthcare Policy 2026, 19:604289
Published Date: 4 June 2026