Back to Journals » Clinical Ophthalmology » Volume 19
AI-Based Ocular Age Estimation from Combined OCT and OCTA Metrics: Decade-Stratified Normative Modelling in Healthy Eyes – a Pilot Study
Authors Pourjavan S ![]() , Nazaran N
, Nazaran N ![]() , Vaucourt T
, Vaucourt T ![]() , Abdouli N, El Maftouhi A, Macq B
, Abdouli N, El Maftouhi A, Macq B
Received 16 June 2025
Accepted for publication 4 September 2025
Published 18 October 2025 Volume 2025:19 Pages 3855—3867
DOI https://doi.org/10.2147/OPTH.S542219
Checked for plagiarism Yes
Review by Single anonymous peer review
Peer reviewer comments 4
Editor who approved publication: Dr Scott Fraser
Sayeh Pourjavan,1,2 Niki Nazaran,3 Tom Vaucourt,3 Nasim Abdouli,1 Adil El Maftouhi,4 Benoit Macq3
1Department of Ophthalmology, Cliniques Universitaires Saint Luc, UCLouvain, Brussels, Belgium; 2Department of Ophthalmology, Chirec Hospital Group, Site Delta, Brussels, Belgium; 3Institute for Information and Communication Technologies, Electronics, and Applied Mathematics (ICTEAM), Louvain School of Engineering, UCLouvain, Louvain-la-Neuve, Belgium; 4Centre Ophtalmologique de RIVE, Geneve, Switzerland
Correspondence: Sayeh Pourjavan, Email [email protected]
Purpose: To define decade-stratified normative values for vascular parameters obtained from optical coherence tomography angiography (OCTA) in healthy eyes and to evaluate their utility for predicting biological ocular age using artificial intelligence.
Methods: This cross-sectional pilot study included 136 rigorously screened healthy subjects aged 10– 80 years. Spectral-domain OCT and OCTA scans were acquired using the Optovue Solix platform. Structural and vascular features were extracted from both the macular and optic disc regions. Vessel density (VD) metrics were calculated in the superficial capillary plexus using the ETDRS grid (macula) and Garway-Heath segmentation (peripapillary). Foveal avascular zone (FAZ) area, FAZ circularity, and FD-300 density were also analysed. Disc and RNFL metrics were included. Age-stratified normative values were derived, and a support vector regression (SVR) model was developed to estimate biological ocular age based on structural-only, vascular-only, and combined imaging inputs. Model performance was evaluated using root mean squared error (RMSE) and R² under subject-level grouped cross-validation.
Results: Vessel density in the macular and peripapillary regions declined progressively with age, particularly after the fifth decade. FAZ area increased, and circularity decreased with age, while FD-300 density remained relatively stable. The SVR model trained on OCTA-only features showed modest predictive performance (R² = 0.268), while the structural OCT-only model performed poorly (R² = 0.296). Combining structural and vascular features achieved a highly accurate age prediction model (R² = 0.895; RMSE = 5.025 years and MAE of 4.024) under subject-level cross-validation.
Conclusion: This pilot study provides decade-stratified normative OCTA metrics and demonstrates that combining OCT and OCTA features significantly enhances AI-based ocular age estimation. These findings offer a promising foundation for early glaucoma risk stratification through biologically meaningful ocular age prediction.
Keywords: glaucoma, OCTA, optic disc, macula, vessel density, OCTA normative values, GlauOCTA, GlauOCTA-AI, neurovascular degeneration
A Letter to the Editor has been published for this article.
A Response to Letter by Dr Elsaddig has been published for this article.
Introduction
Despite advances in imaging and functional testing, glaucoma diagnosis and progression monitoring remain fundamentally subjective and variable. Numerous studies have demonstrated significant interobserver variability even among glaucoma specialists when assessing optic disc photographs.1–3
Optical Coherence Tomography Angiography (OCTA) has recently emerged as a promising modality to assess microvascular alterations in both the macular and peripapillary regions, providing complementary insights into glaucomatous damage.4–6
Several studies have confirmed the clinical relevance of OCTA in evaluating glaucomatous changes.7 Yet, physiological vascular ageing must be carefully distinguished from pathological changes. Normative reference data for OCTA metrics across the lifespan are essential, particularly as age-related capillary rarefaction may confound clinical interpretation. Current normative studies are often limited by small sample sizes, narrow age distributions, variable segmentation methods, or inconsistent quality control.8–10 While prior normative OCTA studies often use broader age groups (e.g., <30, 30–49), decade-specific stratification provides finer resolution for age-related vascular changes, which is novel and essential for precise clinical benchmarking.
Few have stratified OCTA metrics by decade or reported macular and disc metrics simultaneously in healthy eyes.
Recent developments in artificial intelligence (AI) and machine learning (ML) have shown promise in supporting glaucoma diagnosis and risk stratification by identifying subtle patterns across high-dimensional imaging data. However, AI-based models estimating biological ocular age from structural and vascular features remain underdeveloped. To our knowledge, studies utilising optical coherence tomography angiography (OCTA) for ocular age prediction are scarce, with most research focusing on descriptive age-related changes in vascular parameters (e.g., vessel density, foveal avascular zone metrics) rather than developing predictive models integrating vascular biomarkers.11–13 This gap highlights the need for robust, multimodal approaches that combine structural optical coherence tomography (OCT) and vascular OCTA features. The literature lacks predictive AI models using OCTA for ocular age, with most studies focusing on descriptive vascular trends or OCT-based age prediction. This study explores the integration of decade-stratified normative OCTA metrics with AI-based ocular age prediction, offering a preliminary step toward addressing gaps in multimodal imaging for potential glaucoma risk assessment.
Purpose
Our study is establishing a decade-stratified normative OCTA dataset and applying support vector regression (SVR) to predict biological ocular age, offering a foundation for early glaucoma risk stratification and personalised clinical insights through a biologically meaningful ageing biomarker.
Methods
Study Design & Participants
This cross-sectional pilot study included 136 healthy subjects aged 10–80 years, recruited from outpatient ophthalmological consultations and hospital staff volunteers (e.g., ophthalmology residents, medical students, administrative personnel) at Cliniques Universitaires Saint-Luc, Brussels. The study involved data collection from 2023 to March 2025, during which some participants underwent multiple scans for consistency checks and was conducted under two Ethics Committee-approved protocols: GlauOCTA, which governs data collection for optical coherence tomography (OCT) and OCT angiography (OCTA) imaging to establish normative vascular metrics, and GlauOCTA-AI, which focuses on artificial intelligence-based analysis for ocular age prediction and glaucoma risk stratification.
All underwent spectral-domain optical coherence tomography (OCT) and OCT angiography (OCTA) imaging using the Optovue Solix (V1.1.100.20, Fremont, CA, USA), with participants stratified by age into decades. After quality control, 221 eyes from 120 subjects were included in the final analysis (16 eyes were excluded due to poor image quality).
The Institutional Ethical Committee of the Cliniques Universitaires Saint-Luc in Brussels approved the study protocols (GlauOCTA and GlauOCTA-AI). The research adhered to the principles of the Declaration of Helsinki. It complied with all relevant national and European ethical guidelines, including the General Data Protection Regulation (GDPR) for data privacy and confidentiality. Although HIPAA applies specifically to the United States, the GDPR ensures comparable protection in the European context. Written informed consent was obtained from all participants prior to their inclusion.
Eligible subjects had intraocular pressure (IOP) ≤21 mmHg, a clinically normal optic disc, and intact neuroretinal rim and retinal nerve fibre layer (RNFL), confirmed by a glaucoma specialist (SP) using indirect ophthalmoscopy (60D lens), spectral-domain OCT, auto-refractometry, best-corrected visual acuity (BCVA), and Goldmann applanation tonometry. Participants with high refractive errors were included if image quality was sufficient.
The reported general health was based on the patient’s anamnesis, meaning that patients who were unaware of their general condition and showed no abnormalities in the fundi were included in the study. We did not perform any physical examination.
Participants were excluded if they had one of the following conditions:
- An abnormal optic disc or neuroretinal rim on funduscopy or OCT
- IOP > 21 mmHg
- Amblyopia
- Retinal pathology (e.g., drusen, age-related macular degeneration, etc)
- History of intraocular surgery other than uncomplicated phacoemulsification
- Systemic conditions (e.g., diabetes, arterial hypertension, etc)
- Central neurodegenerative diseases
- Recent use of systemic vasodilators (e.g., Sildenafil citrate)
- Smoking habits
Standard visual field testing was performed only if clinically indicated. Table 1 provides the demographic characteristics of the study population.
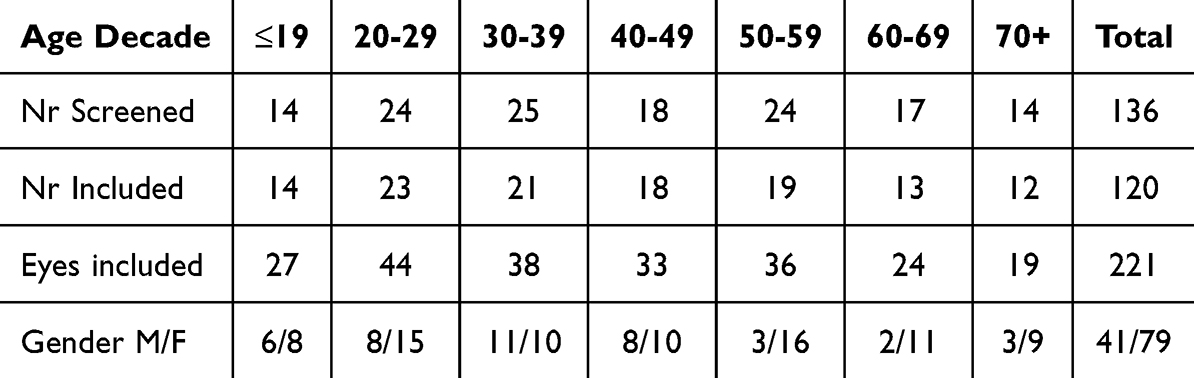 |
Table 1 Patients’ Characteristics |
Statistical Analysis
When both eyes from the same participant were included, they were analysed together at the subject level and always assigned to the same age group. Statistical analyses and model cross-validation were performed using subject-level grouping (ie, both eyes from a given participant were kept in the same fold) to account for within-subject correlation and avoid data leakage or overestimation of performance.
OCT/OCTA Acquisition and Derived Metrics
OCT and OCTA imaging were performed using the AngioVue imaging system of Solix, enabling simultaneous acquisition and automatic registration of structural and vascular data for precise alignment and segmentation. From OCT scans, 478 structural features were extracted, including optic disc area, rim area, retinal nerve fibre layer (RNFL) thickness (global and across temporal, superior, nasal, and inferior quadrants), ganglion cell complex (GCC) thickness, focal loss volume (FLV), global loss volume (GLV), and Bruch’s membrane opening (BMO) parameters. OCTA scans yielded 156 vascular features per eye, encompassing vessel density (VD) in nine Early Treatment Diabetic Retinopathy Study (ETDRS) grid sectors (macula, 6.4 × 6.4 mm², centred on the fovea), eight Garway-Heath sectors (peripapillary, 6 × 6 mm², centred on the optic disc) applied to the radial peripapillary capillary (RPC) network, foveal avascular zone (FAZ) area, FAZ circularity (4π × Area/Perimeter²), FD-300 density (vessel density in a 300-µm-wide annulus around the FAZ), and flow-related indices, derived from the superficial capillary plexus (SCP, internal limiting membrane [ILM] to 10 µm below the inner plexiform layer [IPL]) using AngioAnalytics™ software. VD quantification was limited to the SCP to minimise projection artefacts, which can compromise deeper layer metrics, aligning with established protocols for reliable normative data and glaucoma-relevant vascular analysis.14,15 No deep microvascular dropouts were observed in this healthy cohort, unlike in pathological cases (eg, glaucoma). 16,17 The AngioAnalytics™ software quantified VD, flow area, non-flow area, FAZ parameters, and retinal layer thickness. Macular OCTA scans were centred on the fovea, and optic disc scans included a peripapillary annulus (2.5 mm to 4.5 mm diameter) centred on the BMO-fitted disc circle. The RPC network was visualised as parallel, uniform-diameter vessels surrounding the optic nerve head (ONH), aligned with the RNFL. Motion artefacts were minimised using DualTrac Motion Correction Technology (MCT), combining real-time tracking and post-processing algorithms. OCTA signal generation used the split-spectrum amplitude-decorrelation angiography (SSADA) algorithm, detecting erythrocyte motion across sequential B-scans. Vessel density was calculated as the percentage of pixels surpassing a decorrelation threshold after projection artefact removal (PAR) to reduce superficial vasculature shadowing.
All images were reviewed by an experienced glaucoma specialist (SP) for segmentation accuracy and quality. Scans were excluded if they had a quality score (SQ) <6, signal strength index (SSI) <48, artefacts, segmentation errors, or macular abnormalities (e.g., drusen, epiretinal membranes). High refractive errors were not excluded if image quality was sufficient. Of the initial 264 eyes scanned, 248 eyes from 124 subjects were included after quality control (16 eyes were excluded).
IOP Measurements
To prevent image distortion, eye pressure was measured by calibrated Goldmann tonometry after OCT/OCTA measurements.
Supervised Machine Learning with Support Vector Regression
Support Vector Regression (SVR) was employed to predict biological ocular age based on Principal Component Analysis (PCA) –transformed OCT and OCTA features. We used Group K-fold cross-validation, grouping by subject ID. This ensures that all scans from the same individual are either in the training set or in the test set, never both. This approach prevents intra-subject data leakage and provides a more realistic assessment of model generalisation. This process was repeated five times. The SVR model was retrained from scratch on the training subset for each fold to ensure independent learning and avoid bias from previous iterations. Model performance was evaluated using three metrics averaged across all folds: Mean Absolute Error (MAE), Root Mean Squared Error (RMSE), and R² (Coefficient of Determination). MAE measures the average absolute difference between predicted and actual values, providing a straightforward interpretation of prediction error magnitude in years. RMSE emphasises larger errors by squaring differences before averaging and taking the square root, while R² indicates the proportion of variance in the target variable explained by the model.
Model selection and tuning were performed using grid search within each cross-validation fold. The best-performing model consistently used a linear kernel, with hyperparameters C = 1 and epsilon = 0.1, selected for their balance between fitting accuracy and generalisation. In SVR, the C parameter controls the trade-off between model complexity and tolerance for errors beyond the epsilon margin. In contrast, epsilon defines the threshold below which errors are not penalised. The linear kernel was selected due to the monotonic relationship between age and OCTA parameters. Alternative kernels, including RBF and polynomial, were also tested during the grid search but yielded inferior performance (e.g., RBF: RMSE = 11.28, R² = 0.55), further supporting the adequacy of the linear approach.
All modelling was conducted in Python (v3.9) and Scikit-learn (v1.2).
Dimensionality Reduction with PCA
The OCTA and OCT datasets initially contained too many features, namely 156 vascular features from OCTA and 478 structural features from OCT. Prior to model training, the dataset underwent structured preprocessing to improve signal quality and reduce redundancy. From the initial 634 OCT and OCTA-derived features, 519 were retained after eliminating low-variance and highly correlated variables, retaining 95% variance. This was performed programmatically using standard feature selection methods in Python, supported by visual inspection of correlation matrices. All retained features were standardised to ensure uniform scaling. Dimensionality reduction was then performed using PCA, which yielded 160 uncorrelated components capturing 99.91% of the total variance in the dataset. These components were used as input for supervised regression modelling. However, because PCA transforms the data into uncorrelated components, it is impossible to directly interpret which original variables were most influential in the final model’s predictions.
Results
Vessel density in the macular and peripapillary regions exhibited a progressive decline with advancing age, notably accelerating after the fifth decade, highlighting age-related microvascular changes. Foveal avascular zone (FAZ) area expanded, while its circularity diminished with age, whereas FD-300 density remained relatively stable across the cohort. The support vector regression (SVR) model, when trained solely on OCTA-derived features, demonstrated modest predictive accuracy (R² = 0.268, RMSE = 13.688 years, MAE = 10.752 years). The structural OCT-only model showed slightly better but still limited performance (R² = 0.296, RMSE = 13.061 years, MAE = 10.508years). Integrating structural OCT and vascular OCTA features yielded a highly accurate ocular age prediction model (R² = 0.896, RMSE = 5.025 years, MAE = 4.024 years) under Group K-Fold cross-validation, using 180 PCA-derived features. These results reflect corrections to address data leakage, ensuring PCA was applied only to training data within each cross-validation fold, enhancing model generalisation.
The decade-stratified normative values for macular vessel density are presented in Table 2, and those for peripapillary radial peripapillary capillary (RPC) vessel density are presented in Table 3.
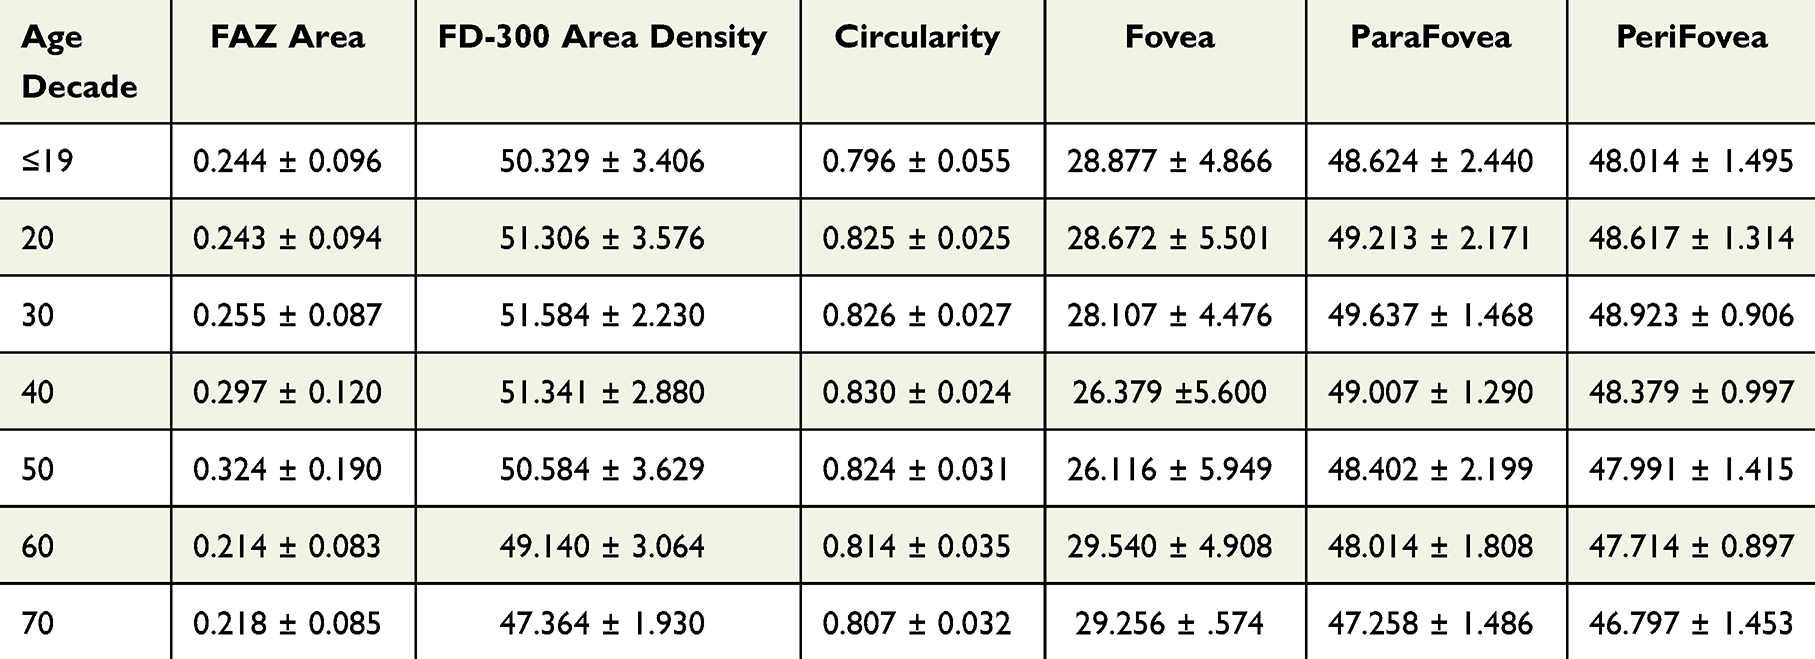 |
Table 2 Macula Normative Table per Age Decade in Our Pilot Study |
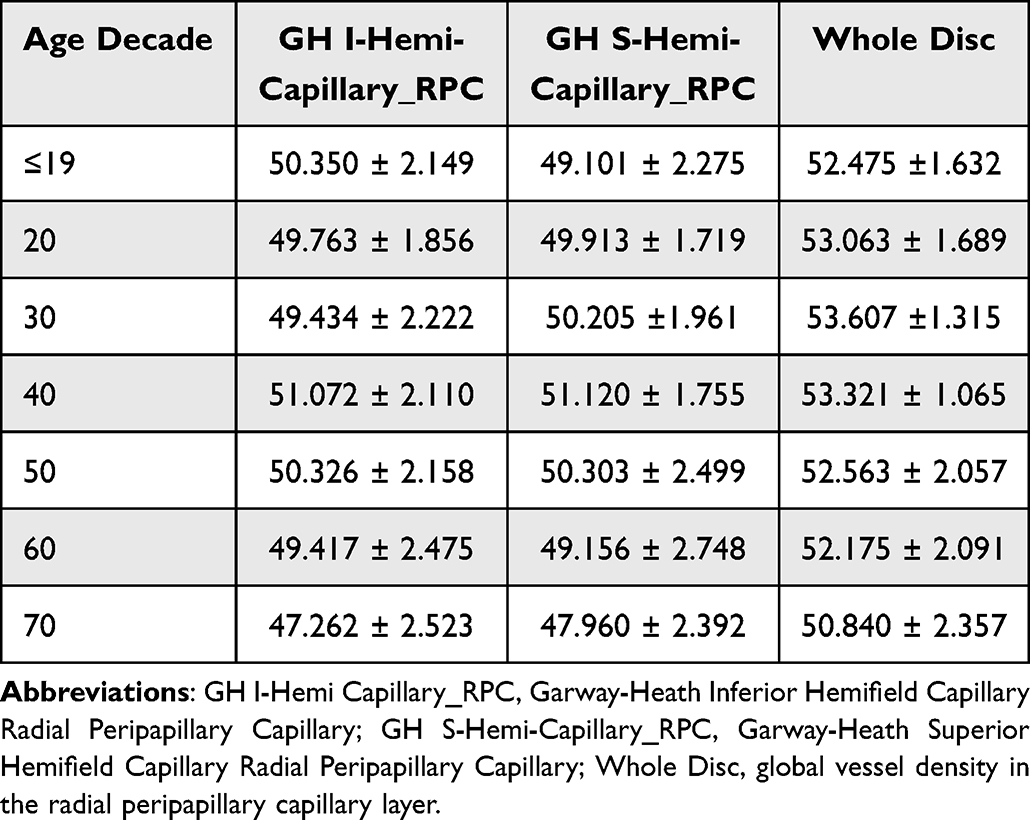 |
Table 3 Normative Capillary RPC Values (Peripapillary) by Age Decade Based on the Garway-Heath Map |
Vascular Ageing Model
The SVR model, trained solely on OCTA-derived vascular features, was evaluated using Group K-fold cross-validation (5 folds) grouped by subject ID. The model achieved an MAE of 10.472 years, an RMSE of 13.688 years, and an R² of 0.268. These results, with 26.8% of the variance in biological age explained, indicate limited generalisation performance, suggesting that vascular features alone partially capture biological ageing but need improvement. The results are shown in Figure 1.
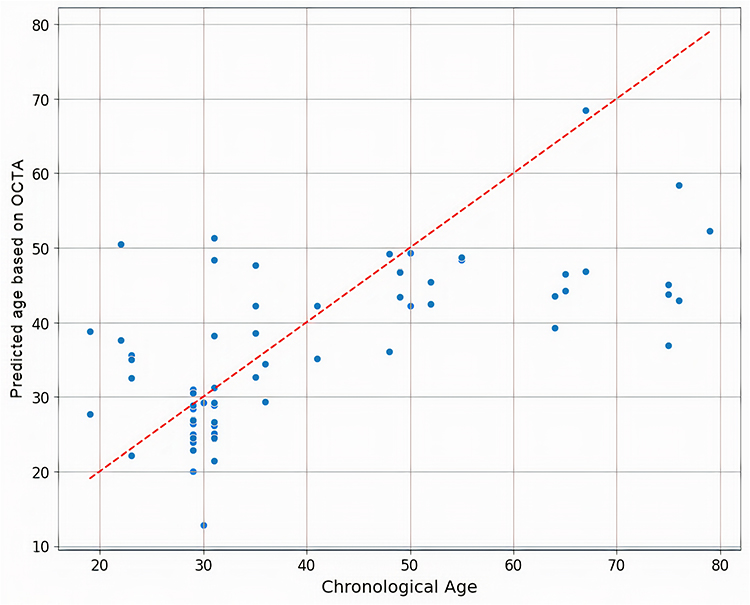 |
Figure 1 Scatterplot of chronological vs predicted vascular age based on OCTA features in a pilot study of healthy eyes. Each blue dot represents an individual test case from GroupKFold cross-validation.. The x-axis denotes chronological age, and the y-axis shows predicted age. The red dashed line represents the ideal prediction (predicted = chronological age), and the scatter indicates model error. |
FAZ Area by Age Decade
The foveal avascular zone (FAZ) increases in area with age. Median values ranged from 0.2 mm² in younger groups (10 to 30 years) and exceeded 0.3mm² after age 50.
A decline was observed thereafter in the 60s and 70s. The variability (SD) also increased with age, reflecting greater interindividual differences. Given the relatively small cohort size per decade and the absence of systematic screening for systemic vascular factors, these results should be interpreted with caution.
FAZ Circularity by Age Decade
FAZ circularity remained stable across the younger age groups (10–40 years), with median values around 0.80. A significant decline was observed after age 50, and continuing to decrease into the 60s and 70s. This trend reflects that FAZ shape irregularity does not substantially worsen with ageing in healthy eyes.
The FD-300 Area Density
FD-300 area density values remained relatively stable across age decades, with only modest changes observed after the fourth decade of life.
A gradual decline was observed thereafter, with values decreasing to 49.1% in the 60s and 47.4% in the 70s. This supports the notion that perifoveal capillary density is largely preserved until later life, when a more noticeable decline occurs.
Vessel Density (VD) in the Macular Superficial Plexus
Vessel density (VD) in the macular superficial plexus showed heterogeneous age-related patterns. In the 1 mm foveal zone (excluding the FAZ), VD declined from 28.9% in the youngest decade to 26.1% in the 50s, before rising again to 29.3% in the 70s, suggesting a non-linear, U-shaped trend rather than a continuous decline. In contrast, parafoveal VD (1–3 mm ring) remained relatively stable across the earlier decades, with values around 49.0–49.6%, but showed a modest reduction after midlife, reaching 47.3% in the 70s. Perifoveal VD (3–6 mm ring) demonstrated the clearest progressive age-related decline, decreasing from 48.0–48.9% in the 10s–30s to 46.8% in the 70s.
RPC Vessel Density by Age Decade
Whole Image
Radial peripapillary capillary (RPC) vessel density declined progressively with age. Mean values remained above 52% in the younger decades but
decreased progressively with age, dropping to 50.8% in the 70s. This pattern confirms a steady reduction in global peripapillary microvascular density in healthy eyes.
Superior Hemisphere RPC
A clear inflexion point was observed after the fifth decade of life, exhibiting a more pronounced vascular decline.
After age 50, a more pronounced decline was observed, with values decreasing to 47.9% in the 70s. This suggests an inflexion point after midlife, with a steeper vascular loss in later decades.
Inferior Hemisphere RPC
The inferior RPC followed a similar trend, with mean values close to 50% in the earlier decades, but declining to 47.3% in the 70s. As in the superior sector, the rate of decline was more marked beyond the fifth decade.
These findings highlight a steeper slope of vascular degeneration in the later decades of life, supporting the hypothesis that age-related neurovascular decline becomes significantly more prominent after age 50.
Structural Ageing Model
The SVR model, trained solely on structural OCT features, achieved an MAE of 10.508 years, a Root Mean Squared Error RMSE of 13.061 years, and an R² of 0.295 under Group K-fold cross-validation. These results, with 29.6% of the variance in biological age explained, indicate limited generalisation. Age-related structural changes in healthy individuals appear subtler and more variable than vascular changes, which limits their predictive power when used alone. A re-run on a matched subset of 334 scans without grouped cross-validation showed modestly improved performance (RMSE = 10.780, R² = 0.624), likely due to data leakage. Applying Group K-fold to the same subset restored performance to the original levels (RMSE = 13.061, R² = 0.296), confirming the limited generalisation of OCT-only features.
Figure 2 presents the results for structural ageing model.
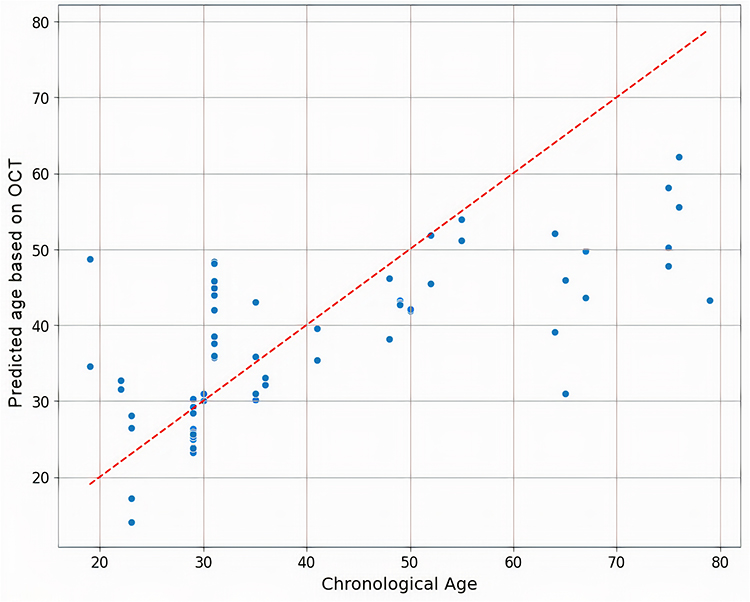 |
Figure 2 Scatterplot of chronological vs predicted structural age based on OCT features in a pilot study of healthy eyes. Each blue dot represents an individual test case from GroupKFold cross-validation. The x-axis denotes chronological age, and the y-axis shows predicted age. The red dashed line represents the ideal prediction (predicted = chronological age), and the scatter indicates model error. |
Combined Structural–Vascular Ageing Model
The SVR model, combining OCT and OCTA features (160 PCA-derived features), achieved improved generalisation performance under Group K-fold cross-validation, with an MAE of 4.0241 years, an RMSE of 5.025 years, and an R² of 0.895. Figure 3 shows the results.
These results, with 89.5% of the variance in biological age explained, confirm that integrating structural and vascular features significantly enhances the accuracy of the “Predicted Ocular Age”.
Figure 3 displays scatter plots comparing “Predicted versus true age for the vascular and structural combined models”, with each blue dot representing an individual patient. The x-axis denotes chronological age, and the y-axis shows predicted age. The red dashed line represents an ideal prediction (predicted age equals chronological age), with scatter indicating model error.Figure 4
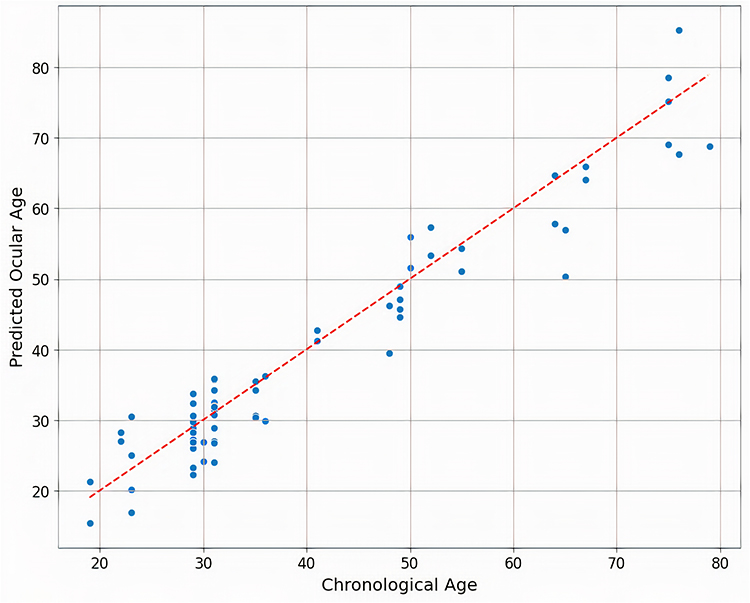 |
Figure 3 Scatterplot of chronological vs “Predicted Ocular Age” based on combined OCT and OCTA features in a pilot study of healthy eyes. Each blue dot represents an individual test case from GroupKFold cross-validation.. The x-axis denotes chronological age, and the y-axis shows predicted age. The red dashed line represents the ideal prediction (predicted = chronological age), and the scatter indicates model error. |
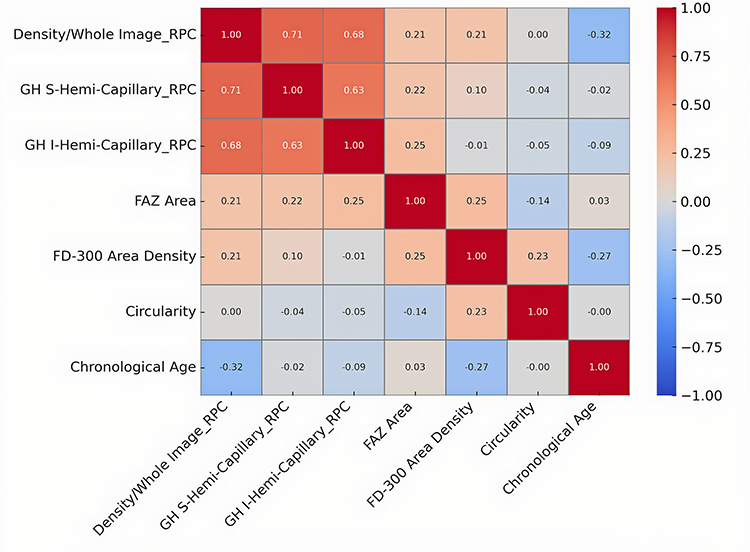 |
Figure 4 The correlation matrix of input features and predicted age. |
Figure 4 presents the correlation matrix of input features and predicted age, highlighting the strong influence of peripapillary and macular vascular density. The combined model’s minimal scatter reflects its high accuracy (RMSE = 5.025 years).
Discussion
In our cohort, peripapillary vessel density (VD) in the radial peripapillary capillary (RPC) network remained relatively stable through the first five decades of life, followed by a gradual decline. Whole-image RPC VD measured 49.598 ± 0.327% in the ≤19 group and decreased to 47.341 ± 0.500% in participants aged ≥70. Macular parafoveal and perifoveal VD showed similar stability until the fifth decade, with a mild reduction thereafter, while foveal VD demonstrated greater variability. These patterns are consistent with previous reports by Chen et al, Teo et al, and Liu et al, though our absolute values are slightly higher, likely reflecting stricter inclusion criteria, segmentation, and scan quality thresholds. Table 4 summarises key methodological differences, highlighting how our decade-stratified dataset complements and extends existing normative OCTA references.
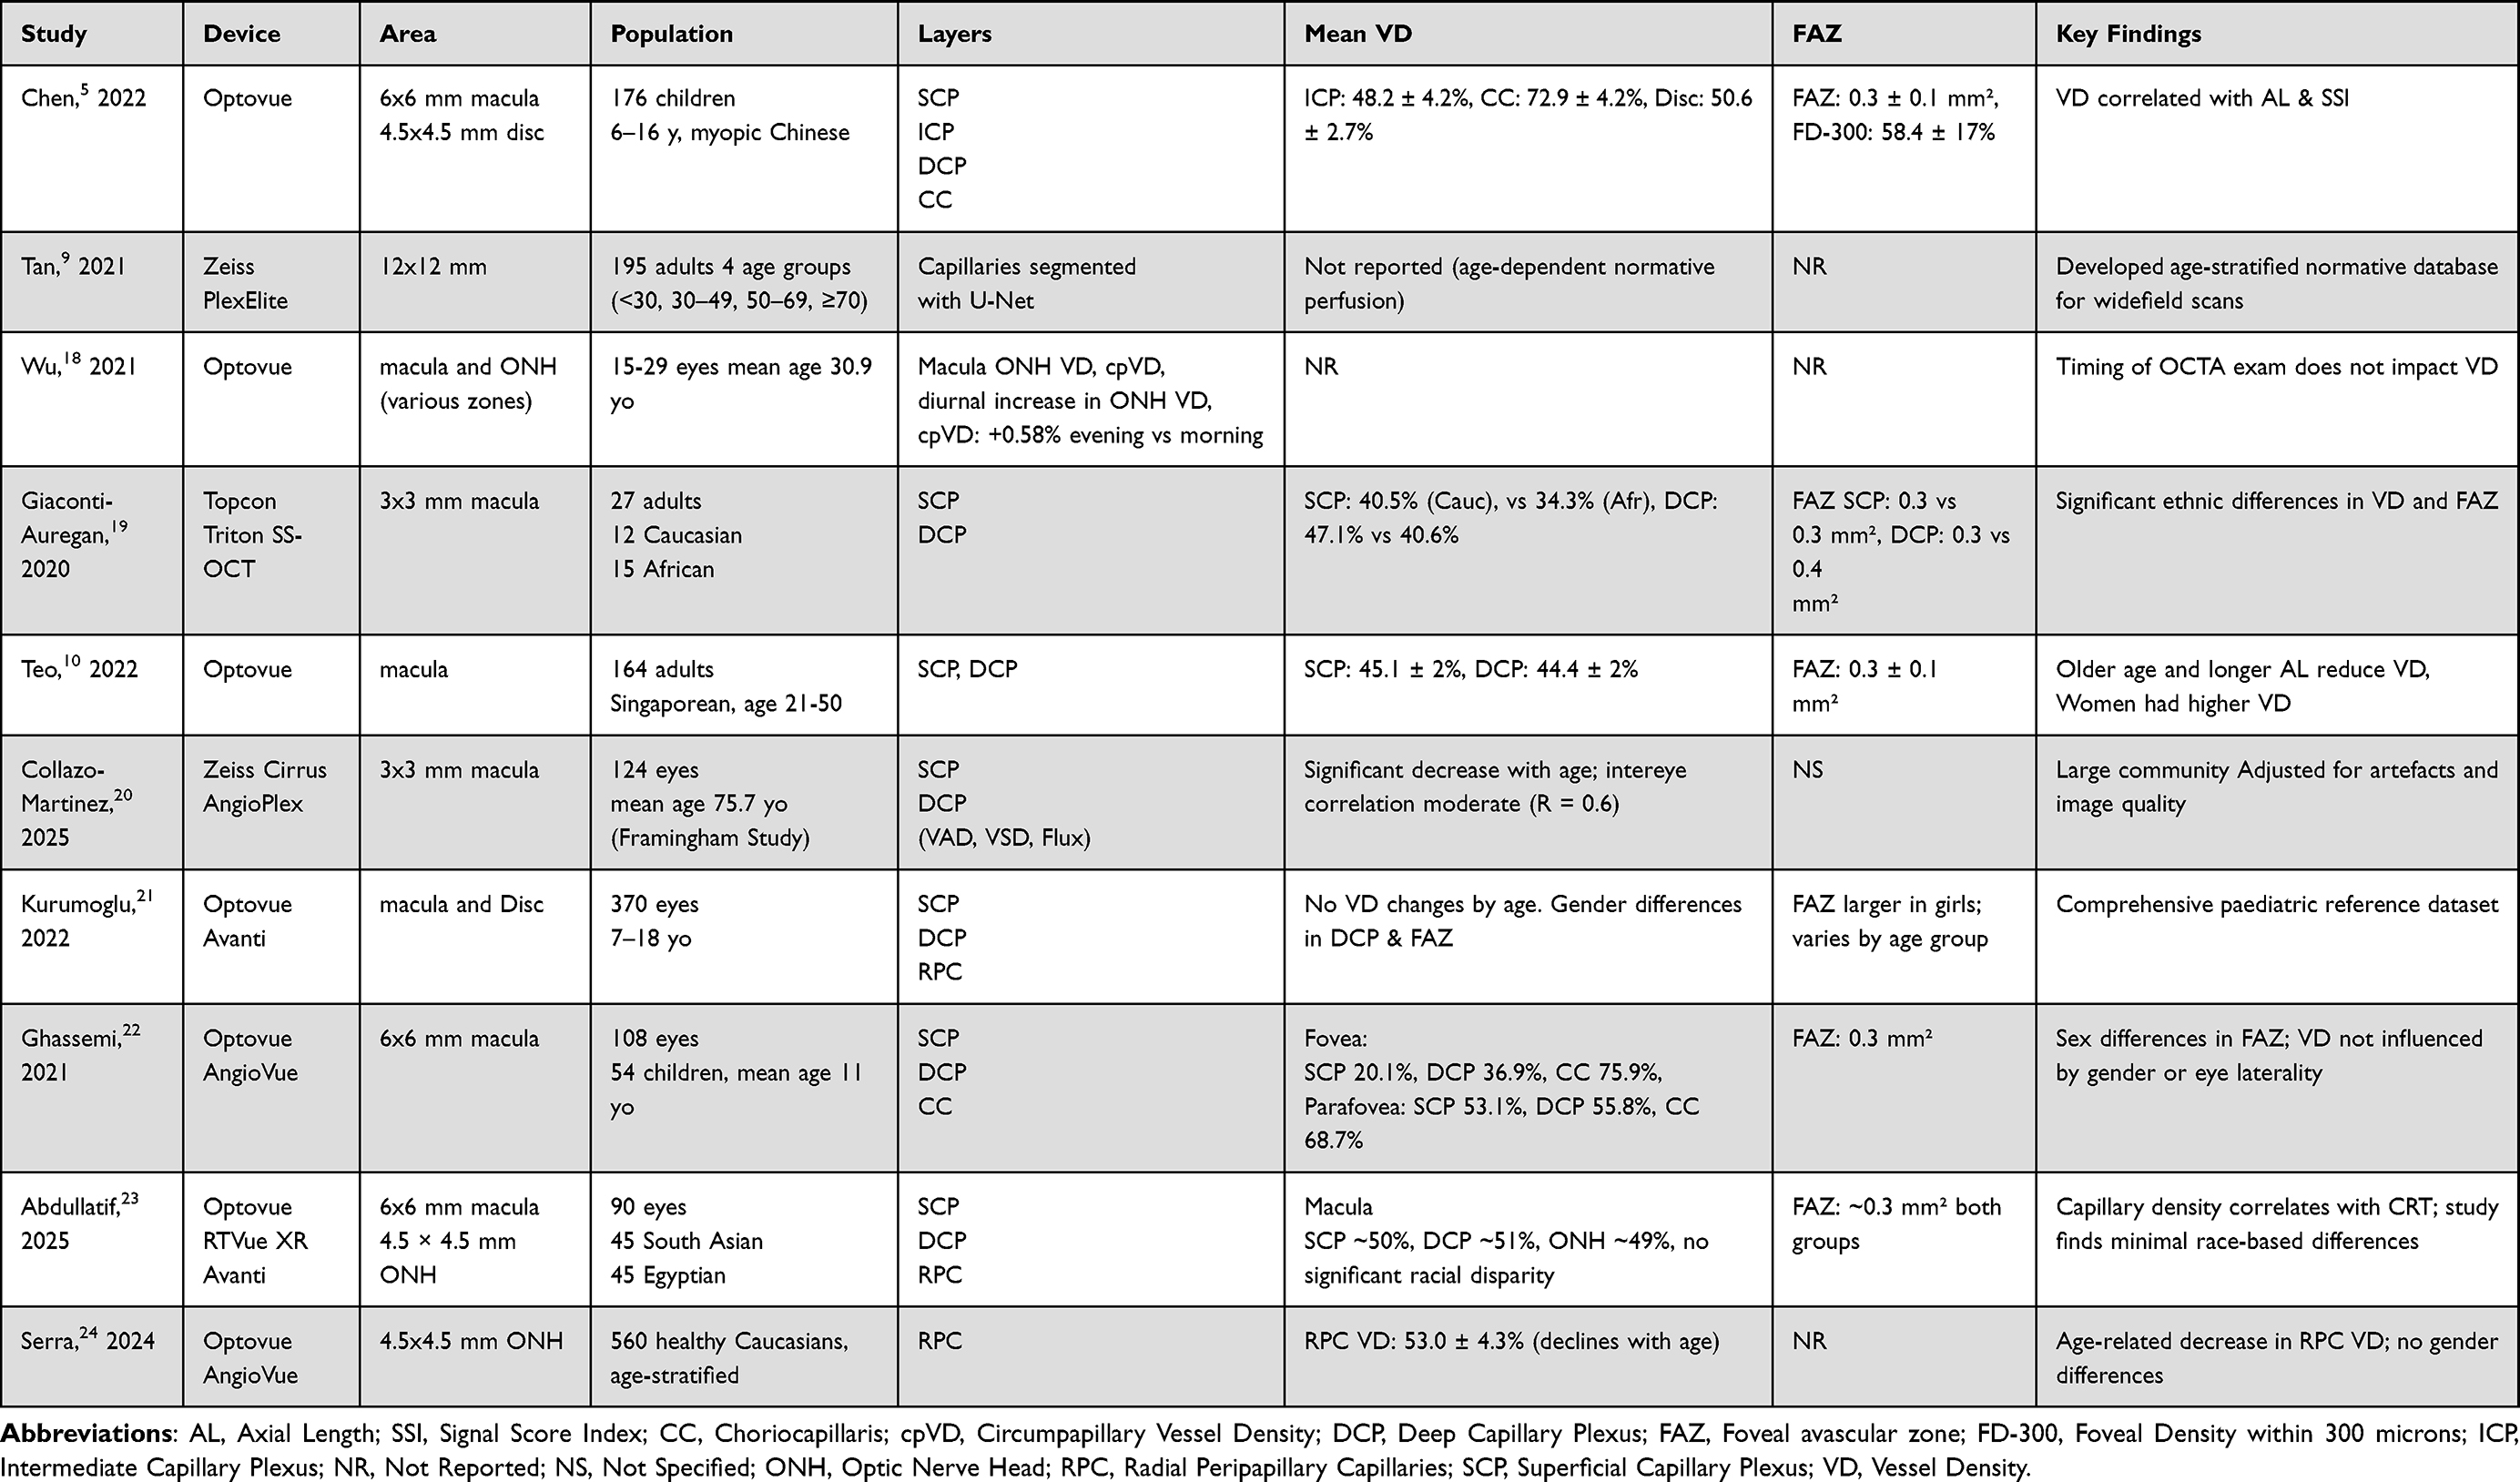 |
Table 4 Comparative Table of Normative OCTA Studies: A Complementary Comparison with This Research |
Why Normative Data Still Matters in AI?
Diagnosing early glaucoma remains difficult due to the anatomical variability of the optic nerve head, even among experienced clinicians, leading to delayed diagnoses and disagreement in borderline cases.25 Normative OCTA datasets serve as a quantitative anchor for both clinical interpretation and AI-based screening, offering reference values that define the expected range of vascular parameters in healthy eyes. Although combining multiple imaging modalities for glaucoma assessment has been explored in research settings, it is not yet widely adopted in routine clinical practice.
In supervised machine learning, good-quality labelled data26 is essential. To train a model that distinguishes normal from glaucomatous OCTA scans, high-quality ground truth data, clearly classified as healthy or diseased, is required. Normative values provide this baseline, enabling the model to detect subtle deviations before glaucoma is fully established. They also reduce the risk of bias and improve accuracy, ensuring the algorithm learns disease-relevant patterns rather than artefacts.
Beyond training, normative data are vital for model validation. Even if an AI system achieves good performance without explicit reference values, clinicians and regulators require evidence that the model generalises to real-world populations. A study by Lee et al illustrates the risk of overfitting: seven AI models trained to detect diabetic retinopathy performed well on curated datasets but showed significant drops in sensitivity and specificity when applied to more diverse, lower-quality real-world images.27 The models had inadvertently learned to associate image clarity with disease status, rather than true pathology. Consistent with the findings of Nunez et al, our normative OCTA dataset supports both AI development and clinical deployment by offering a reliable standard against which models can be trained, validated, and interpreted across diverse populations.28
Interpretability and Clinical Utility
Improved clinical understanding: AI predictions must be clinically interpretable if a machine learning model detects an anomaly in vascular density, it must be compared to normative data to assess its clinical significance. Without such reference frameworks, clinicians may struggle to determine whether the AI output reflects pathology or normal variation. Recent studies using classical ML models, such as Random Forests combined with Shapley additive explanations (SHAP), have demonstrated how explainable AI techniques can help deconstruct complex predictions by assigning importance to each clinical variable, thereby bridging the gap between algorithmic output and clinical reasoning.29
Generalisation and Transfer Learning
While classical machine learning models such as those using Kalman filters are not examples of transfer learning, they share a foundational principle: using prior data to enhance future prediction. Kazemian et al demonstrated that filtering techniques grounded in normative baselines could accurately forecast glaucoma progression by integrating longitudinal visual field data. Similarly, in our approach, pre-training deep learning models on healthy eyes allow the model to internalise age-related vascular and structural trajectories before encountering pathology.30 This strategy enhances generalisability and aligns with the concept of transfer learning, where knowledge acquired from a source domain (e.g. normative ageing) is leveraged to improve learning in a target domain (eg, glaucomatous progression).
Outlier Detection and Early Diagnosis
Some early glaucoma cases may fall into a grey zone, where they are not yet classified as glaucoma but already deviate from normal structural or vascular parameters. Machine learning models like k-nearest neighbour (k-NN) can identify these borderline cases by comparing a patient’s imaging features to those of similar individuals in a labelled dataset.31 Establishing a normative OCTA dataset improves ML algorithms’ sensitivity to subtle changes and their ability to flag statistical outliers before functional damage occurs. Therefore, it is critical not just for clinical interpretation but also for SVR model training and validation.
Modality Selection for AI Tasks
In a previous study from our group, we trained a CNN with intermediate fusion to classify glaucoma from healthy eyes using structural OCT and vascular OCTA inputs.32 Interestingly, we found that a vascular-only model combining macular and optic disc OCTA outperformed the full OCT + OCTA fusion input for classification accuracy. In contrast, the present study focuses on a different goal: predicting biological ageing. Here, we introduce the concept of Predicted Ocular Age, estimated using a support vector regression (SVR) model trained on combined structural and vascular inputs. Unlike classification tasks, modelling normative ageing requires capturing subtle, non-linear changes in healthy individuals across decades. In this context, both structural and vascular features contribute uniquely to age-related variation.
This distinction underscores the importance of modality-task alignment: vascular features may dominate in disease classification, but a combined approach is more appropriate for age estimation and ΔAge biomarker development.
Interpretation of SVR Results
We tested both linear and non-linear SVR kernels, including the radial basis function (RBF), to model vascular and structural ageing. Despite the biological complexity, the linear kernel performed best, indicating that age-related changes in OCT/OCTA features follow a predominantly linear trend in healthy individuals. This suggests that key ageing markers evolve consistently and measurably. Based on Group K-Fold (subject-level) validation, both models, the OCT-only and the OCTA-only model, showed fair generalisation (R² = 0.296, 0.268, respectively). However, when both modalities are combined and the model is trained jointly on the merged feature space, the performance improves drastically (R² = 0.895), thanks to the complementary information across structural and vascular domains.
Limitations
This study used both eyes; the raw data may be overfitting due to the correlation between the two eyes. However, PCA addressed this, and no overfitting was observed in this study. Future studies may consider using one eye per subject to avoid intra-subject redundancy. The sample size is still small. It is challenging to find subjects, especially males after 50, without cardiovascular treatment. Health status was self-reported, which may overlook undiagnosed confounders; however, all participants underwent thorough fundus examination with no clinically visible changes, minimising the risk of undiagnosed conditions such as diabetic retinopathy.
Conclusion
This pilot study establishes decade-stratified normative OCTA metrics in a rigorously screened healthy eyes and shows that combining OCT and OCTA features markedly improves AI-based ocular age prediction (R² = 0.895). These findings provide preliminary evidence supporting the potential of multimodal imaging for future glaucoma risk stratification, highlighting the need for further validation in larger clinical populations to bridge gaps in vascular ageing research.
Disclosure
The authors report no conflicts of interest in this work.
References
1. Breusegem C, Fieuws S, Stalmans I, Zeyen T. Ingeborg Stalmans, and Thierry Zeyen. Agreement and accuracy of non-expert ophthalmologists in assessing glaucomatous changes in serial stereo optic disc photographs. Ophthalmology. 2010;118(4):742–746. doi:10.1016/j.ophtha.2010.08.019
2. Jampel H, Friedman D, Quigley H, et al. Agreement among glaucoma specialists in assessing progressive disc changes from photographs in open-angle glaucoma patients. Am J Ophthalmol. 2008;147:39–44.e1. doi:10.1016/j.ajo.2008.07.023
3. Pourjavan S, Bourguignon GH, Marinescu C, Otjacques L, Boschi A. Evaluating the influence of clinical data on inter-observer variability in optic disc analysis for AI-assisted glaucoma screening. Clin Ophthalmol. 2024;18:3999–4009. PMID: 39741794; PMCID: PMC11687089. doi:10.2147/OPTH.S492872
4. Simonett JM, Huang D, Jia Y. Quantitative optical coherence tomography angiography of the peripapillary circulation in glaucoma. Ann Eye Sci. 2017;2:8. PMID: 30167572; PMCID: PMC6112822. doi:10.21037/aes.2017.01.03
5. Chen R, Lian H, McAlinden C, et al. Normative data and determinants of macular, disc, and peripapillary vascular density in healthy myopic children using optical coherence tomography angiography. Front Med Lausanne. 2022;9:890294. PMID: 35801213; PMCID: PMC9253463. doi:10.3389/fmed.2022.890294
6. Yarmohammadi A, Zangwill LM, Diniz-Filho A, et al. Relationship between Optical Coherence Tomography Angiography Vessel Density and Severity of Visual Field Loss in Glaucoma. Ophthalmology. 2016;123(12):2498–2508. PMID: 27726964; PMCID: PMC5362128. doi:10.1016/j.ophtha.2016.08.041
7. Akagi T, Zangwill LM, Shoji T, et al. Optic disc microvasculature dropout in primary open-angle glaucoma measured with optical coherence tomography angiography. PLoS One. 2018;13(8):e0201729. PMID: 30086177; PMCID: PMC6080778. doi:10.1371/journal.pone.0201729
8. Su B, Zhu X, Yang K, et al. Age- and sex-related differences in the retinal capillary plexus in healthy Chinese adults. Eye Vis. 2022;9(1):38. PMID: 36180939; PMCID: PMC9526290. doi:10.1186/s40662-022-00307-0
9. Tan B, Sim YC, Chua J, et al. Developing a normative database for retinal perfusion using optical coherence tomography angiography. Biomed Opt Express. 2021;12(7):4032–4045. PMID: 34457397; PMCID: PMC8367249. doi:10.1364/BOE.423469
10. Teo ZL, Sun CZ, Chong CCY, et al. normative data and associations of OCT angiography measurements of the Macula: the Singapore Malay Eye Study. Ophthalmol Retina. 2022;6(11):1080–1088. PMID: 35580772. doi:10.1016/j.oret.2022.05.010
11. Borrelli E, Mastropasqua R, Querques G, Sacconi R, Senatore A, Bandello F. Age-related changes in optical coherence tomography angiography metrics in healthy eyes: a systematic review and meta-analysis. Surv Ophthalmol. 2023;68(6):1053–1063. PMID: 37482307. doi:10.1016/j.survophthal.2023.07.004
12. Karbassi E, Shams A, Rahat F, et al. Retinal age derived from OCT and its association with systemic health outcomes: insights from the UK Biobank. Invest Ophthalmol Vis Sci. 2024;65(7):ARVOE–Abstract3184. doi:10.1167/iovs.65.7.3184
13. Liu Y, Zhang Z, Tian W, et al. A multimodal foundation model for retinal image-based biological age prediction and systemic disease classification. Front Artif Intell. 2025;7:1324567. PMID: 38235214; PMCID: PMC10796321. doi:10.3389/frai.2024.1324567
14. Camino A, Zhang M, Gao SS, Jia Y, Huang D. Evaluation of artifact reduction in optical coherence tomography angiography with real-time tracking and motion correction technology. Biomed Opt Express. 2017;8(10):4517–4530. PMID: 29082088; PMCID: PMC5654800. doi:10.1364/BOE.8.004517
15. Jia Y, Wei E, Wang X, et al. Optical coherence tomography angiography of optic disc perfusion in glaucoma. Ophthalmology. 2014;121(7):1322–1332. PMID: 24629697; PMCID: PMC4070786. doi:10.1016/j.ophtha.2014.01.021
16. Shin JW, Kwon J, Lee J, Kook MS. Choroidal microvasculature dropout is not associated with myopia, but is associated with glaucoma. J Glaucoma. 2018;27(2):189–196. PMID: 29271810. doi:10.1097/IJG.0000000000000859
17. Rao HL, Sreenivasaiah S, Riyazuddin M, et al. Choroidal microvascular dropout in primary angle closure glaucoma. Am J Ophthalmol. 2019;199:184–192. PMID: 30552893. doi:10.1016/j.ajo.2018.11.021
18. Wu JH, Penteado RC, Moghimi S, Zangwill LM, Proudfoot JA, Weinreb RN. Diurnal variation of retinal vessel density in healthy human eyes. J Glaucoma. 2021;30(9):820–826. PMID: 34172629; PMCID: PMC8405550. doi:10.1097/IJG.0000000000001903
19. Giocanti-Aurégan A, Gazeau G, Hrarat L, et al. Ethnic differences in normal retinal capillary density and foveal avascular zone measurements. Int Ophthalmol. 2020;40(11):3043–3048. PMID: 32601962. doi:10.1007/s10792-020-01488-0
20. Collazo Martinez AD, Ting SJ, Shahidzadeh A, et al. OCT angiography-derived retinal capillary perfusion measures in the Framingham Heart Study. Ophthalmol Sci. 2024;5(3):100696. PMID: 40124307; PMCID: PMC11926700. doi:10.1016/j.xops.2024.100696
21. Incekalan T K, Şimdivar GH N, Ü Ç, Alyamaç Sukgen E, Özdemir U. Optical coherence tomography angiography in healthy children: normative data and age-related changes in microvascular structure of the optic disk and macula. Int Ophthalmol. 2022;42(8):2373–2383. PMID: 35122180. doi:10.1007/s10792-022-02236-2
22. Ghassemi F, Hatami V, Salari F, et al. Quantification of macular perfusion in healthy children using optical coherence tomography angiography. Int J Retina Vitreous. 2021;7(1):56. PMID: 34600586; PMCID: PMC8487563. doi:10.1186/s40942-021-00328-2
23. Abdullatif AM, Moamnlhaq AM, Macky TA, Edris NA. Retinal capillary density among healthy Egyptian and South Asian students: an optical coherence tomography angiography study. Int J Ophthalmol. 2025;18(1):111–116. PMID: 39829632; PMCID: PMC11672091. doi:10.18240/ijo.2025.01.13
24. Serra R, Pinna A, Angius A, et al. Vascular density normative data of radial peripapillary capillary plexus in healthy Caucasian subjects. Graefes Arch Clin Exp Ophthalmol. 2025;263(1):97–103. PMID: 39212801; PMCID: PMC11807058. doi:10.1007/s00417-024-06623-6
25. Gandhi M, Dubey S. Evaluation of the optic nerve head in glaucoma. J Curr Glaucoma Pract. 2013;7(3):106–114. PMID: 26997792; PMCID: PMC4741153. doi:10.5005/jp-journals-10008-1146
26. Armstrong GW, Lorch AC. A(eye): a review of current applications of artificial intelligence and machine learning in ophthalmology. Int Ophthalmol Clin. 2020;60(1):57–71. PMID: 31855896. doi:10.1097/IIO.0000000000000298
27. Lee AY, Yanagihara RT, Lee CS, et al. Multicenter, head-to-head, real-world validation study of seven automated artificial intelligence diabetic retinopathy screening systems. Diabetes Care. 2021;44(5):1168–1175. PMID: 33402366; PMCID: PMC8132324. doi:10.2337/dc20-1877
28. Nunez R, Harris A, Ibrahim O, et al. Artificial intelligence to aid glaucoma diagnosis and monitoring: state of the art and new directions. Photonics. 2022;9:810. doi:10.3390/photonics9110810
29. Lee EJ, Kim TW, Kim JA, Lee SH, Kim H. Predictive modeling of long-term glaucoma progression based on initial ophthalmic data and optic nerve head characteristics. Transl Vis Sci Technol. 2022;11(10):24. PMID: 36251319; PMCID: PMC9586140. doi:10.1167/tvst.11.10.24
30. Kazemian P, Lavieri MS, Van Oyen MP, Andrews C, Stein JD. Personalized prediction of glaucoma progression under different target intraocular pressure levels using filtered forecasting methods. Ophthalmology. 2018;125(4):569–577. PMID: 29203067; PMCID: PMC5866175. doi:10.1016/j.ophtha.2017.10.033
31. Septiarini A, Khairina DM, Kridalaksana AH, Hamdani H. Automatic glaucoma detection method applying a statistical approach to fundus images. Healthc Inform Res. 2018;24(1):53–60. PMID: 29503753; PMCID: PMC5820087. doi:10.4258/hir.2018.24.1.53
32. Pourjavan S, Gouverneur F, Macq B, et al. Advanced analysis of OCT/OCTA images for accurately differentiating between glaucoma and healthy eyes using deep learning techniques. Clin Ophthalmol. 2024;18:3493–3502. PMID: 39618988; PMCID: PMC11607993. doi:10.2147/OPTH.S472231
 © 2025 The Author(s). This work is published and licensed by Dove Medical Press Limited. The
full terms of this license are available at https://www.dovepress.com/terms
and incorporate the Creative Commons Attribution
- Non Commercial (unported, 4.0) License.
By accessing the work you hereby accept the Terms. Non-commercial uses of the work are permitted
without any further permission from Dove Medical Press Limited, provided the work is properly
attributed. For permission for commercial use of this work, please see paragraphs 4.2 and 5 of our Terms.
© 2025 The Author(s). This work is published and licensed by Dove Medical Press Limited. The
full terms of this license are available at https://www.dovepress.com/terms
and incorporate the Creative Commons Attribution
- Non Commercial (unported, 4.0) License.
By accessing the work you hereby accept the Terms. Non-commercial uses of the work are permitted
without any further permission from Dove Medical Press Limited, provided the work is properly
attributed. For permission for commercial use of this work, please see paragraphs 4.2 and 5 of our Terms.
Recommended articles
The Effect of Myopia on Vessel Density in Glaucomatous Patients by Optical Coherence Tomography Angiography
AM S, Anany M, Awwad MA, Sanad E, Eltohamy SM
Clinical Ophthalmology 2023, 17:2429-2441
Published Date: 17 August 2023