Back to Journals » Clinical Interventions in Aging » Volume 17
Age-Related Changes in Trabecular Bone Score and Bone Mineral Density in Chinese Men: A Cross-Sectional and Longitudinal Study
Authors Tang H, Di W, Qi H, Liu J, Yu J, Cai J, Lai B, Ding G, Cheng P
Received 18 January 2022
Accepted for publication 30 March 2022
Published 7 April 2022 Volume 2022:17 Pages 429—437
DOI https://doi.org/10.2147/CIA.S358951
Checked for plagiarism Yes
Review by Single anonymous peer review
Peer reviewer comments 2
Editor who approved publication: Dr Maddalena Illario
Huan Tang, Wenjuan Di, Hanmei Qi, Juan Liu, Jing Yu, Jinmei Cai, Bing Lai, Guoxian Ding, Peng Cheng
Department of Gerontology, The First Affiliated Hospital of Nanjing Medical University, Nanjing, People’s Republic of China
Correspondence: Peng Cheng, Department of Gerontology, The First Affiliated Hospital of Nanjing Medical University, No. 300 Guangzhou Road, Nanjing, 210029, Jiangsu, People’s Republic of China, Tel +86-25-68305171, Fax +86-25-83724440, Email [email protected]
Purpose: This study was designed to explore age-related changes in trabecular bone score (TBS) and bone mineral density (BMD) in Chinese men through cross-sectional and longitudinal studies.
Patients and Methods: We included adult men who had at least twice TBS and BMD examinations in our hospital between January 2013 and December 2020. All men were divided into an age subgroup per 10 years, comparing differences in baseline lumbar spine (LS) TBS and BMD at various parts between each age group and analyzing age-related changes in TBS and BMD during follow-up.
Results: Baseline data showed that in men aged 36 to 85 years, BMD in the hip region showed a decreasing trend with age (P for trend < 0.01). However, TBS reached a high value around the age of 50, after which it decreased with age (P for trend = 0.03). During a mean follow-up of 3 years, the average annual change rate at TBS was − 0.17% in men aged 36 to 85 years, with the fastest decrease rate − 1.08% at 66 to 75 years (P < 0.05). The mean annual rate of change in LS BMD in different age subgroups increased with age (P for trend = 0.001). There was no significant decrease in mean annual change in BMD in hip regions.
Conclusion: In men aged 36∼ 85 years, the trend of TBS was inconsistent with BMD. Men experience a high value of LS TBS around age 50, later than the commonly believed age of peak BMD, which may reflect developmental differences between bone microstructure and bone minerals. The TBS may be used as a better indicator of changes in bone strength than BMD in adult men at short-term follow-up. The rapid loss of TBS at age 66 to 75 may have implications for the prevention and medication of osteoporosis in men.
Keywords: age-related, bone loss, bone mineral density, men, osteoporosis, trabecular bone score
Plain Language Summary
In this study, we conducted a cross-sectional and longitudinal study of trabecular bone score (TBS) and bone mineral density (BMD) in Chinese men and explored age-related changes in TBS and BMD. We included adult men who had undergone at least 2 BMD and TBS examinations at our hospital between January 2013 and December 2020. We divided all men into age groups of every 10 years, compared the differences in baseline lumbar spine (LS) TBS and BMD at each site between age groups, and analyzed the age-related changes in TBS and BMD during follow-up. In men aged 36 ~ 85 years, the results showed that the LS TBS reached a high value around 50 years in the baseline data. During a mean follow-up of 3 years, the mean annual rate of change in lumbar spine bone score was −0.17% in Chinese men aged 36 to 85 years, with the fastest decrease rate of −1.08% in those aged 66 to 75 years. We conclude that in men aged 36 ~ 85 years, the changing trend of TBS was inconsistent with BMD. Men experience a high value of LS TBS around age 50, later than the commonly believed age of peak BMD, which may reflect developmental differences between bone microstructure and bone minerals. TBS may be used as an indicator of better bone strength changes than BMD at short-term follow-up in adult males. The rapid loss of TBS at age 66 to 75 may have significance for the prevention and medication of osteoporosis in men.
Introduction
Bone mineral density (BMD) is one of the critical determinants of bone strength and fracture risk1 and has been used as a standard indicator for the diagnosis of osteoporosis. However, some studies have found considerable overlap in bone mineral density values between patients with fractures and those without in recent years.2 Other factors that influence bone strength and fracture risk include the macroscopic and microstructure of cortical bone (including cortical porosity), bone turnover, and microarchitecture and mineralization of trabecular bone.3,4 The trabecular bone score (TBS) is a texture parameter that evaluates gray pixel changes in the lumbar spine (LS) dual X-ray absorptiometry (DXA) images. It has been proposed as a clinical tool to assess bone microarchitecture.5 Although TBS is derived from the same DXA scan that measures BMD, TBS provides a different set of information about bone structure and bone strength than BMD measurements.6 MrOS7 and other cohorts8,9 have shown that TBS is associated with severe osteoporosis and fragility fractures and is independent of hip and lumbar BMD. Furthermore, TBS has been shown to identify subjects with degenerated bone microstructures whose BMD reflects normal or reduced bone mass on DXA, with added value relative to BMD for determining bone strength and fragility fracture risk.10 In recent years, studies have explored the reasons for the inconsistent degree of degeneration of TBS and BMD, including age, degenerative disease, certain endocrine diseases (such as diabetes), obesity, and so on.11–13 The effect of these factors on bone strength is more likely due to affecting the microstructure of bone rather than BMD, resulting in a greater degree of TBS degradation.
Peak bone strength is considered an important marker of bone strength, osteoporosis risk, and fracture risk in later life.14 So far, the study of peak bone strength has focused on peak BMD. In some cross-sectional studies, TBS gradually decreased with increasing age in men.15–17 However, it is unclear about the trend of TBS in different age groups and whether there is a TBS peak.
Bone loss with aging is an essential feature of osteoporosis in men.18 Low bone mass and rapid bone loss may be markers of poor health, leading to fragility fractures19 and increasing the risk of death.20,21 Numerous previous studies have reflected longitudinal changes in BMD in men.21–23 In recent years, more attention has been received to longitudinal changes in TBS. In the MrOS cohort, follow-up studies for older men showed an annual change rate in TBS of −0.25%.24 A study in Korea showed an annual rate of change in TBS of −0.27% in men with a mean age of 61.4 years.25 Nevertheless, longitudinal changes in TBS have not been reported in Chinese adults.
Therefore, this study aimed to explore the age-related changes in TBS and BMD in Chinese men through cross-sectional and longitudinal studies.
Patients and Methods
Study Population
The study was approved by the Ethics Committee of the First Affiliated Hospital with Nanjing Medical University and conformed to the provisions of the Declaration of Helsinki (revised in Brazil in 2013). Written informed consent was obtained from all subjects, and the patients were anonymized.
All subjects were recruited from Nanjing (China) and its surrounding areas and underwent regular physical examinations in our hospital. All subjects underwent a detailed medical history taking and physical examination, and data from each of their physical examinations were recorded. In this study, we collected 325 adult men, aged between 29 and 94 years, who had undergone at least twice TBS and BMD examinations in our hospital from January 2013 to December 2020. Subjects with the following diseases were excluded: ever or receiving drugs for bone metabolism, such as glucocorticoids, bisphosphonates, hormone replacement therapy; combined with other conditions that seriously affect bone metabolisms, such as endocrine tumors, chronic kidney disease, ankylosing spondylitis, rheumatic diseases; the presence of severe malnutrition, such as malignant tumors, subtotal gastrectomy, and intestinal resection; the presence of diseases after lumbar, hip surgery or other illnesses that affect the detection. In addition, we excluded study subjects with body mass index (BMI) ≥ 35 kg/m2 because TBS was ineffective above this threshold. Subjects with an interval between two follow-ups of less than 0.9 years were also excluded. In this study, due to insufficient sample size, we excluded subjects whose baseline age was less than 35 years and more than 86 years. Finally, 290 men (mean age 59 years) were included in the study. The first and last measurements of BMD and LSTBS were recorded for each subject.
Measurement of BMD
DXA scans were performed and analyzed in the First Affiliated Hospital with Nanjing Medical University by manufacturer recommendations. BMD measurements were recorded at the lumbar spine for L1 to L4 (L1-L4), the femoral neck, and the total hip. Hip T-scores were calculated using reference values revised for NHANESIII Caucasian women. All scans were centrally reprocessed using the same software (Hologic Discovery W). BMD was determined by automated analysis, with technician alteration if necessary. The densitometry used in this study had not reported any amplification effect. Instruments used in this study exhibited stable long-term performance (coefficient of variation < 0.5%) and satisfactory in vivo precision. The least significant changes (g/cm2) at lumbar spine (LS), total hip (TH), and femoral neck (FN), and TBS with 95% confidence level were 0.02, 0.04, 0.05, and 0.07, respectively.
Measurement of TBS
All TBS measurements were performed in the Department of Geriatrics, the First Affiliated Hospital of Nanjing Medical University, using the TBSiNsight software (version 2.0.0.1, Med-Imaps, Bordeaux, France). Each lumbar spine’s original DXA images were uploaded into the TBS iNsight software. LS TBS was then evaluated using the patented algorithm in the same regions of measurement as those used for the LS BMD (mask of the region of interest and edge detection were copied from the DXA scans), with LS TBS calculated as the mean value of the individual measurements for vertebrae L1–L4.
Statistical Analysis
The average annual bone change rate for each study subject was calculated as follows:

In this study, the average annual change rate was used to reflect the longitudinal changes in TBS and BMD, using the mean age of the subjects twice tested as a grouping basis and divided into an age subgroup per 10 years. When analyzing baseline data, subjects were divided into an age subgroup every ten years based on the age of the first detection. Differences between BMD, TBS, and mean annual change rates were compared between different age groups using a one-way analysis of variance (ANOVA). The trends of TBS and BMD baseline measurements and average annual change rate in men of all age subgroups were studied by trend test. Normally distributed measurement data were expressed as mean ± standard deviation (SD). SPSS V25.0 statistical software was used in this study. P < 0.05 was considered statistically significant.
Results
Baseline Characteristics of the Study Population
The baseline characteristics of the study subjects are shown in Table 1. A total of 290 men were included in this study, with a mean age of 59 years (SD=11.7, range 36 to 85), a mean body mass index (BMI) of 24.3 kg/m2 (SD=2.0, range 16.3 to 33.8), and a mean follow-up interval of 3.1 years (range 0.9 to 7.8). All subjects were divided into an age subgroup of 10 years based on the age at first detection. BMD of the hip region (total hip + femoral neck) showed a downward trend in each age group (total hip, P for trend=0.005; femoral neck, P for trend < 0.001) by linear trend test, while the LS (L1-4) BMD showed no significant difference between age subgroups. Meanwhile, TH BMD measurements decreased from 0.945 g/cm2 (36–45 years) to 0.878 g/cm2 (76–85 years); FN BMD measurements decreased from 0.830 g/cm2 (36–45 years) to 0.722 g/cm2 (76–85 years). (Figure 1). Further analysis of BMD at individual vertebrae from L1 to L4 revealed that there was no significant difference in BMD of L1, L2, and L3 between age subgroups (P for trend all > 0.05). L4 BMD increased with age (P for trend = 0.03). (Figure 2). In addition, the quadratic term trend test showed that LS TBS was highest at 1.319 at 46 to 55 years among men aged 36 to 85 years, and then showed a decreasing trend with increasing age (P for trend=0.03). (Figure 3).
 |
Table 1 Baseline Characteristics of the Study Population |
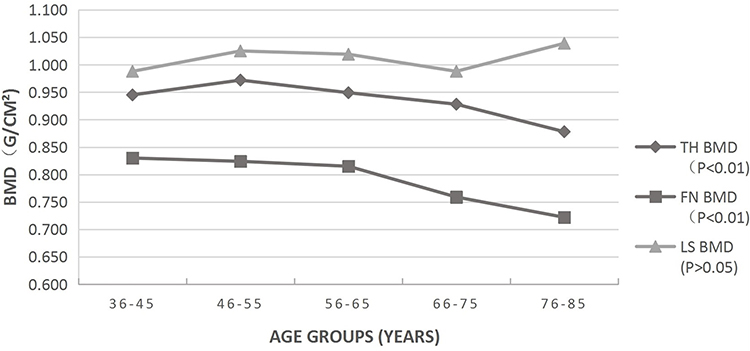 |
Figure 1 Average bone mineral density (BMD) at the total hip (TH), femoral neck (FN), and lumbar spine (LS) in 10-year age subgroups. P for trend according to the 10-year age subgroups using linear trend test. |
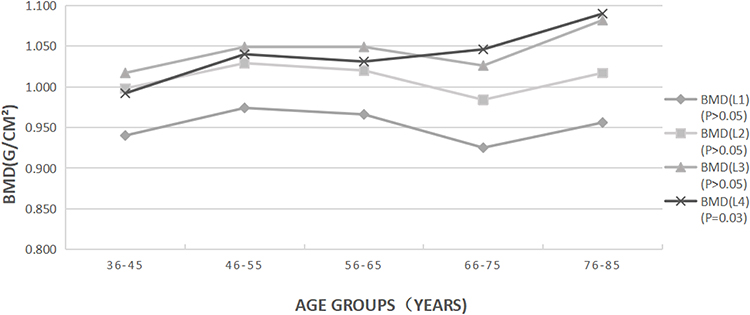 |
Figure 2 Average bone mineral density (BMD) from L1 to L4 separately in 10-year age subgroups. P for trend according to the 10-year age subgroups using linear trend test. |
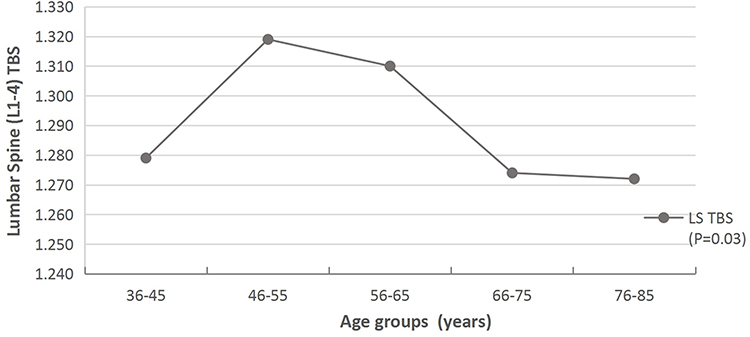 |
Figure 3 Average trabecular bone score (TBS) at the lumbar spine (LS) in 10-year age subgroups. P for trend according to the 10-year age subgroups using quadratic term trend test. |
The Average Annual Change Rate of BMD at Each Site and LS TBS
Table 2 shows the average annual change rate of BMD at each site and LS TBS in different age subgroups. A negative average annual change rate indicates bone loss during follow-up, and a positive rate indicates bone gain. The mean annual change rate of all men at LS TBS was −0.17%, and that of the lumbar spine, femoral neck, and total hip BMD were 0.77%, −0.09%, and 0.16%, respectively. According to the average age before and after follow-up, all men were divided into one age subgroup per 10 years. The average annual rate of change of LS TBS in the five groups (36–45, 46–55, 56–65, 66–75, 76–85) were −0.17%, −0.21%, 0.13%, −1.08% and −0.18%, respectively. Additionally, The mean annual rate of change of TBS in men aged 66–75 years was statistically different from that in the other groups (P<0.05); that is, at the age of 66–75 years, the decrease rate of LS TBS in men was the fastest. After age 76, the LS TBS continued to decline but slowed down. The average annual rate of change at LS BMD in men increased from −0.21% around 40 years to 1.26% around 80 years (P for trend=0.001), while the average annual change rate at TH and FN BMD in men was not statistically different in the age subgroups.
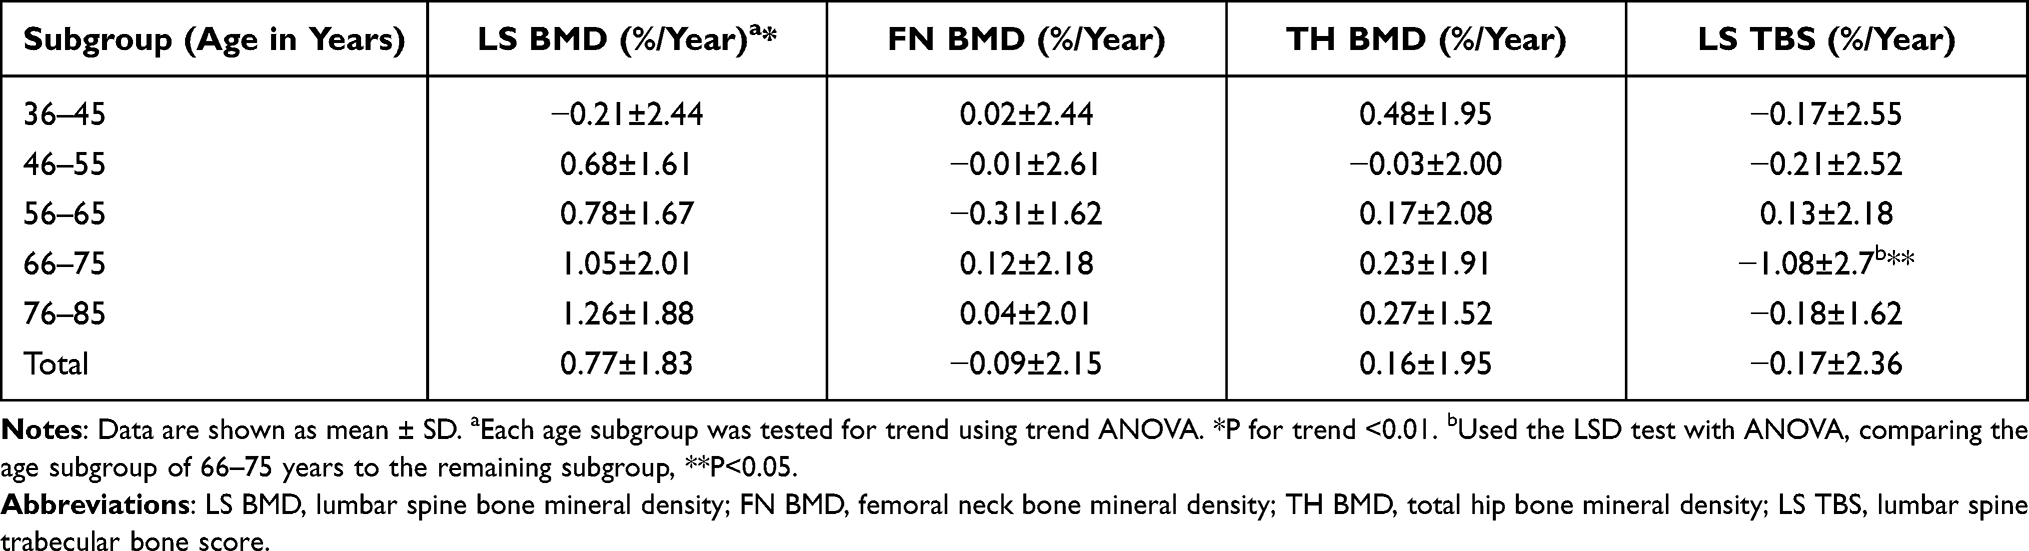 |
Table 2 Average Annual Change Rate (%/Year) of BMD at Each Site and LS TBS in 10-Year Age Subgroups |
Discussion
This study investigated the TBS and BMD differences and the longitudinal change in men aged 36–85 years. The cross-sectional findings showed that the BMD in the hip regions gradually decreased with age. It is generally assumed that BMD peaks before age 35 and thereafter decreases slowly with age.26,27 This shows the same trend of hip region BMD change in this study. Interestingly, this study found that in men aged 36~ 85 years, TBS increased with age before 46 years, reached a high value around 50 years, and thereafter it decreased with age. The trend in TBS is not consistent with BMD, which may reflect developmental differences between bone microstructure and bone minerals. TBS reflects the microstructure of the trabecular bone, positively associated with standard three-dimensional (3D) bone microstructural parameters such as connection density and trabecular number.28,29 Tanck et al used µ-CT and micro-finite element analysis (µ-FEA) to study the 3D bone trabecular structure of pigs’ vertebrae and proximal tibiae. They found that the mechanical remodeling of bone microarchitecture was later than the peak bone mass.30 In addition, in a clinical study, Khosla et al analyzed wrist skeletal microstructure in men aged 21 to 97 years and showed that the greatest trabecular number was around 50 years.31 In a recent study of people over 50 years, LS TBS was highest in men at age 50~60, and then gradually decreased. However, in both previous studies15,16 on TBS in men, showed a gradual decline in LS TBS with age, although their age grouping differs from ours.
In this study, the average annual change rate in all men at LS TBS was - 0.17%, similar to the postmenopausal older women (−0.16%) reported previously.32 In the MrOS cohort study,24 the average annual rate of change in LS TBS was higher in men (−0.25%) than in this study, considering the possibility that men in that cohort had a mean age of 72.8 years were older compared with our study population. Previous studies23,25 had shown an increased mean annual rate of LS BMD changes in men during follow-up. On this basis, our study found that the average annual change rate of LS BMD increased with age in different subgroups in men. The significant increase in LS BMD in men may be related to age-related degenerative changes at the spine, such as hyperostosis, compression fractures, and vascular calcifications, among others.33,34
Moreover, several studies reported that BMD loss in the total hip and femoral neck regions accelerated with increasing age.22,23 While in this study, with the increase of age, the overall FN BMD of men did not decrease significantly, and TH BMD even increased. It may be because the average follow-up interval in our subjects was about three years, which was shorter than those in the above report. However, compared to BMD, TBS tends to decrease with age in all men during follow-up. In recent years, studies have explored factors associated with TBS worse than BMD. A study of Korean women found that women with a more degraded TBS than their BMD level were older and had higher BMIs.12 A recent prospective cohort study by Panahi et al showed that in men, both smoking and larger waist circumference were associated with more degraded TBS than BMD.13 Both cross-sectional studies reflect the value of TBS in assessing fragility fracture risk in individuals with normal BMD or osteopenia. In this longitudinal study, we found that although BMD in men did not significantly change or even increase in short-term follow-up, TBS still decreased with age. This suggests that TBS, as another important indicator of bone strength, may better reflect changes in bone strength than in adult men at short-term follow-up than BMD. Therefore, it is necessary to reflect bone strength and the risk of fragility fracture by monitoring TBS at follow-up.
Few studies have analyzed the association between LS TBS’s average annual change rate and age. Recently, a community study in Korea divided men aged 40–79 years into two groups. There was no statistical difference in the annual change rate in LS TBS between the age groups greater than and less than 60 years.25 In the MROS cohort study,24 the rate of longitudinal change in TBS in older men was independent of age. In a longitudinal study, accelerated LS bone trabecular loss in men around the age of 65 was related to the decrease of serum levels of bioavailable steroids.35 In this study, LS TBS decreased with increasing age, and the rate of decrease was fastest in men aged 66 to 75 years. As an indicator of bone microarchitecture and a powerful predictor of osteoporosis independent of BMD,36 the significant decrease in TBS suggests that men at this age experience rapid bone loss and face a greater fracture risk. Therefore, for older men over 65 years of age, preventing bone loss and reducing fracture risk were particularly important.
This study is not without limitations. First, the enrolled subjects were those with regular physical examination, and fewer people were enrolled under 35 years, so we did not cover men under 35 years old in our study. Because of this, the peak of TBS and its full trend throughout the life course cannot be judged. Second, this is a retrospective analysis, and subjects were not randomly recruited from the general Chinese population. Third, all subjects had different ages at enrollment, so there were different bone conditions due to their nutritional status and dietary habits. Fourth, the follow-up time of the included population was inconsistent. However, in this study, we compared the average annual change rate of bone, so the effect of the difference can be ignored. Fifth, information on previous disease history, medication history may be inaccurate because these data were collected relying on subjects’ memory surveys. Sixth, measurement accuracy errors may be present at all scan points.
Despite some limitations, it is still the first cross-sectional and longitudinal study to assess age-related changes in TBS and BMD in Chinese adult men.
Conclusions
In conclusion, among men aged 36 to 85 years in this study, the changing trend of TBS was inconsistent with BMD. Men experience a high value of LS TBS around age 50, later than the commonly believed age of peak BMD, which may reflect developmental differences between bone microstructure and bone minerals. LS TBS may be used as a better indicator of changes in bone strength than BMD in adult men at short-term follow-up. The average annual rate of decline in LS TBS was fastest at 66 to 75 years. Therefore, for older men over 65 years of age, osteoporosis prevention and medical treatment are still necessary to reduce further bone loss and fracture risk.
Data Sharing Statement
The data that support the findings of this study are available from the corresponding author upon reasonable request.
Ethics Approval and Informed Consent
The study was approved by the Ethics Committee of the First Affiliated Hospital with Nanjing Medical University and conformed to the provisions of the Declaration of Helsinki (revised in Brazil in 2013). Written informed consent was obtained from all subjects, and the patients were anonymized. Written informed consent was obtained from all subjects, and the patients were anonymized.
Consent for Publication
All subjects agreed to publish the personal details involved in this study. Each subject was aware of the content of this article and agreed to its publication.
Acknowledgments
We would like to thank all participants included in the study. The abstract of this paper will be presented at the World Congress on Osteoporosis, Osteoarthritis and Musculoskeletal Diseases (WCO-IOF-ESCEO Virtual Congress 2022) as a poster presentation with interim findings. The meeting will take place between March 24 and March 26, 2022. The poster’s abstract will published in a supplement of Osteoporosis International.
Author Contributions
All authors made a significant contribution to the work reported, whether that is in the conception, study design, execution, acquisition of data, analysis and interpretation, or in all these areas; took part in drafting, revising or critically reviewing the article; gave final approval of the version to be published; have agreed on the journal to which the article has been submitted; and agree to be accountable for all aspects of the work.
Funding
This work was supported by the National Natural Science Foundation of China (Grant No. 82170898), the industry prospecting and common key technology key projects of Jiangsu Province Science and Technology Department (Grant No. BE2020721), the Special guidance funds for service industry of Jiangsu Province Development and Reform Commission (Grant No. [2019] 1089), the big data industry development pilot demonstration project of Ministry of Industry and Information Technology of China (Grant No. [2019] 243, [2020] 84).
Disclosure
The authors report no conflicts of interest in this work.
References
1. Johnell O, Kanis JA, Oden A, et al. Predictive value of BMD for hip and other fractures. J Bone Miner Res. 2005;20(7):1185–1194. doi:10.1359/JBMR.050304
2. Aaron JE, Shore PA, Shore RC, Beneton M, Kanis JA. Trabecular architecture in women and men of similar bone mass with and without vertebral fracture: II. Three-dimensional histology. Bone. 2000;27(2):277–282. doi:10.1016/S8756-3282(00)00328-8
3. Rubin CD. Emerging concepts in osteoporosis and bone strength. Curr Med Res Opin. 2005;21(7):1049–1056. doi:10.1185/030079905X50525
4. Dalle Carbonare L, Giannini S. Bone microarchitecture as an important determinant of bone strength. J Endocrinol Invest. 2004;27(1):99–105. doi:10.1007/BF03350919
5. Silva BC, Leslie WD, Resch H, et al. Trabecular bone score: a noninvasive analytical method based upon the DXA image. J Bone Miner Res. 2014;29(3):518–530. doi:10.1002/jbmr.2176
6. Roux JP, Wegrzyn J, Boutroy S, Bouxsein ML, Hans D, Chapurlat R. The predictive value of trabecular bone score (TBS) on whole lumbar vertebrae mechanics: an ex vivo study. Osteoporos Int. 2013;24(9):2455–2460. doi:10.1007/s00198-013-2316-7
7. Schousboe JT, Vo T, Taylor BC, et al. Prediction of incident major osteoporotic and hip fractures by Trabecular Bone Score (TBS) and prevalent radiographic vertebral fracture in older men. J Bone Miner Res. 2016;31(3):690–697. doi:10.1002/jbmr.2713
8. Iki M, Tamaki J, Kadowaki E, et al. Trabecular bone score (TBS) predicts vertebral fractures in Japanese women over 10 years independently of bone density and prevalent vertebral deformity: the Japanese Population-Based Osteoporosis (JPOS) cohort study. J Bone Miner Res. 2014;29(2):399–407. doi:10.1002/jbmr.2048
9. Hans D, Goertzen AL, Krieg MA, Leslie WD. Bone microarchitecture assessed by TBS predicts osteoporotic fractures independent of bone density: the Manitoba study. J Bone Miner Res. 2011;26(11):2762–2769. doi:10.1002/jbmr.499
10. Boutroy S, Hans D, Sornay-Rendu E, Vilayphiou N, Winzenrieth R, Chapurlat R. Trabecular bone score improves fracture risk prediction in non-osteoporotic women: the OFELY study. Osteoporos Int. 2013;24(1):77–85. doi:10.1007/s00198-012-2188-2
11. Kim JH, Choi HJ, Ku EJ, et al. Trabecular bone score as an indicator for skeletal deterioration in diabetes. J Clin Endocrinol Metab. 2015;100(2):475–482. doi:10.1210/jc.2014-2047
12. Shin YH, Gong HS, Lee KJ, Baek GH, Age O. Higher body mass index are associated with a more degraded trabecular bone score compared to bone mineral density. J Clin Densitom. 2019;22(2):266–271. doi:10.1016/j.jocd.2017.06.006
13. Panahi N, Ostovar A, Fahimfar N, et al. Factors associated with TBS worse than BMD in non-osteoporotic elderly population: Bushehr elderly health program. BMC Geriatr. 2021;21(1):444. doi:10.1186/s12877-021-02375-8
14. Weaver CM, Gordon CM, Janz KF, et al. The National Osteoporosis Foundation’s position statement on peak bone mass development and lifestyle factors: a systematic review and implementation recommendations. Osteoporos Int. 2016;27(4):1281–1386. doi:10.1007/s00198-015-3440-3
15. Bazzocchi A, Ponti F, Diano D, et al. Trabecular bone score in healthy ageing. Br J Radiol. 2015;88(1052):20140865. doi:10.1259/bjr.20140865
16. Sritara C, Thakkinstian A, Ongphiphadhanakul B, et al. Age-adjusted dual X-ray absorptiometry-derived trabecular bone score curve for the lumbar spine in Thai females and males. J Clin Densitom. 2016;19(4):494–501. doi:10.1016/j.jocd.2015.05.068
17. Má G, Winzenrieth R, Deleze M, Cons-Molina F, Clark P. Description of normative spine TBS data for men and women in Mexican population. J Clin Densitom. 2021;24(1):129–134. doi:10.1016/j.jocd.2020.06.003
18. Walsh JS, Eastell R. Osteoporosis in men. Nat Rev Endocrinol. 2013;9(11):637–645. doi:10.1038/nrendo.2013.171
19. Cummings SR, Cawthon PM, Ensrud KE, et al. BMD and risk of hip and nonvertebral fractures in older men: a prospective study and comparison with older women. J Bone Miner Res. 2006;21(10):1550–1556. doi:10.1359/jbmr.060708
20. Nguyen ND, Center JR, Eisman JA, Nguyen TV. Bone loss, weight loss, and weight fluctuation predict mortality risk in elderly men and women. J Bone Miner Res. 2007;22(8):1147–1154. doi:10.1359/jbmr.070412
21. Jones G, Nguyen T, Sambrook P, Kelly PJ, Eisman JA. Progressive loss of bone in the femoral neck in elderly people: longitudinal findings from the Dubbo osteoporosis epidemiology study. BMJ. 1994;309(6956):691–695. doi:10.1136/bmj.309.6956.691
22. Cawthon PM, Ewing SK, McCulloch CE, et al. Loss of hip BMD in older men: the osteoporotic fractures in men (MrOS) study. J Bone Miner Res. 2009;24(10):1728–1735. doi:10.1359/jbmr.090419
23. Lim Y, Jo K, Ha HS, et al. The prevalence of osteoporosis and the rate of bone loss in Korean adults: the Chungju metabolic disease cohort (CMC) study. Osteoporos Int. 2017;28(4):1453–1459. doi:10.1007/s00198-016-3893-z
24. Schousboe JT, Vo TN, Langsetmo L, et al. Predictors of change of trabecular bone score (TBS) in older men: results from the osteoporotic fractures in men (MrOS) study. Osteoporos Int. 2018;29(1):49–59. doi:10.1007/s00198-017-4273-z
25. Park SY, Kim JH, Choi HJ, et al. Longitudinal changes in bone mineral density and trabecular bone score in Korean adults: a community-based prospective study. Arch Osteoporos. 2020;15(1):100. doi:10.1007/s11657-020-00731-6
26. Berger C, Goltzman D, Langsetmo L, et al. Peak bone mass from longitudinal data: implications for the prevalence, pathophysiology, and diagnosis of osteoporosis. J Bone Miner Res. 2010;25(9):1948–1957. doi:10.1002/jbmr.95
27. Xue S, Kemal O, Lu M, Lix LM, Leslie WD, Yang S. Age at attainment of peak bone mineral density and its associated factors: the national health and nutrition examination survey 2005––2014. Bone. 2020;131:115163. doi:10.1016/j.bone.2019.115163
28. Hans D, Barthe N, Boutroy S, Pothuaud L, Winzenrieth R, Krieg MA. Correlations between trabecular bone score, measured using anteroposterior dual-energy X-ray absorptiometry acquisition, and 3-dimensional parameters of bone microarchitecture: an experimental study on human cadaver vertebrae. J Clin Densitom. 2011;14(3):302–312. doi:10.1016/j.jocd.2011.05.005
29. Winzenrieth R, Michelet F, Hans D. Three-dimensional (3D) microarchitecture correlations with 2D projection image gray-level variations assessed by trabecular bone score using high-resolution computed tomographic acquisitions: effects of resolution and noise. J Clin Densitom. 2013;16(3):287–296. doi:10.1016/j.jocd.2012.05.001
30. Tanck E, Homminga J, van Lenthe GH, Huiskes R. Increase in bone volume fraction precedes architectural adaptation in growing bone. Bone. 2001;28(6):650–654. doi:10.1016/S8756-3282(01)00464-1
31. Khosla S, Riggs BL, Atkinson EJ, et al. Effects of sex and age on bone microstructure at the ultradistal radius: a population-based noninvasive in vivo assessment. J Bone Miner Res. 2006;21(1):124–131. doi:10.1359/JBMR.050916
32. Popp AW, Guler S, Lamy O, et al. Effects of zoledronate versus placebo on spine bone mineral density and microarchitecture assessed by the trabecular bone score in postmenopausal women with osteoporosis: a three-year study. J Bone Miner Res. 2013;28(3):449–454. doi:10.1002/jbmr.1775
33. Orwoll ES, Oviatt SK, Mann T. The impact of osteophytic and vascular calcifications on vertebral mineral density measurements in men. J Clin Endocrinol Metab. 1990;70(4):1202–1207. doi:10.1210/jcem-70-4-1202
34. Kinoshita H, Tamaki T, Hashimoto T, Kasagi F. Factors influencing lumbar spine bone mineral density assessment by dual-energy X-ray absorptiometry: comparison with lumbar spinal radiogram. J Orthop Sci. 1998;3(1):3–9. doi:10.1007/s007760050015
35. Riggs BL, Melton LJ, Robb RA, et al. A population-based assessment of rates of bone loss at multiple skeletal sites: evidence for substantial trabecular bone loss in young adult women and men. J Bone Miner Res. 2008;23(2):205–214. doi:10.1359/jbmr.071020
36. Leslie WD, Aubry-Rozier B, Lix LM, Morin SN, Majumdar SR, Hans D. Spine bone texture assessed by trabecular bone score (TBS) predicts osteoporotic fractures in men: the Manitoba Bone Density Program. Bone. 2014;67:10–14. doi:10.1016/j.bone.2014.06.034
 © 2022 The Author(s). This work is published and licensed by Dove Medical Press Limited. The
full terms of this license are available at https://www.dovepress.com/terms
and incorporate the Creative Commons Attribution
- Non Commercial (unported, 3.0) License.
By accessing the work you hereby accept the Terms. Non-commercial uses of the work are permitted
without any further permission from Dove Medical Press Limited, provided the work is properly
attributed. For permission for commercial use of this work, please see paragraphs 4.2 and 5 of our Terms.
© 2022 The Author(s). This work is published and licensed by Dove Medical Press Limited. The
full terms of this license are available at https://www.dovepress.com/terms
and incorporate the Creative Commons Attribution
- Non Commercial (unported, 3.0) License.
By accessing the work you hereby accept the Terms. Non-commercial uses of the work are permitted
without any further permission from Dove Medical Press Limited, provided the work is properly
attributed. For permission for commercial use of this work, please see paragraphs 4.2 and 5 of our Terms.