Back to Journals » Clinical Ophthalmology » Volume 12
Age-related changes in the peripheral retinal nerve fiber layer thickness
Authors Hondur G, Göktaş E, Al-Aswad L, Tezel G ![]()
Received 18 November 2017
Accepted for publication 20 January 2018
Published 26 February 2018 Volume 2018:12 Pages 401—409
DOI https://doi.org/10.2147/OPTH.S157429
Checked for plagiarism Yes
Review by Single anonymous peer review
Peer reviewer comments 2
Editor who approved publication: Dr Scott Fraser
Gözde Hondur,1,2 Emre Göktaş,1 Lama Al-Aswad,1 Gülgün Tezel1
1Department of Ophthalmology, Columbia University, College of Physicians and Surgeons, New York, NY, USA; 2Department of Ophthalmology, Ulucanlar Training and Research Hospital, Ankara, Turkey
Purpose: This pilot cross-sectional study aimed to determine age-related changes of the retinal nerve fiber layer (RNFL) thickness in retinal periphery by swept-source optical coherence tomography-based analysis.
Methods: Forty eyes of 40 healthy subjects were studied in three age groups, group 1 (20–40 years, n=15), group 2 (41–60 years, n=14), and group 3 (≥61 years, n=11). Wide-angle swept-source optical coherence tomography scans, including the optic disc and macula, were montaged with the nasal peripheral optical coherence tomography images acquired with a contralateral gaze. The peripapillary and peripheral RNFL thickness values were obtained for nasal and temporal sides. The ratio of peripheral-to-peripapillary RNFL thickness was also calculated for these sectors.
Results: We detected a significantly thinner RNFL in older than younger subjects at a distance of 6 mm from the optic disc on nasal and temporal sides (P<0.001). An age-related reduction in peripheral-to-peripapillary RNFL thickness ratios (P<0.001 and P<0.02 for nasal and temporal sides, respectively) was also detected.
Conclusion: The age-related decline should be taken into consideration when determining the glaucoma-related alterations in peripheral RNFL thickness. Continued analysis in patients with ocular hypertension and glaucoma should help determine whether RNFL in the periphery with lower nerve tissue reserve might be more susceptible to injury, whether injury to the peripheral RNFL might be easier to detect, and/or whether analysis of the peripheral RNFL thickness could improve clinical diagnosis and follow-up of glaucoma.
Keywords: age, glaucoma, retinal nerve fiber layer thickness, swept-source optical coherence tomography
Introduction
Characteristic structural alterations in optic nerve head (ONH) and retinal nerve fiber layer (RNFL) correspond to visual field defects detected in glaucomatous eyes, and various objective or functional parameters serve as clinical biomarkers of glaucoma. Continuously developing new analysis techniques and structure–function models aim for early and more accurate detection of glaucoma and its progression, thereby, to enable early interventions to prevent further progression of the nerve injury and the patients’ disability.1
Thickness of the RNFL can be measured in vivo by optical coherence tomography (OCT), a noninvasive technique providing cross-sectional tomography imaging of the retina and ONH. The OCT has been proven to be a reliable and reproducible method to evaluate peripapillary RNFL thickness, which has been a sensitive parameter for clinical assessment of the nerve injury in glaucoma.2,3 Recent technological advancements have introduced swept-source optical coherence tomography (SS-OCT) with a longer wavelength and a higher scanning speed compared with conventional OCT, which facilitates an enhanced visualization of deep structures, including choroid and lamina cribrosa.4–8 Furthermore, a wide-angle scan image encompassing a large area of the posterior pole, including both the optic disc and macula, can be obtained by SS-OCT. Using OCT-based imaging, peripapillary RNFL thickness, and more recently macular RNFL thickness, have been extensively examined in glaucoma patients9–11 and normal populations.12–15 Although SS-OCT is capable of analyzing peripheral RNFL thickness, it has not been reported in glaucoma patients or normal populations, except for a single study that detected a significant decrease in the “mean average” of wide-angle RNFL thickness measurements in glaucomatous eyes (but not specifically focused on peripheral values).16
Although analysis of the peripheral RNFL thickness seems promising to detect glaucoma-related damage, for attributing any loss in peripheral RNFL thickness to glaucoma, age-related changes should first be taken into consideration. This is because aging-related injurious processes increase the overall risk of nerve injury, and changes beyond the age-related decline should be related to disease. Although aging-related injury to retinal ganglion cells and RNFL has been reported in various histopathological17–20 and clinical studies,12–15 the magnitude of age-related changes in the peripheral RNFL thickness is unknown. Based on the threshold theory that suggests the concept of brain reserve capacity as a major factor in the onset of clinical symptoms after brain injury or neurodegenerative disease,21,22 it is further stimulating to determine whether the age-related decline of RNFL thickness could be more prominent, or more easily detectable, in the peripheral retina with a lower reserve of the nerve tissue. In fact, ongoing glaucoma research similarly indicates the association of thinner RNFL at baseline with glaucoma development.23–25 In order to establish a baseline for analysis of the peripheral RNFL thickness in glaucoma, this pilot study aimed to determine age-related changes in the peripheral RNFL thickness by SS-OCT-based analysis.
Methods
Study participants
Retinal images were acquired from 49 healthy volunteers who were recruited from departmental employees, their relatives, or patients’ companions, after a written informed consent was obtained. A complete medical history was taken from all participants, and they underwent a full ophthalmic examination for the best-corrected visual acuity, the spherical equivalent refractive error, visual field testing, intraocular pressure measurement, slit-lamp examination, and dilated examination of the optic disc and fundus. All procedures were approved by the Columbia University Institutional Review Board and were conducted in adherence with the tenets of the Declaration of Helsinki.
The inclusion criteria included an age of >20 years, a best-corrected visual acuity of 20/30 or better, a spherical refraction within ±5.0 D, a cylinder correction <3.0 D, an axial length <26 mm, no media opacities that interfere with fundus imaging, normal clinical ocular findings with no evidence for optic nerve or chorioretinal pathologies (that could interfere with our analysis in the retinal periphery), an intraocular pressure of <22 mmHg, and a normal visual field test result as determined by standard automated perimetry and 24-2 Swedish interactive threshold algorithm (Humphrey visual field analyzer, Carl Zeiss Meditec Inc., Dublin, CA, USA) with <30% fixation losses, false-positives and false-negatives.
Based on our exclusion criteria, none of the study participants had ocular hypertension, glaucoma, a family history of glaucoma, or any other ocular or systemic disease that could affect their RNFL thickness. None of the study participants were using any drug treatment and none were smokers. One eye was randomly chosen if both eyes were eligible for the study.
Imaging and measurement of the RNFL thickness
Retinal images were acquired using the swept-source Deep Range Imaging-OCT (DRI-OCT-1, Topcon, Tokyo, Japan). Three scans were performed for each eye: 1) a wide-angle scan including both the optic disc and the macula, 2) a 3D (horizontal) disc circle grid scan, and 3) nasal peripheral OCT images acquired with a contralateral gaze, which is not a part of the routine wide-angle OCT imaging. The 12×9 mm wide-angle SS-OCT scan centered on the posterior pole comprises 256 B-scans, each comprising 512 A-scans. These wide-angle en-face OCT images were montaged with the nasal peripheral OCT images. The composite image included a retinal area of up to 10 mm nasal and 8 mm temporal to the optic disc, and 3 mm superior and inferior to the optic disc (Figure 1).
 | Figure 1 Retinal images were acquired using the swept-source Deep Range Imaging-OCT (DRI-OCT-1, Topcon, Tokyo, Japan). |
The Deep Range Imaging-OCT segmentation software (Topcon) was used to identify the limits of the RNFL as the area between the internal limiting membrane and the inner boundary of the retinal ganglion cell layer (Figure 2). The peripapillary RNFL thickness was determined by the Deep Range Imaging-OCT 3D (horizontal) disc circle grid scan protocol that acquires the 6×6 mm images focused on the optic disc for measurement by automated placement of a 3.4-mm diameter circle centered on the disc. The circle placement was manually adjusted, when necessary. Our analysis included the peripapillary RNFL thickness values obtained for nasal and temporal sides. The studied peripheral RNFL thickness values that were also obtained using the Deep Range Imaging algorithm of the Topcon SS-OCT included the vertically oriented three 1×1 mm squares at a distance of 6 mm from the optic disc on temporal and nasal sides. The ratio of the peripheral-to-peripapillary RNFL thickness was then calculated for the two sectors. The reproducibility of measurements was assessed based on consecutive scans acquired by the same operator, and within-subject coefficient of variation that was calculated as the square root of the variance divided by the mean RNFL thickness of the repeated measures (0.04±0.02) showed good repeatability.
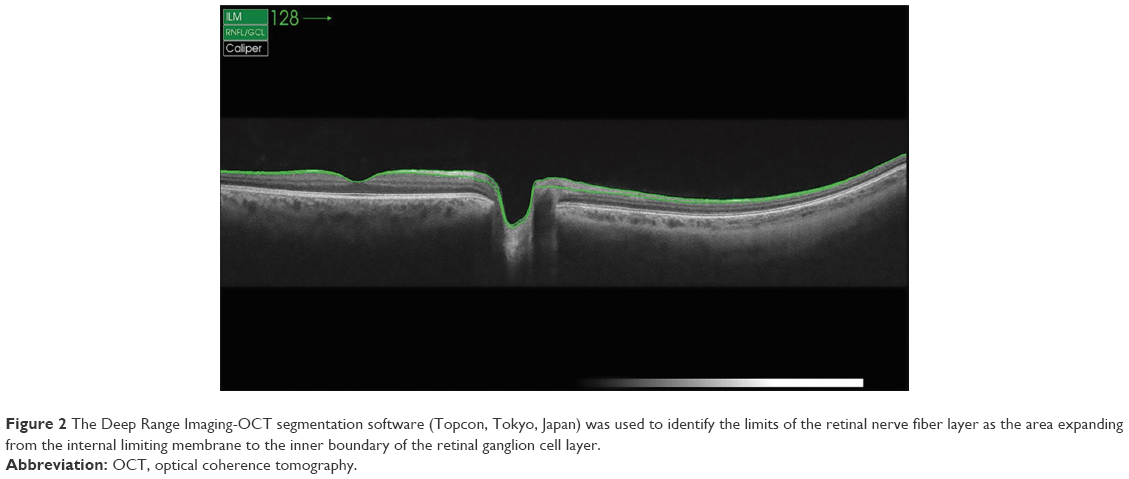 | Figure 2 The Deep Range Imaging-OCT segmentation software (Topcon, Tokyo, Japan) was used to identify the limits of the retinal nerve fiber layer as the area expanding from the internal limiting membrane to the inner boundary of the retinal ganglion cell layer. |
Statistical analysis
The statistical analysis was performed using the commercial statistical software (SigmaPlot, version 12.5, Systat Software, San Jose, CA, USA). A χ2 test was used for comparison of demographics between the age groups. The Kruskal–Wallis one way analysis of variance on ranks was used for comparison of the RNFL thickness (and the peripheral-to-peripapillary RNFL thickness ratio) obtained from different age groups. In addition, linear regression analysis was used to determine the relationship between RNFL thickness (and the peripheral-to-peripapillary RNFL thickness ratio) and age. A P-value of <0.05 was considered statistically significant. All data are presented as mean ± SD.
Results
Forty-nine healthy subjects were included in this study; however, nine eyes were excluded from subsequent analysis because of clipped or poorly focused images or motion artifacts. Consequently, 40 eyes of 40 healthy white subjects (22 females and 18 males; χ2 test, P>0.05) were studied in three age groups. Group 1 (20–40 years) consisted of 15 eyes, group 2 (41–60 years) consisted of 14 eyes, and group 3 (≥61 years) consisted of 11 eyes.
For comparison of the peripheral RNFL thickness between different age groups, only the data corresponding to 6 mm distance from the optic disc were evaluated, because the data collected beyond this distance were almost null in groups 2 and 3. Figure 3 shows three representative composite images obtained from different age groups containing the RNFL thickness data. Table 1 presents the peripheral RNFL thickness (mean ± SD) at 6 mm from the optic disc (nasally and temporally) in three age groups. Our group comparison detected an age-related decline in the peripheral RNFL thickness (the Kruskal–Wallis one way analysis of variance on ranks, P=0.002 and P=0.001 for nasal and temporal sides, respectively). As also illustrated in Figure 4, the age-related decline detected in the peripheral RNFL thickness was 5.7-fold and 1.3-fold for nasal and temporal sides, respectively. Note that perhaps due to lower thickness of the nerve fiber layer in the retinal periphery, a prominent inter-individual variability was detectable, particularly for the nasal side with higher rate of age-related thinning.
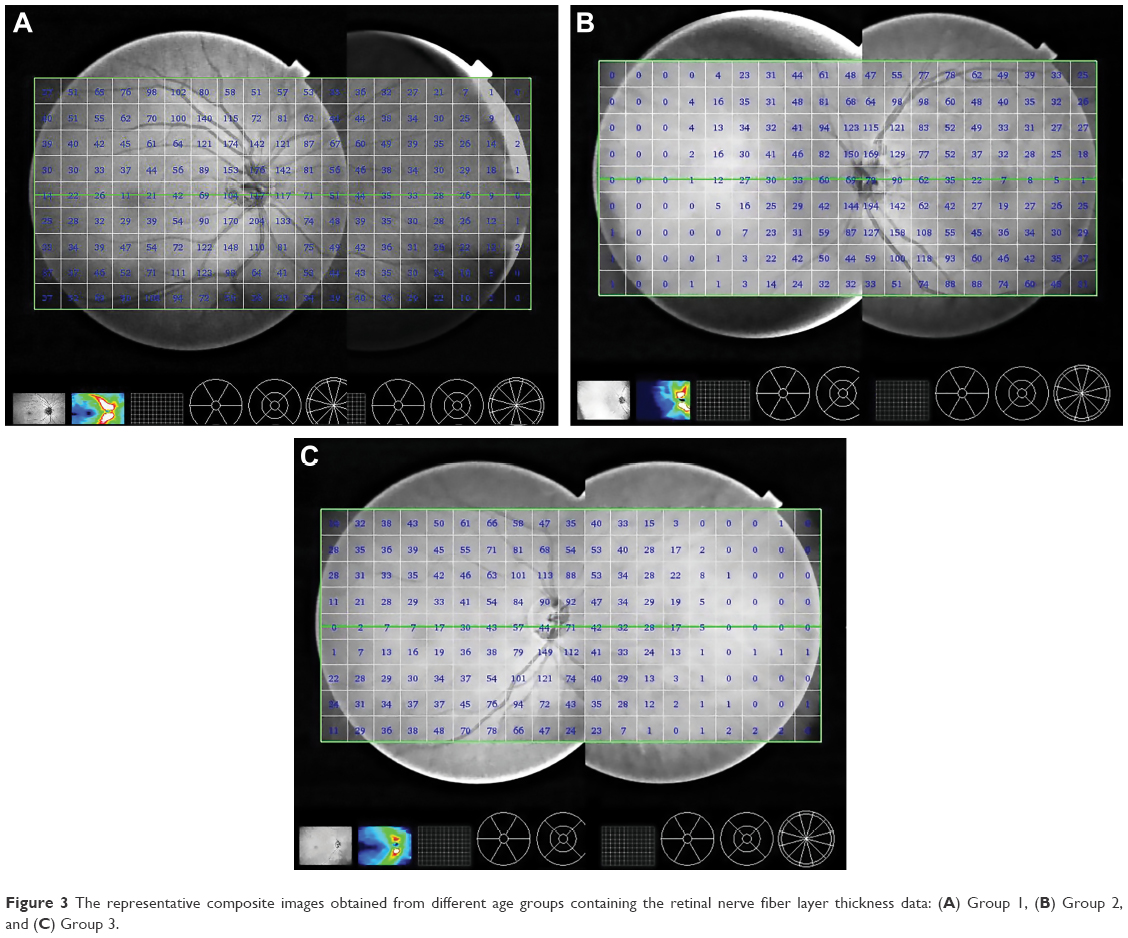 | Figure 3 The representative composite images obtained from different age groups containing the retinal nerve fiber layer thickness data: (A) Group 1, (B) Group 2, and (C) Group 3. |
 | Table 1 The peripheral RNFL thickness |
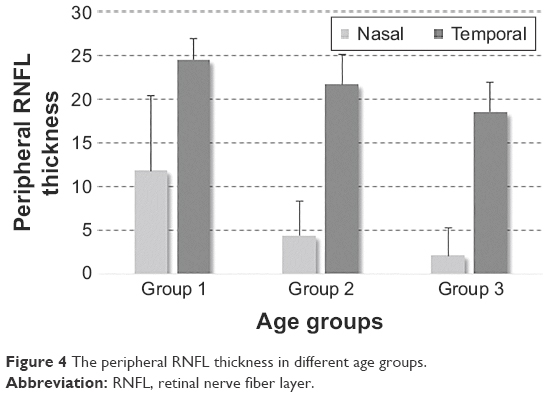 | Figure 4 The peripheral RNFL thickness in different age groups. |
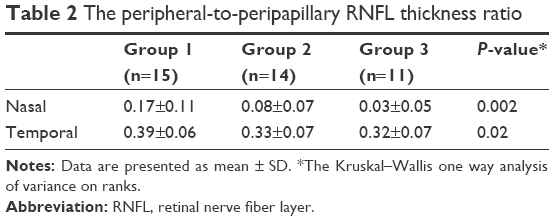
Table 2 presents the peripheral-to-peripapillary RNFL thickness ratio (mean ± SD) in different age groups (also illustrated in Figure 5). An age-related decline was also detectable in the peripheral-to-peripapillary RNFL thickness ratio (5.7-fold and 1.2-fold for nasal and temporal sides, respectively). This decline detected by group comparison was found to be statistically significant (the Kruskal–Wallis one way analysis of variance on ranks, P=0.002 and P=0.02 for nasal and temporal sides, respectively).
 | Table 2 The peripheral-to-peripapillary RNFL thickness ratio |
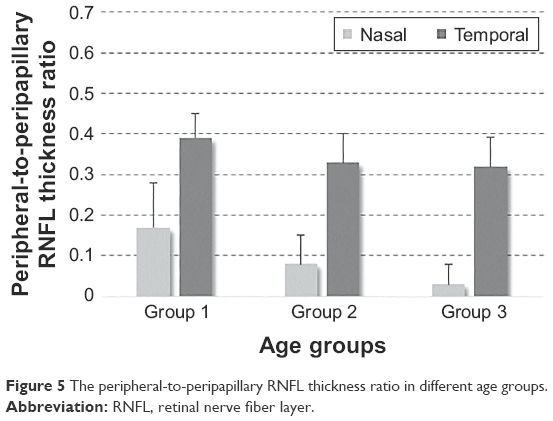 | Figure 5 The peripheral-to-peripapillary RNFL thickness ratio in different age groups. |
In addition to group comparisons, linear regression analysis detected a negative correlation between the peripheral RNFL thickness and age (R=0.549, P<0.001; and R=0.612, P<0.001 for nasal and temporal sides, respectively). An age-related decline in the peripheral-to-peripapillary RNFL thickness ratio for nasal (R=0.542; P<0.001) and temporal sides (R=0.362; P=0.02), more prominent nasally, was also detected by linear regression analysis. Figure 6 shows scatterplots of the relationship between the peripheral RNFL thickness and age.
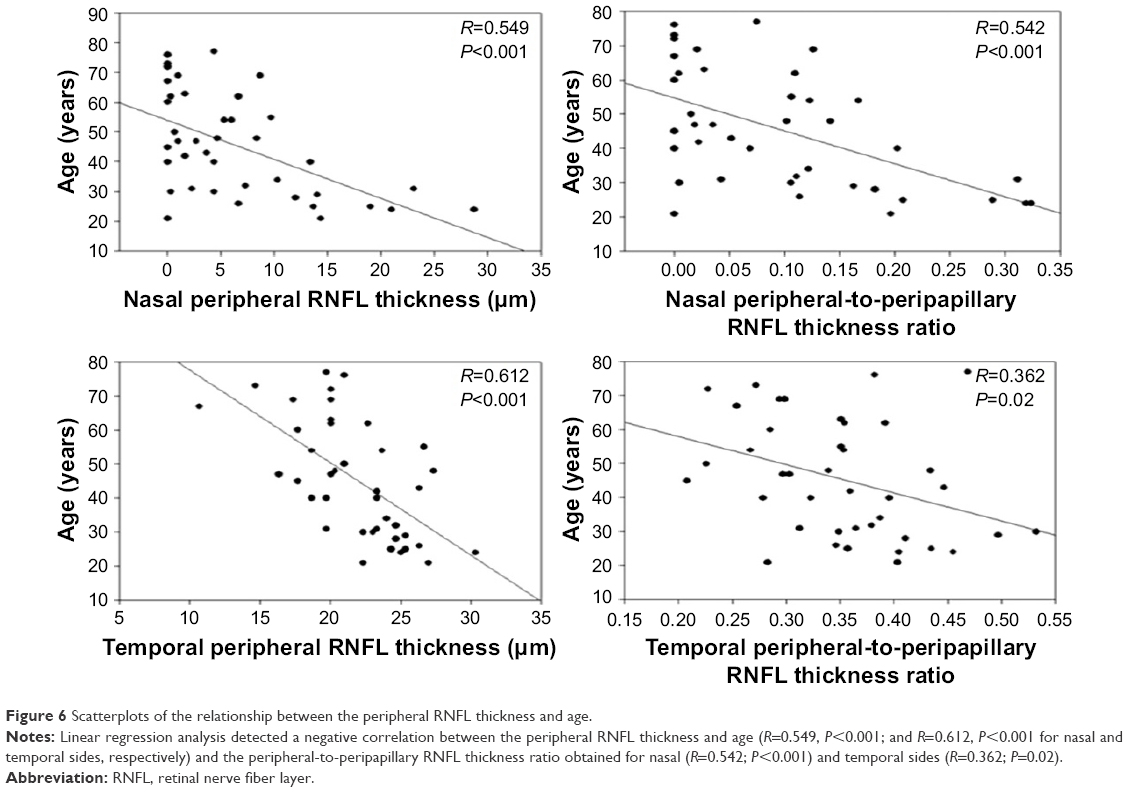 | Figure 6 Scatterplots of the relationship between the peripheral RNFL thickness and age. |
Discussion
Using SS-OCT-based imaging, this pilot study detected an age-related decline in the peripheral RNFL thickness (at a distance of 6 mm from the optic disc, nasally and temporally). When accounting for decreased peripheral-to-peripapillary RNFL thickness ratios with aging, the age-related decline detected in the peripheral RNFL thickness may be suggested to occur earlier than that in the peripapillary RNFL thickness; however, this observation should be validated by longitudinal analysis of individual eyes over time. In addition, the age-related decline that we detected in the peripheral RNFL thickness and the peripheral-to-peripapillary RNFL thickness ratio exhibited a trend toward being more prominent in the nasal retina compared with the temporal side. This relative preservation of the temporal RNFL, consistent with a previous study of age-related RNFL injury,14 also warrants further investigation.
It is commonly recognized that the aging-related deterioration may be synergistic or additive in increased susceptibility for glaucomatous injury. Epidemiological studies consistently recognize aging as a major risk factor for glaucoma,26,27 glaucomatous human tissues exhibit an accelerated aging process,28 and the pathogenesis of glaucomatous neurodegeneration involves aging-related processes.29 Apart from the aging-related pathogenic processes that can promote initiation and progression of glaucoma, the normal age-related decay of RNFL thickness12–15 may also impact the clinical assessment of glaucoma.30 Undoubtedly, definition of disease progression requires the consideration of this age-related decline, and only the changes beyond normal aging effect should be attributed to glaucoma. Our observations suggest that a similar consideration of the normal aging effect is important for interpretation of glaucoma-related alterations in the peripheral RNFL thickness as well.
Peripapillary RNFL thickness is a well-known clinical parameter to evaluate glaucoma, and it has been measured in many studies of glaucoma9–11 and studies of different age groups in normal populations.12–15 However, very little is known about peripheral RNFL thickness within healthy populations or patients with glaucoma or other neurodegenerative diseases. To our knowledge, this is the first report of peripheral RNFL thickness in healthy subjects. Only a single study has previously evaluated the peripheral RNFL thickness using conventional wide-angle scans and detected a significant decrease in the mean average of RNFL thickness in glaucomatous eyes.16 The investigators have found the SS-OCT-based RNFL thickness measurements reliable to detect glaucomatous damage. However, since wide-angle scan showed a lower performance in the nasal periphery when compared with other sectors, mean average values of the nasal RNFL thickness have been calculated from three 1×1 mm squares as opposed to twenty-four 1×1 mm squares in the temporal retina. To overcome this limitation in the present study, we also acquired nasal images with a contralateral gaze and montaged the images for obtaining a composite image. This approach made it possible to examine more peripheral RNFL and allowed us to observe age-related changes in the peripheral RNFL thicknesses. In montaged images, RNFL thickness values could be displayed for up to 10 mm nasal and 8 mm temporal to the optic disc; however, since the RNFL thickness was too thin for measurements beyond 6 mm, particularly for age groups 2 and 3, only the measurements at 6 mm to the optic disc were included in the study. Analysis of the peripheral RNFL thickness beyond this limit seemed to be unreliable, at least with the present methodology.
Thus, our analysis provided additional information on the nasal peripheral RNFL thickness over routine wide-angle RNFL analysis, which already provided data for temporal peripheral RNFL thickness. A weakness of our study was a relatively small sample size for different age groups. Technical difficulty in obtaining a proper composite image may also be considered as a disadvantage. In particular, motion artifacts created challenge in montaging of the images that lied in the same plane for continuity of retinal structures. The images suitable for montaging could be obtained only from highly cooperative subjects. However, it should be clarified that since this study compared temporal and nasal peripheral RNFL thicknesses at 6 mm from the optic disc, montaging was not even necessary. The nasal peripheral images acquired with a contralateral gaze were actually self-sufficient to collect the RNFL thickness data for the nasal periphery. Our pilot data support the informative importance of peripheral RNFL analysis and encourage additional studies that can be further facilitated by employing the newer OCT systems not needing image montaging.
Our analysis was based on cross-sectional data. It would, of course, be ideal if changes in the peripheral RNFL thickness could be studied in each individual longitudinally, so that true thickness changes between different age groups could be measured over time. Correlation of the age-related profile of peripheral RNFL thickness to visual field function should also be established. The age-related decline in standard automated perimetry thresholds per decade has been estimated to be greater peripherally than centrally.31 Besides standard automated perimetry, short-wavelength automated perimetry and frequency-doubling technology perimetry have also exhibited a slightly greater effect of aging in the periphery.32 In addition to age-related changes, peripheral visual field analysis may be useful to validate the informative importance of peripheral RNFL analysis in patients with glaucoma. Even if glaucoma has traditionally been considered to affect the peripheral visual field in early disease stages,33 following studies have demonstrated that central, paracentral, and peripheral scotomas are developed through glaucoma progression.1,34,35 However, a more recent study using automated kinetic perimetry of the peripheral field has detected strikingly different defects in peripheral visual fields of patients with a similar defect in their central visual field.36
We hope that successive analysis in patients with ocular hypertension and glaucoma could help determine whether analysis of the peripheral RNFL thickness could improve clinical detection of glaucoma or disease progression. Interestingly, the threshold theory has suggested the concept of brain reserve capacity as a major factor for initiation of clinical symptoms after brain injury or neurodegenerative disease.21,22 In the field of glaucoma, a thinner RNFL at baseline has also been associated with glaucoma development as an independent predictor.23–25 However, some studies have associated a greater baseline RNFL thickness with a faster rate of age-related15 or glaucoma-related injury,37,38 which was explained by accompanying alterations in the glial tissue component.39 It is therefore highly motivating to analyze the peripheral RNFL thickness in glaucoma in order to determine whether the lower nerve tissue reserve might increase the susceptibility of peripheral RNFL to glaucomatous injury (due to mechanical/vascular/inflammatory stress in eye wall structures). This aspect stimulates more work because it could be a shared factor that might also be associated with speedy disease progression in many patients with late stages of glaucoma despite treatment (where only a small number of retinal ganglion cells and nerve fibers remain).40 On the other hand, any injury to the peripheral RNFL (which may correspond to a higher percentage of the present nerve tissue compared with other retinal regions with a thicker RNFL) might be easier to detect. Although the rate of change as a proportion to baseline might be faster in areas with thin baseline RNFL as in the periphery, the ability to reliably detect glaucoma-related changes in these areas could be problematic due to poorer signal to noise ratio or instrumental artifacts. Continuously evolving new OCT systems are expected to further improve the analysis of peripheral RNFL thickness and provide important contributions to the data obtained from the analysis of peripapillary and macular regions for glaucoma diagnosis and follow-up.
Conclusion
Findings of this study indicate an age-related decline in peripheral RNFL thickness, which should be taken into consideration when determining the glaucoma-related alterations.
Acknowledgments
This study has been supported in part by the National Eye Institute, Bethesda, MD, USA (1R21EY024105) and Glaucoma Research Foundation, San Francisco, CA, USA. In addition, Dr Tezel is the recipient of the Homer McK. Rees Scholarship in Glaucoma Research and an awardee of the AR and JR Peacock Trusts Research Grant, and Dr Hondur received a research scholarship from TÜBITAK (The Scientific and Technological Research Council of Turkey), Ankara, Turkey. This study has also been supported in part by the Research to Prevent Blindness Inc., New York, NY, USA, providing an unrestricted grant to the Columbia University, Department of Ophthalmology.
Disclosure
The authors report no conflicts of interest in this work.
References
De Moraes CG, Liebmann JM, Levin LA. Detection and measurement of clinically meaningful visual field progression in clinical trials for glaucoma. Prog Retin Eye Res. 2017;56:107–147. | ||
Blumenthal EZ, Williams JM, Weinreb RN, Girkin CA, Berry CC, Zangwill LM. Reproducibility of nerve fiber layer thickness measurements by use of optical coherence tomography. Ophthalmology. 2000;107:2278–2282. | ||
Paunescu LA, Schuman JS, Price LL, et al. Reproducibility of nerve fiber thickness, macular thickness, and optic nerve head measurements using Stratus OCT. Invest Ophthalmol Vis Sci. 2004;45(6):1716–1724. | ||
Hirata M, Tsujikawa A, Matsumoto A, Hangai M, et al. Macular choroidal thickness and volume in normal subjects measured by swept-source optical coherence tomography. Invest Ophthalmol Vis Sci. 2011;52(8):4971–4978. | ||
Mansouri K, Medeiros FA, Marchase N, Tatham AJ, Auerbach D, Weinreb RN. Assessment of choroidal thickness and volume during the water drinking test by swept-source optical coherence tomography. Ophthalmology. 2013;120(12):2508–2516. | ||
Mansouri K, Nuyen B, N Weinreb R. Improved visualization of deep ocular structures in glaucoma using high penetration optical coherence tomography. Expert Rev Med Devices. 2013;10(5):621–628. | ||
Takayama K, Hangai M, Kimura Y, et al. Three-dimensional imaging of lamina cribrosa defects in glaucoma using swept-source optical coherence tomography. Invest Ophthalmol Vis Sci. 2013;54(7):4798–4807. | ||
Park HY, Shin HY, Park CK. Imaging the posterior segment of the eye using swept-source optical coherence tomography in myopic glaucoma eyes: comparison with enhanced-depth imaging. Am J Ophthalmol. 2014;157(3):550–557. | ||
Hood DC, Raza AS, de Moraes CG, et al. Initial arcuate defects within the central 10 degrees in glaucoma. Invest Ophthalmol Vis Sci. 2011;52(2):940–946. | ||
Hood DC, Slobodnick A, Raza AS, de Moraes CG, Teng CC, Ritch R. Early glaucoma involves both deep local, and shallow widespread, retinal nerve fiber damage of the macular region. Invest Ophthalmol Vis Sci. 2014;55(2):632–649. | ||
Hood DC, De Cuir N, Blumberg DM, et al. A single wide-field OCT protocol can provide compelling information for the diagnosis of early glaucoma. Transl Vis Sci Technol. 2016;5(6):4. | ||
Kanamori A, Escano MF, Eno A, et al. Evaluation of the effect of aging on retinal nerve fiber layer thickness measured by optical coherence tomography. Ophthalmologica. 2003;217(4):273–278. | ||
Parikh RS, Parikh SR, Sekhar GC, Prabakaran S, Babu JG, Thomas R. Normal age-related decay of retinal nerve fiber layer thickness. Ophthalmology. 2007;114(5):921–926. | ||
Sung KR, Wollstein G, Bilonick RA, et al. Effects of age on optical coherence tomography measurements of healthy retinal nerve fiber layer, macula, and optic nerve head. Ophthalmology. 2009;116(6):1119–1124. | ||
Leung CK, Yu M, Weinreb RN, et al. Retinal nerve fiber layer imaging with spectral-domain optical coherence tomography: a prospective analysis of age-related loss. Ophthalmology. 2012;119(4):731–737. | ||
Yang Z, Tatham AJ, Zangwill LM, Weinreb RN, Zhang C, Medeiros FA. Diagnostic ability of retinal nerve fiber layer imaging by swept-source optical coherence tomography in glaucoma. Am J Ophthalmol. 2015;159(1):193–201. | ||
Repka MX, Quigley HA. The effect of age on normal human optic nerve fiber number and diameter. Ophthalmology. 1989;96(1):26–32. | ||
Gao H, Hollyfield JG. Aging of the human retina. Differential loss of neurons and retinal pigment epithelial cells. Invest Ophthalmol Vis Sci. 1992;33(1):1–17. | ||
Kim CB, Tom BW, Spear PD. Effects of aging on the densities, numbers, and sizes of retinal ganglion cells in rhesus monkey. Neurobiol Aging. 1996;17(3):431–438. | ||
Harman A, Abrahams B, Moore S, Hoskins R. Neuronal density in the human retinal ganglion cell layer from 16–77 years. Anat Rec. 2000;260(2):124–131. | ||
Meier-Ruge W, Hunziker O, Iwangoff P. Senile dementia: a threshold phenomenon of normal aging? A contribution to the functional reserve hypothesis of the brain. Ann N Y Acad Sci. 1991;621:104–118. | ||
Minkova L, Habich A, Peter J, Kaller CP, Eickhoff SB, Kloppel S. Gray matter asymmetries in aging and neurodegeneration: a review and meta-analysis. Hum Brain Mapp. 2017;38(12):5890–5904. | ||
Lalezary M, Medeiros FA, Weinreb RN, et al. Baseline optical coherence tomography predicts the development of glaucomatous change in glaucoma suspects. Am J Ophthalmol. 2006;142(4):576–582. | ||
Sehi M, Bhardwaj N, Chung YS, Greenfield DS; Advanced Imaging for Glaucoma Study Group. Evaluation of baseline structural factors for predicting glaucomatous visual-field progression using optical coherence tomography, scanning laser polarimetry and confocal scanning laser ophthalmoscopy. Eye (Lond). 2012;26(12):1527–1535. | ||
Zhang X, Dastiridou A, Francis BA, et al; Advanced Imaging for Glaucoma Study Group. Baseline Fourier-domain optical coherence tomography structural risk factors for visual field progression in the Advanced Imaging for Glaucoma Study. Am J Ophthalmol. 2016;172:94–103. | ||
Quigley HA. Glaucoma: macrocosm to microcosm the Friedenwald lecture. Invest Ophthalmol Vis Sci. 2005;46:2662–2670. | ||
Gordon MO, Beiser JA, Brandt JD, et al. The Ocular Hypertension Treatment Study: baseline factors that predict the onset of primary open-angle glaucoma. Arch Ophthalmol. 2002;120(6):714–720; discussion 829–830. | ||
Tezel G, Luo C, Yang X. Accelerated aging in glaucoma: immunohistochemical assessment of advanced glycation end products in the human retina and optic nerve head. Invest Ophthalmol Vis Sci. 2007;48(3):1201–1211. | ||
Tezel G. Oxidative stress in glaucomatous neurodegeneration: Mechanisms and consequences. Prog Retin Eye Res. 2006;25(5):490–513. | ||
Leung CK, Ye C, Weinreb RN, Yu M, Lai G, Lam DS. Impact of age-related change of retinal nerve fiber layer and macular thicknesses on evaluation of glaucoma progression. Ophthalmology. 2013;120(12):2485–2492. | ||
Heijl A, Lindgren G, Olsson J. Normal variability of static perimetric threshold values across the central visual field. Arch Ophthalmol. 1987;105(11):1544–1549. | ||
Gardiner SK, Johnson CA, Spry PG. Normal age-related sensitivity loss for a variety of visual functions throughout the visual field. Optom Vis Sci. 2006;83(7):438–443. | ||
LeBlanc EP, Becker B. Peripheral nasal field defects. Am J Ophthalmol. 1971;72:415–419. | ||
Mutlukan E. Diffuse and localised visual field defects to automated perimetry in primary open angle glaucoma. Eye (Lond). 1995;9(Pt 6):745–750. | ||
Park SC, De Moraes CG, Teng CC, Tello C, Liebmann JM, Ritch R. Initial parafoveal versus peripheral scotomas in glaucoma: risk factors and visual field characteristics. Ophthalmology. 2011;118(9):1782–1789. | ||
Monter VM, Crabb DP, Artes PH. Reclaiming the periphery: automated kinetic perimetry for measuring peripheral visual fields in patients with glaucoma. Invest Ophthalmol Vis Sci. 2017;58(2):868–875. | ||
Medeiros FA, Alencar LM, Zangwill LM, et al. Detection of progressive retinal nerve fiber layer loss in glaucoma using scanning laser polarimetry with variable corneal compensation. Invest Ophthalmol Vis Sci. 2009;50(4):1675–1681. | ||
Leung CK, Cheung CY, Weinreb RN, et al. Evaluation of retinal nerve fiber layer progression in glaucoma: a study on optical coherence tomography guided progression analysis. Invest Ophthalmol Vis Sci. 2010;51(1):217–222. | ||
Harwerth RS, Wheat JL, Rangaswamy NV. Age-related losses of retinal ganglion cells and axons. Invest Ophthalmol Vis Sci. 2008;49(10):4437–4443. | ||
Tezel G, Siegmund KD, Trinkaus K, Wax MB, Kass MA, Kolker AE. Clinical factors associated with progression of glaucomatous optic disc damage in treated patients. Arch Ophthalmol. 2001;119(6):813–818. |
 © 2018 The Author(s). This work is published and licensed by Dove Medical Press Limited. The
full terms of this license are available at https://www.dovepress.com/terms
and incorporate the Creative Commons Attribution
- Non Commercial (unported, 3.0) License.
By accessing the work you hereby accept the Terms. Non-commercial uses of the work are permitted
without any further permission from Dove Medical Press Limited, provided the work is properly
attributed. For permission for commercial use of this work, please see paragraphs 4.2 and 5 of our Terms.
© 2018 The Author(s). This work is published and licensed by Dove Medical Press Limited. The
full terms of this license are available at https://www.dovepress.com/terms
and incorporate the Creative Commons Attribution
- Non Commercial (unported, 3.0) License.
By accessing the work you hereby accept the Terms. Non-commercial uses of the work are permitted
without any further permission from Dove Medical Press Limited, provided the work is properly
attributed. For permission for commercial use of this work, please see paragraphs 4.2 and 5 of our Terms.