Back to Archived Journals » Open Access Journal of Sports Medicine » Volume 7
Aerobic power and lean mass are indicators of competitive sprint performance among elite female cross-country skiers
Authors Carlsson T, Tonkonogi M, Carlsson M
Received 7 July 2016
Accepted for publication 12 October 2016
Published 8 November 2016 Volume 2016:7 Pages 153—160
DOI https://doi.org/10.2147/OAJSM.S116672
Checked for plagiarism Yes
Review by Single anonymous peer review
Peer reviewer comments 3
Editor who approved publication: Prof. Dr. Andreas Imhoff
Tomas Carlsson, Michail Tonkonogi, Magnus Carlsson
School of Education, Health and Social Studies, Dalarna University, Falun, Sweden
Abstract: The purpose of this study was to establish the optimal allometric models to predict International Ski Federation’s ski-ranking points for sprint competitions (FISsprint) among elite female cross-country skiers based on maximal oxygen uptake (V̇O2max) and lean mass (LM). Ten elite female cross-country skiers (age: 24.5±2.8 years [mean ± SD]) completed a treadmill roller-skiing test to determine V̇O2max (ie, aerobic power) using the diagonal stride technique, whereas LM (ie, a surrogate indicator of anaerobic capacity) was determined by dual-emission X-ray anthropometry. The subjects’ FISsprint were used as competitive performance measures. Power function modeling was used to predict the skiers’ FISsprint based on V̇O2max, LM, and body mass. The subjects’ test and performance data were as follows: V̇O2max, 4.0±0.3 L min-1; LM, 48.9±4.4 kg; body mass, 64.0±5.2 kg; and FISsprint, 116.4±59.6 points. The following power function models were established for the prediction of FISsprint: 3.91×10⁵ ∙ VO -6.00 2max and 6.95×10¹⁰ ∙ LM-5.25; these models explained 66% (P=0.0043) and 52% (P=0.019), respectively, of the variance in the FISsprint. Body mass failed to contribute to both models; hence, the models are based on V̇O2max and LM expressed absolutely. The results demonstrate that the physiological variables that reflect aerobic power and anaerobic capacity are important indicators of competitive sprint performance among elite female skiers. To accurately indicate performance capability among elite female skiers, the presented power function models should be used. Skiers whose V̇O2max differs by 1% will differ in their FISsprint by 5.8%, whereas the corresponding 1% difference in LM is related to an FISsprint difference of 5.1%, where both differences are in favor of the skier with higher V̇O2max or LM. It is recommended that coaches use the absolute expression of these variables to monitor skiers’ performance-related training adaptations linked to changes in aerobic power and anaerobic capacity.
Keywords: V̇O2max, anaerobic capacity, cross-country skiing, allometric scaling
Introduction
Performance in cross-country skiing, where a specific distance should be completed in the shortest time possible, is dependent on the relationship between propelling and counteracting forces. The counteracting forces a skier has to overcome include an increasing potential energy during the stride cycle, a net increase in potential energy on uphill slopes, air resistance, friction, and changes in translational and rotational kinetic energy during the stride cycle.1 The sum of these counteracting forces has to be exceeded by the propelling forces produced by the muscles, together with the transformation of potential energy to kinetic energy in downhill slopes, to generate forward motion. Therefore, to adequately evaluate a skier’s competitive performance capability, it is essential to determine how the physiological variable, which reflects the propelling forces, should be expressed relative to body mass (ie, a surrogate indicator of the power demand because all counteracting forces the skier has to overcome are, in different proportions, related to body mass1).
This evaluation could be based on the metabolic perspective, where the capacities of the skier’s energy systems are anticipated to reflect the skier’s ability to produce propelling forces. To be able to produce propelling forces by the skeletal muscles throughout a race, it is necessary that the force-generating muscles are provided continuously with adenosine triphosphate (ATP). In events with an exercise duration of 30 min or more, the resynthesis of ATP is mainly concentrated to the aerobic energy supply system and its contribution is 95% or greater;2 however, when the exercise duration decreases and the absolute work intensity increases, the ATP resynthesis is gradually shifted to rely on anaerobic energy contribution. An equal contribution of aerobic and anaerobic energetic resources to power output for maximal exercises was reported to occur between 100 and 120 s.2,3
Sprint competitions in cross-country skiing, with race distances ranging from 0.8 to 1.8 km, have a duration of ~2–4 min; hence, it could be assumed that the contribution from both the aerobic and anaerobic energy supply systems is of importance to optimize the performance in sprint competitions. The mean anaerobic energy contribution was reported to range from 20% to 26% during a 600 m uphill time trial roller skiing with a completion time of ~3 min.4,5 This was in line with the results from a simulated sprint time trial, with a mean completion time of ~4 min, where the anaerobic and aerobic energy contributions were 18% and 82%, respectively, and the peak oxygen uptake during the time trial did not differ from maximal oxygen uptake (![]() ).6
).6
The importance of the aerobic energy supply system for skiing performance is accentuated by the reported relationships between elite male skiers’ technique-specific peak oxygen uptake and sprint prolog performance7,8 as well as International Ski Federation’s ski-ranking points for sprint competitions (FISsprint).9 Moreover, peak oxygen uptake for both double-poling and diagonal stride techniques was correlated with FISsprint for elite female skiers.10
However, despite the greater aerobic energy contribution to the propelling forces during a 600 m uphill time trial, with a similar exercise time as a sprint competition, it was reported that differences in time-trial performance for elite male skiers were more related to anaerobic capacity (mL ∙ kg-1) than peak oxygen uptake (mL ∙ min-1 ∙ kg-1).4 The importance of having a high anaerobic capacity in sprint skiing is emphasized by the correlations between lean mass (LM) and sprint prolog performance found for both elite male and female skiers.11 The LM (nearly equal to muscle mass) is considered being proportional to the anaerobic capacity,12,13 as a consequence of an increase in anaerobic energy stores when muscle volume increases.14,15 Hence, from a metabolic perspective, LM could be regarded as a surrogate indicator of the skiers’ “physiological power supply from anaerobic processes”, whereas ![]() is a surrogate indicator of the skiers’ “physiological power supply from aerobic processes”.
is a surrogate indicator of the skiers’ “physiological power supply from aerobic processes”.
To optimally indicate skiing performance, it is important to consider the relationship between power supply and power demand. This relationship has been investigated for elite male sprint prolog performance by using power function modeling (ie, an allometric scaling approach); it was recommended that the ![]() expressed absolutely (L ∙ min-1) should be used as indicator of elite male sprint performance, because body mass did not contribute to the power function model.7 However, because of gender differences related to physiological characteristics, it is not recommended to use this model to evaluate sprint performance capability of elite female skiers. For example, men have both higher
expressed absolutely (L ∙ min-1) should be used as indicator of elite male sprint performance, because body mass did not contribute to the power function model.7 However, because of gender differences related to physiological characteristics, it is not recommended to use this model to evaluate sprint performance capability of elite female skiers. For example, men have both higher ![]() and LM independent of the absolute or relative expressions used.11,16–18
and LM independent of the absolute or relative expressions used.11,16–18
Recently, in a review that investigated which factors influence the sprint performance in cross-country skiing, it was concluded that both aerobic and anaerobic capacities are important qualities for sprint performance;19 however, no suggestion about which expressions of aerobic power or anaerobic capacity that should be used was reported. Power function modeling to determine the optimal expression for ![]() and LM to indicate sprint performance among elite female cross-country skiers remains to be investigated. The purpose of the current study was to establish the optimal allometric models to predict FISsprint among elite female cross-country skiers based on
and LM to indicate sprint performance among elite female cross-country skiers remains to be investigated. The purpose of the current study was to establish the optimal allometric models to predict FISsprint among elite female cross-country skiers based on ![]() and LM.
and LM.
Methods
Study design
The physiological tests for determining the ![]() was performed using treadmill roller skiing and LM was determined by dual-emission X-ray anthropometry (DXA). The subjects’ FISsprint were used to evaluate their overall performance capability.
was performed using treadmill roller skiing and LM was determined by dual-emission X-ray anthropometry (DXA). The subjects’ FISsprint were used to evaluate their overall performance capability.
Subjects
Ten elite female Swedish cross-country skiers (age: 24.5±2.8 years [mean ± SD]; body mass: 64.0±5.2 kg; stature: 169.5±5.9 cm), including five athletes with World Cup competition experience, volunteered to participate in the study. The subjects were trained for 670±100 h during the preceding season. All the subjects provided written informed consent before participating in the study. The test procedures were performed in accordance with the World Medical Association’s Declaration of Helsinki – Ethical Principles for Medical Research Involving Human Subjects 2008, and the study was approved by the Regional Ethical Review Board, Uppsala, Sweden.
Maximal oxygen uptake test
Before the start of the treadmill roller-skiing test, the subjects completed a health status questionnaire; thereafter, the stature (Harpenden Stadiometer; Holtain Ltd, Crymych, UK) and body mass (Midrics 2; Sartorius AG, Goettingen, Germany) were measured. The roller-skiing tests were performed on a motor-driven treadmill (Saturn 450/300rs; h/p/cosmos sports & medical GmbH, Nussdorf-Traunstein, Germany). The subjects used the laboratory’s roller skis (Pro-Ski C2; Sterners Specialfabrik AB, Dala-Järna, Sweden) and their own poles with plastic tips (Black Plastic Tip; LEKI Lenhart GmbH, Kirchheim, Germany) provided by the laboratory. Throughout the ![]() test, expired air was continuously analyzed with a metabolic unit (Jaeger Oxycon Pro; Erich Jaeger GmbH, Friedberg, Germany) with a 10 s resolution. Before each test, the expiratory flow meter and the O2 and CO2 analyzers were calibrated according to the manufacturer’s specifications. The subjects were familiar with the testing procedures and were instructed to perform only light training on the 2 days preceding their scheduled test days.
test, expired air was continuously analyzed with a metabolic unit (Jaeger Oxycon Pro; Erich Jaeger GmbH, Friedberg, Germany) with a 10 s resolution. Before each test, the expiratory flow meter and the O2 and CO2 analyzers were calibrated according to the manufacturer’s specifications. The subjects were familiar with the testing procedures and were instructed to perform only light training on the 2 days preceding their scheduled test days.
The ![]() test, commenced using the diagonal stride technique, was initiated at a treadmill speed of 10.9 km·h-1 and an inclination of 2.4° for 30 s. Thereafter, the speed was increased by 0.1 km·h-1 and inclination were increased by 0.4° every 30 s until volitional exhaustion. The
test, commenced using the diagonal stride technique, was initiated at a treadmill speed of 10.9 km·h-1 and an inclination of 2.4° for 30 s. Thereafter, the speed was increased by 0.1 km·h-1 and inclination were increased by 0.4° every 30 s until volitional exhaustion. The ![]() was defined as the highest mean oxygen uptake during a 60 s period when meeting the criterion of a plateau in oxygen uptake despite an increased exercise intensity. The plateau was identified as described earlier20 and was based on the recognition of data points that fell outside (and below) the extrapolated 95% confidence interval (CI) for the
was defined as the highest mean oxygen uptake during a 60 s period when meeting the criterion of a plateau in oxygen uptake despite an increased exercise intensity. The plateau was identified as described earlier20 and was based on the recognition of data points that fell outside (and below) the extrapolated 95% confidence interval (CI) for the ![]() –work rate relationship.
–work rate relationship.
Body composition test
The second test day started with the body composition test, and the subjects were instructed to be well hydrated and to refrain from alcohol (24 h), caffeine (12 h), food intake (8 h), and exercise (8 h) before start of the DXA body composition measurements. Moreover, to ensure consistency, the scans were performed by a certified and experienced densitometrist. The subjects were also instructed to empty the urinary bladder and to remove all metal and plastic artifacts. Thereafter, the subjects were positioned centrally on the scanning bed, arms separated from the trunk with palms placed flat on the bed, and legs supported with a velcro strap. These preparations were performed to minimize the potential influence of variations in body water content and food intake and positioning of the subjects on the accuracy of the DXA body composition measurements. Fat mass, LM, and bone mineral content were analyzed, and whole-body LM was used as test variable in the correlation analysis.
Performance data
To determine the subjects’ performance capability in sprint and distance races, ski-ranking points were obtained from the valid FIS cross-country list at the time of the tests. The FIS-point system is constructed to rank the skiers, and a lower FIS-point value indicates better ability to perform. A subject’s FISsprint are based on an average of the skier’s best five FIS-point results from the last 12 months in sprint competitions.
For a specific skiing competition, the skier receives FIS-point value, which is the sum of the race points and the race penalty. The calculation of a skier’s race points (P) is based on the formula:  , where Tx is the skier’s race time (s), T0 is the winner’s race time (s), and F is the race factor (1200, for sprint competitions). Consequently, a female sprint skier will get 12 points per percent difference in finish time between her and the sprint prolog winner’s time. For example, the 11 World Cup winners in sprint competitions during the actual season had a mean finish time of 178.1±8.1 s; therefore, a finish time difference of 1 s corresponds to 6.7±0.3 points. The race penalty is calculated as the sum of the three best FIS-point values of the competitors who finished among top five of the sprint prolog race divided by 3.75. If the calculated race penalty is lower than the minimum penalty of the specific race, minimum penalty is applied to the race. Minimum penalty for FIS competitions is 15. For races included in the World Cup, World Ski Championships, and Olympic Winter Games, no race penalty is added to the FIS-point value (ie, race penalty is fixed to 0).
Statistical analyses
The scaling of the test variables, established during the physiological tests (ie, ![]() and LM), was based on a previously described allometric scaling approach.21 This approach has previously been used to predict the performance in cross-country skiing.22–25
and LM), was based on a previously described allometric scaling approach.21 This approach has previously been used to predict the performance in cross-country skiing.22–25
To evaluate how the ![]() and body mass (m) influenced the FISsprint, the following power function model was applied:
and body mass (m) influenced the FISsprint, the following power function model was applied:
|
|

where the FISsprint is the actual ski ranking for sprint competitions (points), b0 is a constant, ![]() is the maximal oxygen uptake (l min-1), m is the body mass (kg), e is the multiplicative error ratio, and b1 and b2 are the scaling exponents.
is the maximal oxygen uptake (l min-1), m is the body mass (kg), e is the multiplicative error ratio, and b1 and b2 are the scaling exponents.
The log transformation of Model (1) yielded the following result:
|
|

Model (2) enabled the use of linear regression to estimate the constant β0 and the scaling exponents β1 to β2.
Moreover, to establish the influence of the LM and body mass on the FISsprint, the following power function model was applied:
|
|
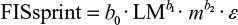
where the FISsprint is the actual ski ranking for sprint competitions (points), b0 is a constant, LM is the lean mass (kg), m is the body mass (kg), ε is the multiplicative error ratio, and b1 and b2 are the scaling exponents.
The log transformation of Model (3) yielded:
|
|

Linearization of the model allowed linear regression to be used to estimate the constant b0 and the scaling exponents b1 to b2.
The assumptions of parametric tests were checked before the power function modeling. The test variables’ agreement with a normal distribution was assessed with the Shapiro–Wilk test. The homogeneity of variance and collinearity were evaluated using the Koenker test and the variance inflation factor, respectively. The independence of the outcome variable is ensured as a consequence that the skiers’ FISsprint are based on results from different sprint competitions.
Pearson’s product–moment correlation coefficient test was used to evaluate the linear relationships between FISsprint and the simple ratio-standard scaled and absolute expressions of both ![]() and LM. Correlation analysis was also performed to investigate the relationship between the FISsprint and body mass. The statistical analyses were processed using the R statistical data program, Version 2.13.2 (R Development Core Team, Auckland, New Zealand) and IBM SPSS Statistics software, Version 23 (IBM Corporation, Armonk, NY, USA); all tests were performed at an alpha of 0.05.
and LM. Correlation analysis was also performed to investigate the relationship between the FISsprint and body mass. The statistical analyses were processed using the R statistical data program, Version 2.13.2 (R Development Core Team, Auckland, New Zealand) and IBM SPSS Statistics software, Version 23 (IBM Corporation, Armonk, NY, USA); all tests were performed at an alpha of 0.05.
Results
Test results and performance data
The ![]() results were 4.0±0.3 L·min-1 and 63±3 mL·min-1·kg-1, and the time of volitional exhaustion was 434±53 s. The LM was 48.9±4.4 kg, which corresponds to 76.5±3.3% of the body mass. The subjects’ FISsprint was 116.4±59.6 points.
results were 4.0±0.3 L·min-1 and 63±3 mL·min-1·kg-1, and the time of volitional exhaustion was 434±53 s. The LM was 48.9±4.4 kg, which corresponds to 76.5±3.3% of the body mass. The subjects’ FISsprint was 116.4±59.6 points.
The FISsprint were correlated with the absolute expressions of ![]() (r=-0.82, P=0.0040) and LM (r=-0.79, P=0.0064); however, no correlations for FISsprint were found for the simple ratio-standard scaled expression of
(r=-0.82, P=0.0040) and LM (r=-0.79, P=0.0064); however, no correlations for FISsprint were found for the simple ratio-standard scaled expression of ![]() (r=-0.41, P=0.24) and LM (r=-0.46, P=0.19). The FISsprint were related to body mass (r=-0.64, P=0.046); a greater body mass was associated with a better performance capability. Correlation analyses showed intercorrelations between body mass and LM (r=0.89, P<0.001), body mass, and
(r=-0.41, P=0.24) and LM (r=-0.46, P=0.19). The FISsprint were related to body mass (r=-0.64, P=0.046); a greater body mass was associated with a better performance capability. Correlation analyses showed intercorrelations between body mass and LM (r=0.89, P<0.001), body mass, and ![]() (r=0.86, P=0.0013), as well as between LM and
(r=0.86, P=0.0013), as well as between LM and ![]() (r=0.98, P<0.001).
(r=0.98, P<0.001).
All variables included in the Models (1)–(4) were normally distributed (P>0.05), and the assumption of homoscedasticity was not violated (P>0.05). No indication of multicollinearity was found for the variables included in the models, which were reflected by variance inflation factors <10.
Modeling based on the  for predicting the FISsprint
Statistical modeling based on Model (2) with the ![]() and m as predictor variables yielded the following result:
and m as predictor variables yielded the following result:
|
|

However, the β2 estimate of -1.30 (95% CI: -12.70 to -10.10) failed to contribute to the model (P=0.80), and loge m was excluded from Model (5). Subsequent modeling yielded the following result:
|
|

which explained 45% of the variance in the FISsprint (P=0.035). Both the β0 estimate of 12.88 (95% CI: 5.33–20.42; P=0.004) and the β1 estimate of -6.00 (95% CI: -11.45 to -0.56; P=0.035) contributed to Model (6). The retransformation of Model (6) demonstrated the following result:
|
|

Model (7) explained 66% of the variance in the FISsprint (P=0.0043; Figure 1A).
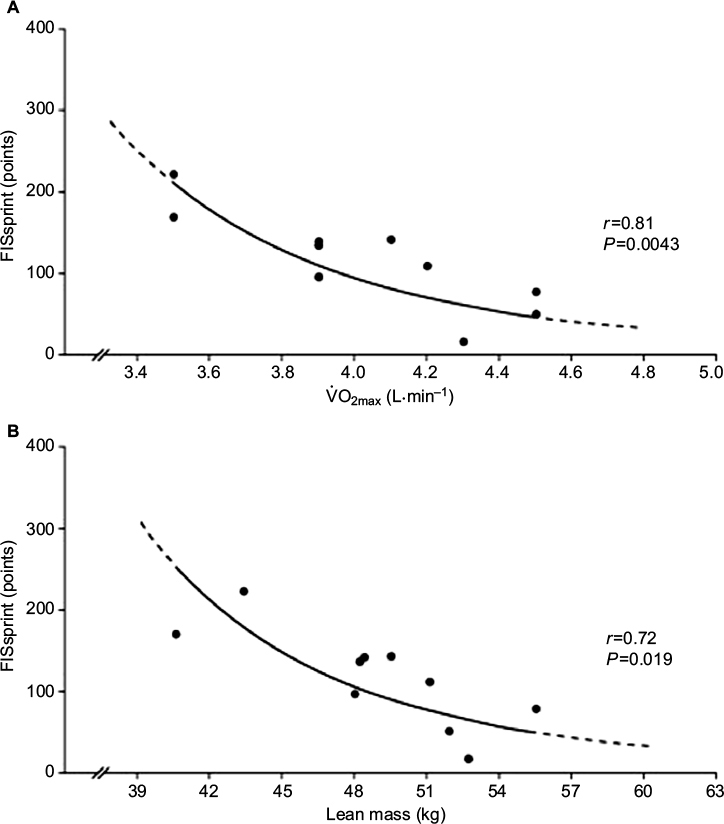 | Figure 1 Optimal power function models to predict FISsprint among elite female cross-country skiers based on (A) Abbreviations: FISsprint, International Ski Federation’s ski-ranking points for sprint competitions; |
Modeling based on the LM for predicting the FISsprint
Statistical modeling based on Model (4) with the LM and m as predictor variables yielded the following result:
|
|

However, the b2 estimate of -1.60 (95% CI: -14.58 to –11.38) failed to contribute to the model (P=0.78), and loge m was excluded from Model (8). Subsequent modeling yielded the following result:
|
|

which explained 42% of the variance in the race speed (P=0.043). Both the b0 estimate of 24.96 (95% CI: 5.34–44.59; P=0.019) and the b1 estimate of -5.25 (95% CI: -10.29 to -0.20; P=0.043) contributed to Model (9). The retransformation of Model (9) demonstrated the following result:
|
|

Model (10) explained 52% of the variance in the FISsprint (P=0.019; Figure 1B).
Discussion
The results presented herein show that the absolute expressions of both ![]() and LM are accurate predictors of competitive sprint performance among elite female cross-country skiers. This indicates that successful sprint skiers have higher maximal aerobic power and higher LM (a surrogate indicator of anaerobic capacity) compared to skiers with higher FISsprint (ie, lower competitive performance capability). These findings are supported by previous statements that sprint skiing requires both high anaerobic capacity and high
and LM are accurate predictors of competitive sprint performance among elite female cross-country skiers. This indicates that successful sprint skiers have higher maximal aerobic power and higher LM (a surrogate indicator of anaerobic capacity) compared to skiers with higher FISsprint (ie, lower competitive performance capability). These findings are supported by previous statements that sprint skiing requires both high anaerobic capacity and high ![]() .19,26 The results presented in Model (7) show that elite female skiers whose
.19,26 The results presented in Model (7) show that elite female skiers whose ![]() differs by 1% will differ in their FISsprint by 5.8%, where the skier with higher aerobic power will have a better ski ranking (ie, lower FISsprint). Moreover, Model (10) indicates that two skiers who differ in LM by 1% will differ in their FISsprint by 5.1% in favor of the skier with higher LM.
differs by 1% will differ in their FISsprint by 5.8%, where the skier with higher aerobic power will have a better ski ranking (ie, lower FISsprint). Moreover, Model (10) indicates that two skiers who differ in LM by 1% will differ in their FISsprint by 5.1% in favor of the skier with higher LM.
No previous study has used power function modeling to determine the optimal expression of either ![]() or LM to indicate competitive sprint performance among elite female cross-country skiers. The allometric scaling to determine the importance of the aerobic energy contribution revealed that body mass did not contribute to Model (5), which could be explained by the intercorrelation between
or LM to indicate competitive sprint performance among elite female cross-country skiers. The allometric scaling to determine the importance of the aerobic energy contribution revealed that body mass did not contribute to Model (5), which could be explained by the intercorrelation between ![]() and body mass; therefore, the evaluation of sprint performance capability among elite female skiers should be based on
and body mass; therefore, the evaluation of sprint performance capability among elite female skiers should be based on ![]() expressed absolutely (ie, expressed as: L·min-1). However, to attain an even more appropriate prediction of elite female skiers’ performance capability in sprint competitions, the power-function-based Model (10) is recommended (Figure 1A). One reason for this recommendation is the limitation of an unrealistic intercept for zero values a linear model would report; instead, a curvilinear relationship between
expressed absolutely (ie, expressed as: L·min-1). However, to attain an even more appropriate prediction of elite female skiers’ performance capability in sprint competitions, the power-function-based Model (10) is recommended (Figure 1A). One reason for this recommendation is the limitation of an unrealistic intercept for zero values a linear model would report; instead, a curvilinear relationship between ![]() and FISsprint (ie, an indicator of mean skiing speed) is anticipated because a linear increase in skiing speed is accompanied by a curvilinear increase in power demand.27 This is in line with allometric scaling results found for elite male skiers, where a power function model based on the absolute expression of
and FISsprint (ie, an indicator of mean skiing speed) is anticipated because a linear increase in skiing speed is accompanied by a curvilinear increase in power demand.27 This is in line with allometric scaling results found for elite male skiers, where a power function model based on the absolute expression of ![]() was reported to optimally predict race speed in a sprint prolog performance.7
was reported to optimally predict race speed in a sprint prolog performance.7
The absolute expression of ![]() corresponds to a body mass exponent of 0. This exponent deviates from the 0.67 body mass exponent that would be expected, in accordance with the “surface law”, if the qualitative differences in
corresponds to a body mass exponent of 0. This exponent deviates from the 0.67 body mass exponent that would be expected, in accordance with the “surface law”, if the qualitative differences in ![]() were directly reflected by sprint performance differences. Previously, it was reported that a body mass exponent for
were directly reflected by sprint performance differences. Previously, it was reported that a body mass exponent for ![]() of 0.5 was the optimal indicator of performance capability in 15 km skiing competitions.23,25 The body mass exponent’s deviation from 0.67 could be explained, to a great extent, by the suggested relationship between distance performance and body mass raised to the power of 0.26,28 where a larger body mass is associated with a performance advantage. This performance advantage related to body mass is most likely enhanced in high-intensity sprint performances, which in the current study is reflected by the correlation between FISsprint and body mass. This will in turn lead to an optimal body mass exponent for
of 0.5 was the optimal indicator of performance capability in 15 km skiing competitions.23,25 The body mass exponent’s deviation from 0.67 could be explained, to a great extent, by the suggested relationship between distance performance and body mass raised to the power of 0.26,28 where a larger body mass is associated with a performance advantage. This performance advantage related to body mass is most likely enhanced in high-intensity sprint performances, which in the current study is reflected by the correlation between FISsprint and body mass. This will in turn lead to an optimal body mass exponent for ![]() that is <0.5 for optimal evaluation of sprint performance capability. Because body mass did not contribute to Model (5), it could be assumed that the influence of body mass on the counteracting forces is outbalanced by the performance advantage associated with body mass. Therefore, the absolute expression best describes
that is <0.5 for optimal evaluation of sprint performance capability. Because body mass did not contribute to Model (5), it could be assumed that the influence of body mass on the counteracting forces is outbalanced by the performance advantage associated with body mass. Therefore, the absolute expression best describes ![]() as an indicator of competitive sprint performance of elite female skiers. The importance of the aerobic energy supply system for competitive sprint performance is emphasized as a consequence of completion times exceeding 2 min, which is an exercise time reported to have an equal contribution from aerobic and anaerobic energy resources;2,3 oxygen supply to the force-generating muscles, to maintain the resynthesis of ATP, is important for the skier to be able to continuously generate high propelling forces throughout a sprint competition. Hence, the aerobic energy contribution is an important factor for the sprint prolog performance in cross-country skiing. This quality is suggested to be further emphasized by the additional quarterfinal, semifinal, and final heats,29 where a quick recovery is advantageous.
as an indicator of competitive sprint performance of elite female skiers. The importance of the aerobic energy supply system for competitive sprint performance is emphasized as a consequence of completion times exceeding 2 min, which is an exercise time reported to have an equal contribution from aerobic and anaerobic energy resources;2,3 oxygen supply to the force-generating muscles, to maintain the resynthesis of ATP, is important for the skier to be able to continuously generate high propelling forces throughout a sprint competition. Hence, the aerobic energy contribution is an important factor for the sprint prolog performance in cross-country skiing. This quality is suggested to be further emphasized by the additional quarterfinal, semifinal, and final heats,29 where a quick recovery is advantageous.
Peak oxygen uptake has been reported to distinguish world class from national-class elite male sprint skiers, and, besides having a higher peak oxygen uptake, the world-class skiers had a twice as long ![]() O2 plateau time.30 The longer plateau time could indicate that the world-class sprint skiers have a higher anaerobic capacity compared to the skiers with lower level of sprint performance capability. Results of the current study suggest that anaerobic capacity also is an important sprint performance indicator of elite female skiers’ performance capability as indicated by the correlation between LM and FISsprint. Theoretically, anaerobic capacity is directly proportional to body mass;27,31 consequently, the anaerobic capacity is greater in heavier elite skiers.32
O2 plateau time.30 The longer plateau time could indicate that the world-class sprint skiers have a higher anaerobic capacity compared to the skiers with lower level of sprint performance capability. Results of the current study suggest that anaerobic capacity also is an important sprint performance indicator of elite female skiers’ performance capability as indicated by the correlation between LM and FISsprint. Theoretically, anaerobic capacity is directly proportional to body mass;27,31 consequently, the anaerobic capacity is greater in heavier elite skiers.32
The power function modeling showed that the absolute expression of LM should be used if the objective is to predict sprint performance capability among elite female skiers. This finding is in line with previously reported results, where LM expressed absolutely was reported to be very largely correlated with sprint prolog performance among elite female skiers, whereas no correlation was found when LM was expressed as a percentage of body mass.7 Consequently, LM is an important indicator of performance capability in sprint competitions; hence, a skier with a large muscle mass (LM; nearly equivalent to muscle mass) has an advantage in high-intensity sprint competitions. This could partially be explained by the fact that muscle size is related to both force-generating potential33–35 and available anaerobic energy stores,14,15 which together affect the power supply ability derived from anaerobic processes. This is in line with results from a previous study that reported that female athletes with a larger fat-free mass had a higher power output compared to their counterparts with less fat-free mass.36
However, the curvilinear relationship, as shown in Figure 1B, indicates that the performance-related effect of a specific increase in anaerobic capacity will gradually be reduced as the LM of the sprint skier increases. This is presumably a consequence of the “square-cube law”, first described in 1638 by Galileo Galilei, where muscle strength is a function of the cross-sectional area, whereas muscle mass is a function of the volume; hence, muscle volume grows faster than its cross-sectional area. Therefore, the performance-related increase in the force-generating capability, linked to a larger muscle volume, will eventually be neutralized by the concomitant increase in body mass (ie, an increase in the counteracting forces). The optimal muscle-mass-to-body-mass ratio a sprint skier should try to achieve is, however, also influenced by their ![]() and body dimensions. In general, it is important that there is a high training specificity to address the physiological needs of each individual athlete.37 Therefore, further research to clarify the interplay of the physiological characteristics and body dimensions of elite sprint skiers is warranted.
and body dimensions. In general, it is important that there is a high training specificity to address the physiological needs of each individual athlete.37 Therefore, further research to clarify the interplay of the physiological characteristics and body dimensions of elite sprint skiers is warranted.
In this context, it should be noted that ![]() and LM are highly related due to some degree of body size dependence of both variables. Elite-level endurance athletes are in general well adapted to the physical and physiological demands of the specific sport, which is supported by the low relative body composition variations of elite female skiers.11 A limitation of using LM as a surrogate indicator of anaerobic capacity is that DXA body composition measures do not report the relative distribution of aerobic type I fibers and anaerobic type II fibers. Therefore, if the objective is to describe the aerobic and anaerobic demands for sprint performance in cross-country skiing in a power function model, there is a need to further investigate the possibility to include a more nuanced measure of anaerobic capacity (eg, maximal accumulated oxygen deficit).
and LM are highly related due to some degree of body size dependence of both variables. Elite-level endurance athletes are in general well adapted to the physical and physiological demands of the specific sport, which is supported by the low relative body composition variations of elite female skiers.11 A limitation of using LM as a surrogate indicator of anaerobic capacity is that DXA body composition measures do not report the relative distribution of aerobic type I fibers and anaerobic type II fibers. Therefore, if the objective is to describe the aerobic and anaerobic demands for sprint performance in cross-country skiing in a power function model, there is a need to further investigate the possibility to include a more nuanced measure of anaerobic capacity (eg, maximal accumulated oxygen deficit).
Moreover, from a statistical point of view, a larger sample size would have been beneficial, because it would probably have reduced the CIs of the scaling exponents. Hence, a larger sample size may lead to more precise estimates of the scaling exponents and thereby a better prediction of performance capability when using the power function models. A relatively low sample size is consistent with the majority of the published research studies investigating the performance capability of elite female skiers. This is probably related to the somewhat limited population of elite female skiers and the difficulty to recruit a large number of skiers for data collection during a short time period.
Conclusion and practical applications
The results demonstrate that the physiological variables that reflect aerobic power and anaerobic capacity are important indicators of competitive sprint performance among elite female skiers. To accurately predict performance capability among elite female skiers, the presented power function models should be used. The derived models are based on the absolute expressions of ![]() and LM, respectively, because body mass failed to contribute to either of the models. Skiers whose
and LM, respectively, because body mass failed to contribute to either of the models. Skiers whose ![]() differs by 1% will differ in their FISsprint by 5.8%, whereas the corresponding 1% difference in LM is related to an FISsprint difference of 5.1%, both in favor of the skier with higher
differs by 1% will differ in their FISsprint by 5.8%, whereas the corresponding 1% difference in LM is related to an FISsprint difference of 5.1%, both in favor of the skier with higher ![]() or LM.
or LM.
The results presented in this study provide new insights into which expressions of ![]() and LM coaches should use to optimally indicate elite female skiers’ performance capability in sprint competitions. Models (7) and (10) are based on the absolute expression of
and LM coaches should use to optimally indicate elite female skiers’ performance capability in sprint competitions. Models (7) and (10) are based on the absolute expression of ![]() and LM, respectively; therefore, coaches can use the absolute expression of these variables to monitor skiers’ performance-related training adaptations linked to changes in aerobic power and anaerobic capacity.
and LM, respectively; therefore, coaches can use the absolute expression of these variables to monitor skiers’ performance-related training adaptations linked to changes in aerobic power and anaerobic capacity.
Acknowledgments
The authors thank the athletes for their participation, as well as Lars Wedholm and Magnus Knutsson for their assistance in the data collection.
Disclosure
The authors report no conflicts of interest in this work.
References
Bergh U. The influence of body mass in cross-country skiing. Med Sci Sports Exerc. 1987;19(4):324–331. | ||
Åstrand PO, Rodahl K, Dahl HA, Strømme SB. Textbook of Work Physiology. 4th ed. Champaign: Human Kinetics; 2003. | ||
Foster C, DeKoning JJ, Hettinga F, et al. Effect of competitive distance on energy expenditure during simulated competition. Int J Sports Med. 2004;25(3):198–204. | ||
Losnegard T, Myklebust H, Hallen J. Anaerobic capacity as a determinant of performance in sprint skiing. Med Sci Sports Exerc. 2012;44(4):673–681. | ||
McGawley K, Holmberg HC. Aerobic and anaerobic contributions to energy production among junior male and female cross-country skiers during diagonal skiing. Int J Sports Physiol Perform. 2014;9(1):32–40. | ||
Andersson E, Björklund G, Holmberg HC, Ørtenblad N. Energy system contributions and determinants of performance in sprint cross-country skiing. Scand J Med Sci Sports. Epub 2016 Feb 29. | ||
Carlsson M, Carlsson T, Knutsson M, Malm C, Tonkonogi M. Oxygen uptake at different intensities and sub-techniques predicts sprint performance in elite male cross-country skiers. Eur J Appl Physiol. 2014;114(12):2587–2595. | ||
Sandbakk Ø, Ettema G, Leirdal S, Jakobsen V, Holmberg HC. Analysis of a sprint ski race and associated laboratory determinants of world-class performance. Eur J Appl Physiol. 2011;111(6):947–957. | ||
Andersson E, Supej M, Sandbakk Ø, Sperlich B, Stöggl T, Holmberg HC. Analysis of sprint cross-country skiing using a differential global navigation satellite system. Eur J Appl Physiol. 2010;110(3):585–595. | ||
Carlsson M, Carlsson T, Wedholm L, Nilsson M, Malm C, Tonkonogi M. The physiological demands of competitive sprint and distance performance in elite female cross-country skiing. J Strength Cond Res. 2016;30(8):2138–2144. | ||
Carlsson M, Carlsson T, Hammarström D, Malm C, Tonkonogi M. Prediction of race performance of elite cross-country skiers by lean mass. Int J Sports Physiol Perform. 2014;9(6):1040–1045. | ||
Miura A, Endo M, Sato H, Sato H, Barstow TJ, Fukuba Y. Relationship between the curvature constant parameter of the power-duration curve and muscle cross-sectional area of the thigh for cycle ergometry in humans. Eur J Appl Physiol. 2002;87(3):238–244. | ||
Sloniger MA, Cureton KJ, Prior BM, Evans EM. Anaerobic capacity and muscle activation during horizontal and uphill running. J Appl Physiol. 1997;83(1):262–269. | ||
Miura A, Kino F, Kajitani S, Sato H, Fukuba Y. The effect of oral creatine supplementation on the curvature constant parameter of the power-duration curve for cycle ergometry in humans. Jpn J Physiol. 1999;49(2):169–174. | ||
Miura A, Sato H, Sato H, Whipp BJ, Fukuba Y. The effect of glycogen depletion on the curvature constant parameter of the power-duration curve for cycle ergometry. Ergonomics. 2000;43(1):133–141. | ||
Hegge AM, Myhre K, Welde B, Holmberg HC, Sandbakk Ø. Are gender differences in upper-body power generated by elite cross-country skiers augmented by increasing the intensity of exercise? PLoS One. 2015;10(5):e0127509. | ||
Sandbakk Ø, Ettema G, Leirdal S, Holmberg HC. Gender differences in the physiological responses and kinematic behaviour of elite sprint cross-country skiers. Eur J Appl Physiol. 2012;112(3):1087–1094. | ||
Sandbakk Ø, Ettema G, Holmberg HC. Gender differences in endurance performance by elite cross-country skiers are influenced by the contribution from poling. Scand J Med Sci Sports. 2014;24(1):28–33. | ||
Hébert-Losier K, Zinner C, Platt S, Stöggl T, Holmberg HC. Factors that influence the performance of elite sprint cross-country skiers. Sports Med. Epub 2016 Jun 22. | ||
Poole DC, Wilkerson DP, Jones AM. Validity of criteria for establishing maximal O2 uptake during ramp exercise tests. Eur J Appl Physiol. 2008;102(4):403–410. | ||
Nevill AM, Ramsbottom R, Williams C. Scaling physiological measurements for individuals of different body size. Eur J Appl Physiol Occup Physiol. 1992;65(2):110–117. | ||
Carlsson T, Carlsson M, Hammarström D, Malm C, Tonkonogi M. Scaling of upper-body power output to predict time-trial roller skiing performance. J Sports Sci. 2013;31(6):582–588. | ||
Carlsson T, Carlsson M, Felleki M, et al. Scaling maximal oxygen uptake to predict performance in elite-standard men cross-country skiers. J Sports Sci. 2013;31(16):1753–1760. | ||
Carlsson M, Carlsson T, Knutsson M, Malm C, Tonkonogi M. Oxygen uptake at different intensities and sub-techniques predicts sprint performance in elite male cross-country skiers. Eur J Appl Physiol. 2014;114(12):2587–2595. | ||
Carlsson T, Carlsson M, Hammarström D, Rønnestad BR, Malm CB, Tonkonogi M. Optimal V. O2max-to-mass ratio for predicting 15 km performance among elite male cross-country skiers. Open Access J Sports Med. 2015;6:353–360. | ||
Rusko H. Physiology of cross country skiing. In: Rusko H, editor. Cross Country Skiing. Oxford: Blackwell Science; 2003:1–31. | ||
Bergh U, Forsberg A. Influence of body mass on cross-country ski racing performance. Med Sci Sports Exerc. 1992;24(9):1033–1039. | ||
Heil DP, Hollins J, Reinking BW, Stevens K. The influence of upper body power on the body mass scaling exponent of cross country skiing. In: Linnamo V, editor. Science and Nordic Skiing II. Oxford: Meyer & Meyer Sport; 2013:129–135. | ||
Vesterinen V, Mikkola J, Nummela A, Hynynen E, Häkkinen K. Fatigue in a simulated cross-country skiing sprint competition. J Sports Sci. 2009;27(10):1069–1077. | ||
Sandbakk Ø, Holmberg HC, Leirdal S, Ettema G. The physiology of world-class sprint skiers. Scand J Med Sci Sports. 2011;21(6):E9–E16. | ||
Swain DP. The influence of body mass in endurance bicycling. Med Sci Sports Exerc. 1994;26(1):58–63. | ||
Losnegard T, Hallen J. Physiological differences between sprint- and distance-specialized cross-country skiers. Int J Sports Physiol Perform. 2014;9(1):25–31. | ||
Akagi R, Kanehisa H, Kawakami Y, Fukunaga T. Establishing a new index of muscle cross-sectional area and its relationship with isometric muscle strength. J Strength Cond Res. 2008;22(1):82–87. | ||
Häkkinen K, Keskinen KL. Muscle cross-sectional area and voluntary force production characteristics in elite strength-trained and endurance-trained athletes and sprinters. Eur J Appl Physiol Occup Physiol. 1989;59(3):215–220. | ||
Kanehisa H, Ikegawa S, Fukunaga T. Force-velocity relationships and fatiguability of strength and endurance-trained subjects. Int J Sports Physiol Perform. 1997;18(2):106–112. | ||
Nikolaidis PT. Weight status and physical fitness in female soccer players: is there an optimal BMI? Sport Sci Health. 2014;10(1):41–48. | ||
Nikolaidis PT, Ziv G, Arnon M, Lidor R. Physical characteristics and physiological attributes of female volleyball players-the need for individual data. J Strength Cond Res. 2012;26(9):2547–2557. |
 © 2016 The Author(s). This work is published and licensed by Dove Medical Press Limited. The
full terms of this license are available at https://www.dovepress.com/terms
and incorporate the Creative Commons Attribution
- Non Commercial (unported, 3.0) License.
By accessing the work you hereby accept the Terms. Non-commercial uses of the work are permitted
without any further permission from Dove Medical Press Limited, provided the work is properly
attributed. For permission for commercial use of this work, please see paragraphs 4.2 and 5 of our Terms.
© 2016 The Author(s). This work is published and licensed by Dove Medical Press Limited. The
full terms of this license are available at https://www.dovepress.com/terms
and incorporate the Creative Commons Attribution
- Non Commercial (unported, 3.0) License.
By accessing the work you hereby accept the Terms. Non-commercial uses of the work are permitted
without any further permission from Dove Medical Press Limited, provided the work is properly
attributed. For permission for commercial use of this work, please see paragraphs 4.2 and 5 of our Terms.